Lesson 3
Overview
About Lesson 3
The first thing I say when I am speaking to younger students about astronomy is that, as a science, there is one very large difference between astronomy and disciplines like physics, chemistry, biology, or the other sciences they may be more familiar with. In astronomy, we are, in almost all cases, prevented from directly experimenting on the objects we are studying. That is, we can never bring a star into a lab and dissect it or otherwise manipulate it to understand how it works. Therefore, astronomers spend their careers studying the light that reaches Earth from objects in space and using that light to learn about the nature of the Universe and the objects in it. So, in this lesson, we will devote a lot of time to describing light, how it is detected, and what it can tell us.
If this difference between the practices of astronomy vs. other sciences interests you beyond the information in the course, our research group has been doing research with K-12 students to study this question recently, and here is an article we published in 2017 on the topic:
Have Astrononauts Visited Neptune? Student Ideas about how Scientists Study the Solar System
What will we learn in Lesson 3?
By the end of Lesson 3, you should be able to:
- Describe the different types of electromagnetic radiation from radio waves to gamma-rays;
- Explain the relationship between the temperature of an ideal radiator and the amount and type of electromagnetic radiation that it will emit;
- Identify the instruments that astronomers use to detect the light from an astronomical object and explain how to interpret the various methods for displaying a spectrum of light from an object.
What is due for Lesson 3?
Lesson 3 will take us one week to complete. Please refer to the Calendar in Canvas for specific time frames and due dates.
There are a number of required activities in this lesson. The following table provides an overview of those activities that must be submitted for Lesson 3. For assignment details, refer to the lesson page noted.
| Requirement | Submitting Your Work |
|---|---|
| Lesson 3 Quiz | Your score on this Canvas quiz will count towards your overall quiz average. |
| Discussion: The Nature of Astronomical Experiments | Participate in the Canvas discussion forum "The Nature of Astronomical Experiments." |
| Lab 1 | You will complete Lab 1 this week and submit it to Canvas. |
Questions?
If you have any questions, please post them to the General Questions and Discussion forum (not email). I will check that discussion forum daily to respond. While you are there, feel free to post your own responses if you, too, are able to help out a classmate.
The Wave Properties of Light
Additional reading from www.astronomynotes.com
To begin our study of light, we’re actually going to first discuss waves in general. For example, what happens when a pebble is thrown into a pond?

As shown in the image above, where the pebble enters, the water starts to oscillate up and down. The “pieces” of water right next to where the pebble entered “feel” the water next to them going up and down, and they start to move up and down, too. The disturbance in the water moves outward as more pieces of water start to move up and down. The water in each place only moved up and down, but a wave moved outward from where the pebble entered the water. No water moved outward—what moved outward is the disturbance in the pond's surface. The outward motion of the disturbance transports energy from one place (the location where the pebble entered the water) to another (all points outward from the pebble entry point). This example illustrates that a wave is really a mechanism by which energy gets transported from one location to another.
Electric fields and magnetic fields can be disturbed in a similar way to the surface of a pond. When a stationary charged particle begins to vibrate (or more generally, if it is accelerated), the electric field that surrounds the particle becomes disturbed. Changing electric fields create magnetic fields, so a moving charge creates a disturbance in both the electric field and magnetic field near the charged particle. The outward moving disturbance in the electromagnetic field is an electromagnetic wave. The phenomenon that we refer to as “light” is simply an electromagnetic wave.

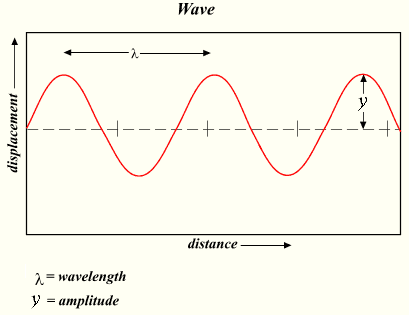
Light (or any other wave) is characterized by its wavelength or its frequency. For any wave, the wavelength is the distance between two consecutive peaks. If you stand at one particular point and count how many peaks pass by you per second, this number is the frequency.
Mathematically, the wavelength of light is usually referred to with the letter l or the Greek letter lambda (). The frequency is usually referred to with the letter f or the Greek letter nu (). Since frequency is the number of waves that pass by a point per second, and the wavelength is the distance between consecutive peaks of that wave, you can determine the speed of the wave by multiplying these two numbers, that is: . If we look at the units, wavelength is measured in some unit of distance, and frequency is measured as some number that is unitless (number of waves) per some unit of time, so by multiplying wavelength times frequency you get distance per time, which is the proper unit for a speed.
White light (for example, what comes out of a flashlight) is actually made up of many waves that each exhibit one of the different colors of light (red, orange, yellow, green, blue, and violet). The reason that different waves of light appear to be different colors of light is because the color of a light wave depends on its wavelength. For example, the wavelength of blue light is about 450 nanometers, while the wavelength of red light is about 700 nanometers. A light source that gives off white light is therefore emitting multiple waves of light with a wide range of wavelengths from 450 nanometers through 700 nanometers. All of these light waves move at the same speed (the speed of light), so you can determine their frequencies and see that red light has a lower frequency than blue light.
Try This!
There is an online, interactive tool created by the folks at HubbleSite called "Star-light, Star-bright" for younger students who want to investigate light. Go to that link and study the "Catch the Waves" and "Making Waves" content.
The wavelength of light can be extremely long (kilometers in length!) or smaller than the nucleus of an atom (one millionth of a nanometer!)—so, what do we call light that has a wavelength longer or shorter than the visible light that we are used to? Well, here is one example: light that has a wavelength just longer than red is called infrared light. The next example is light with a wavelength just shorter than violet light, which is called ultraviolet light. The entire range of possible types of light, from the longest wavelengths (radio waves) to the shortest wavelengths (gamma rays) is called the electromagnetic spectrum.
You may have learned in another course that light is peculiar in that it can be described (as we just did) as being a wave, but in some experiments it behaves, and can be described more accurately, as a particle. When we describe light as a particle, we'll refer to an individual "packet" of light as a photon. You can still refer to the wavelength and the frequency of that photon, even though you are considering it to be a particle rather than a wave. If you go back to the very first discussion at the beginning of this page, we talked about how waves transport energy. So, each photon of light does carry energy, and the amount of energy depends on the wavelength or frequency of that photon. The equation is:
In these equations, E is energy, h is Planck's constant, and c is the speed of light.
Want to learn more?
Check out the following links to learn more about...
- The experiment that discovered infrared light
- The discovery of ultraviolet light
- What are Radio Waves? (from The National Radio Astronomy Observatory)
- Anatomy of an Electromagnetic Wave (from NASA)
Before we discuss the entire electromagnetic spectrum in detail, we will next discuss how astronomers represent the range of light emitted by a source in a diagram or image called a spectrum.
Spectra
If you have ever seen a rainbow in the sky, or if you have ever seen light pass through a prism and appear to emerge as a rainbow, you have seen a spectrum. What you have witnessed in either of these two cases is white light being dispersed. The different colors of light bend by different amounts when they pass through a glass prism or water droplets. That is, when white light passes through water droplets in our atmosphere, the waves of red light get bent by a different amount than the waves of blue light, so the white light coming to you appears spread out into a rainbow.
When astronomers refer to a spectrum of light, they usually mean one of two things. They either mean an image that has been taken of the dispersed light from a source, such as this example:

(Or, as another example, a detailed spectrum of the sun),
or they mean a two dimensional graph of one of these images that plots the intensity (or brightness) of the light at a given color (which is represented usually by wavelength or frequency). See this example:
A Hubble Space Telescope spectrum of a peculiar type of star called a blue straggler.
In the blue straggler plot, a wavelength (or color) where the intensity is near 1.0 means a lot of light was received from the source with this color. On the other hand, wavelengths where the intensity is near 0.0 received very little light from the source with this color. The dips in the graph that fall to nearly zero correspond to the dark bands you see in the spectrum of the Sun, above.
We will use the word "spectrum" interchangeably to refer to these two different representations of the dispersed light from an object—either an image or a two dimensional plot—but, in both cases, what we can determine is how much light with a specific wavelength was received from an object. The Sloan Digital Sky Survey has an even more detailed set of information about astronomical spectra and how they are analyzed.
Try This!
To get a better feel for how astronomers go from images of spectra to the 2D plots of these spectra, use the “Mini-spectroscope” at the following link: Mini Spectroscopy (Note: This uses Java, so if you do not see anything but text on the linked page, try another browser or update your Java installation)
- Observe the images of the spectra of different light sources in the upper panel by selecting fluorescent lamp, Sun, red LED, etc., from the drop down menu.
- Compare the image of the spectrum to its 2D plot in the panel beneath it.
- Note that where the image is brightest, there will be peaks in the plot, and where the image is darkest, there will be dips in the plot.
These narrow features are usually referred to as “emission lines” if they are peaks, or “absorption lines” if they are dips or troughs in the spectrum. We will discuss these more in the next section.
Radio Waves to Gamma-rays
When I use the term light, you are used to thinking of the light emitted by a bulb that you can sense with your eyes, which we now know consists of many wavelengths (colors) of light from red to blue. When astronomers refer to these specific colors of light, they refer to this as the “optical” or “visible” portion of the electromagnetic spectrum. As I mentioned briefly before, radio waves are also light waves. Infrared radiation is a kind of light wave (usually abbreviated as IR). The same is true of ultraviolet waves (UV), x-rays, and gamma-rays. These are all different kinds of light. The difference between these other types of light and visible light is again the wavelength of the light.
The entire electromagnetic spectrum is presented from the longest wavelengths of light (radio waves) to the shortest wavelengths of light (gamma-rays) at the following NASA website:
That site is written at a level appropriate for younger readers, but they do a very good job of summarizing the different regions of the EM spectrum. If you want to read about each region in more detail, each page has an excellent summary:
Notice that the range that corresponds to the visible light we see with our eyes (optical range) is a very small part of the entire spectrum! David Helfand, an astronomer at Columbia University, makes the analogy between light of different wavelengths and sound of different octaves. If you would like to explore this analogy to get a sense of how limited our view is of the Universe when we only consider optical light, see David's "Seeing the Whole Symphony" website.
There are two main points that should be emphasized about the different types of electromagnetic radiation (radio, infrared, visible, ultraviolet, x-ray, gamma ray):
- The sequence from longest wavelength (radio waves) to shortest wavelength (gamma rays) is also a sequence in energy from lowest energy to highest energy. Remember that waves transport energy from place to place. The energy carried by a radio wave is low, while the energy carried by a gamma ray is high.
- Different materials can block different types of light. More specifically, the earth's atmosphere only allows certain wavelengths of light to penetrate to the surface.
Much of the science of astronomy deals with the study of how light is generated and emitted by a source, what happens to the photons of light from the source as they travel from the source to an observer, and how the observer detects those photons. Let's consider the second of those three points—what types of material can block photons of light from reaching us? If you consider only optical light, then you will probably say that light can penetrate glass, air, and water, but light easily gets blocked by solids, like plastics and metals, or perhaps the clouds in the sky.
Watch this!
To get some perspective on this question of what materials block light, I highly recommend watching the video Infrared—More than Your Eyes Can See (transcript). This video deals primarily with infrared radiation (IR), because it was produced by scientists who work with the Spitzer Space Telescope, a NASA Great Observatory that detects infrared light.
If you notice in this video, IR light behaves very differently from visible light. While visible light gets blocked by smoke, an IR camera can penetrate smoke to see a fireman in a smoke-filled room. Using visible light cameras, you could easily film someone swimming in a pool of water, however, water blocks IR light, so you would not be able to see the swimmer underwater with an IR camera. The same things goes for glass—while visible light easily penetrates a plate of glass, if you put a person behind a glass window, the person would be invisible to an IR camera. My favorite demonstration is the black plastic bag. Obviously, we cannot see a person's hand if they put it inside a black plastic bag, but an IR camera can!
As mentioned above, Earth's atmosphere (which we usually think of as transparent) is actually only transparent to certain wavelengths of light. This is illustrated in this cartoon below:

All visible light penetrates the atmosphere, most radio light penetrates the atmosphere, and some IR light passes through the atmosphere. We refer to the ranges of wavelengths in the spectrum that can pass through the atmosphere as a “window.” For example, there is an IR window for light with wavelengths from 3.0 to 4.0 microns (1 micron = 1 millionth of a meter).
In contrast, our atmosphere blocks most ultraviolet light (UV) and all X-rays and gamma-rays from reaching the surface of Earth. Because of this, astronomers can only study these kinds of light using detectors mounted on weather balloons, in rockets, or in Earth-orbiting satellites. If you study the transparency of the Earth's atmosphere plot (by the European Southern Observatory), you will see that you can represent this idea of windows in a more rigorous way. You can plot how opaque the atmosphere is (or equivalently, what percentage of photons are blocked by the atmosphere) as a function of wavelength. So, for example, 0% of green photons are blocked by the Earth's atmosphere, but nearly 100% of all photons with wavelengths shorter than 100 nanometers are blocked from reaching the surface of the Earth.
Blackbody Radiation
Additional reading from www.astronomynotes.com
First, let's do a quick review of temperature scales and the meaning of temperature. The temperature of an object is a direct measurement of the energy of motion of atoms and/or molecules. The faster the average motion of those particles (which can be rotational motion, vibrational motion, or translational motion), the higher the temperature of the object.
For this course, to keep with astronomical convention, we'll refer to temperatures using the Kelvin scale. The following is a table that compares kelvin to the more familiar temperature scales:
| Celsius | Fahrenheit | Kelvin | |
|---|---|---|---|
| All molecular motion stops | -273 | -459 | 0 |
| Freezing point of water | 0 | 32 | 273 |
| Boiling point of water | 100 | 212 | 373 |
The magnitude of one degree Celsius is the same as one K. The only difference between those two scales is the zero point.
Part of the reason for this quick review of temperature is because we are now going to begin studying the emission of light by different bodies, and all objects with temperatures above absolute zero give off light.
Our strategy will be to begin by studying the properties of the simplest type of object that emits light, which is called a blackbody. A blackbody is an object that absorbs all of the radiation that it receives (that is, it does not reflect any light, nor does it allow any light to pass through it and out the other side). The energy that the blackbody absorbs heats it up, and then it will emit its own radiation. The only parameter that determines how much light the blackbody gives off, and at what wavelengths, is its temperature. There is no object that is an ideal blackbody, but many objects (stars included) behave approximately like blackbodies. Other common examples are the filament in an incandescent light bulb or the burner element on an electric stove. As you increase the setting on the stove from low to high, you can observe it produce blackbody radiation; the element will go from nearly black to glowing red hot.
The temperature of an object is a measurement of the amount of random motion (the average speed) exhibited by the particles that make up the object; the faster the particles move, the higher the temperature we will measure. If you recall from the very beginning of this lesson, we learned that when charged particles are accelerated, they create electromagnetic radiation (light). Since some of the particles within an object are charged, any object with a temperature above absolute zero (0 K or –273 degrees Celsius) will contain moving charged particles, so it will emit light.
A blackbody, which is an “ideal” or “perfect” emitter (that means its emission properties do not vary based on location or the composition of the object), emits a spectrum of light with the following properties:
- The hotter the blackbody, the more light it gives off at all wavelengths. That is, if you were to compare two blackbodies, regardless of what wavelength of light you observe, the hotter blackbody will give off more light than the cooler one.
- The spectrum of a blackbody is continuous (it gives off some light at all wavelengths), and it has a peak at a specific wavelength. The peak of the blackbody curve in a spectrum moves to shorter wavelengths for hotter objects. If you think in terms of visible light, the hotter the blackbody, the bluer the wavelength of its peak emission. For example, the sun has a temperature of approximately 5800 Kelvin. A blackbody with this temperature has its peak at approximately 500 nanometers, which is the wavelength of the color yellow. A blackbody that is twice as hot as the sun (about 12000 K) would have the peak of its spectrum occur at about 250 nanometers, which is in the UV part of the spectrum.
Here is a two-dimensional plot of the spectrum of a blackbody with different temperatures:

The first of the two properties listed above (and seen in the image above) is usually referred to as the Stefan-Boltzmann Law and is stated mathematically as:
where:
E is the energy emitted per unit area, or intensity,
is a constant, and
T is the temperature (measured in Kelvins).
What this equation tells you is that each time you double the temperature of a blackbody, the energy it emits per square centimeter goes up by . So, for example, a blackbody that is 5000 K emits 16 times more energy per unit area than one that is 2500 K.
The total luminosity of a blackbody, that is, how much energy the entire object gives off, is the energy per unit area (E) multiplied by the surface area. For a sphere, this is:
Here, L is the luminosity (energy per unit time) and R is the radius of the sphere.
The second of the two properties listed above is referred to as Wien's Law. To determine the peak wavelength of the spectrum of a blackbody, the equation is:
For example, for the sun,
Try This!
There is an online, interactive tool from the University of Colorado for investigating the spectrum of various blackbodies. Here is the link to run it online: PhET Interactive Simulation of the Blackbody Spectrum.
- Using the temperature slider, set the temperature to 3000 K (light bulb), 5700 K (Sun), and 8490 K (hot star).
- Use the zoom in and zoom out controls on the left side to adjust the y-axis as necessary.
- Compare the color of the object (the star-shaped object near the B G R color spots), the wavelength where the curve peaks, and the height of the curve's peak for all three temperatures.
Kirchoff's Laws and Spectroscopy
Additional reading from www.astronomynotes.com
Studying blackbody radiation is a useful exercise. However, I have stressed a few times that blackbody radiation is only emitted by an “ideal” or “perfect” radiator. In reality, few objects emit exactly a blackbody spectrum. For example, consider the two spectra you looked at on a previous page: the sun and a blue straggler star. Recall that blackbody radiation is continuous with no breaks. If you look at the two spectra of stars, you see there are black bands in the image of the sun’s spectrum and areas in the plot where the intensity goes to zero or nearly zero in the spectrum of the blue straggler. These gaps in the spectrum where there is no light emitted are called absorption lines. Other astronomical sources (and also light sources you can test in a lab) are found to create spectra that show little intensity at most wavelengths but a few precise wavelengths where a lot of intensity is seen. These are referred to as emission lines.
In the early days of spectroscopy, experiments revealed that there were three main types of spectra. The differences in these spectra and a description of how to create them were summarized in Kirchhoff’s three laws of spectroscopy:
- A luminous solid, liquid, or dense gas emits light of all wavelengths.
- A low density, hot gas seen against a cooler background emits a BRIGHT LINE or EMISSION LINE spectrum.
- A low density, cool gas in front of a hotter source of a continuous spectrum creates a DARK LINE or ABSORPTION LINE spectrum.
You can also summarize Kirchoff's laws in a diagram, like this one:

Like Kepler's laws of planetary motion, these are empirical laws. That is, they were formulated on the basis of experiments. In order to understand the origin of absorption and emission lines and the spectra that contain these lines, we need to first spend some time on atomic physics. Specifically, we will consider the Bohr model of the atom.
Whenever you are studying the light from an astronomical object, recall that there are three things you need to consider:
- the emission of the light by the source,
- processes that affect the light during its travel from the source to the observer, and
- the process of detection of the light by the observer.
We observe absorption lines when the light from a background source passes through a cool gas. Somehow, it is the gas that causes the absorption lines to appear in what would otherwise appear to be a continuous spectrum. So, what is going on inside the gas?
A cloud of gas is made up of atoms, which are the smallest components of an element that retain all the properties of that element. A typical cloud of gas in space is likely to contain a lot of hydrogen and helium and trace amounts of heavier elements, like oxygen, nitrogen, carbon, and perhaps iron. The atoms inside the cloud of gas are made up of a nucleus of positively charged protons and neutrons, which have no charge. Surrounding the nucleus are one or more negatively charged electrons. Here is a cartoon image I put together of a helium atom:

The particles labeled n are neutrons, p are protons, and e are electrons.
Want to learn more?
For a bit more background and information on models of the atom, see a description by the folks at the Jefferson Lab.
Returning to atomic physics and spectroscopy, it is the electrons that are the primary cause of the absorption lines we see in stellar spectra. Bohr proposed a simple model for atoms that required the electrons to occupy “orbits” around the nucleus. The crucial part of his model is to understand that the electrons can only exist in these specific orbits, and not in between. Each orbit has a specific energy associated with it—that is, when the electron is in a specific orbit, it has a specific amount of energy. Thus, the orbits can also be referred to as energy levels. If an electron absorbs exactly the energy difference between the level it is in and any higher level, it can move up to a higher level. Once an electron is in a higher level, it will eventually fall back down to a lower level (either all at once back down to level 1, or by a series of steps down to level 1), and each time it falls from one level to a lower one, it emits a photon that carries exactly the amount of energy equal to the difference in energy between the starting energy level and the ending energy level of the electron. This is shown below. In the top panel, the electrons are falling from higher levels to lower levels and are emitting photons. In the lower panel, the electrons are absorbing photons, causing them to jump to higher levels from their lower levels.

Recall that the energy carried by a photon is given by . So, if the energy of an electron in level 2 is given by and the energy that corresponds to level 1 is given by , then the difference in energy between those levels can be shown as . So, if an electron is in the energy level and falls to the energy level, it will emit a photon with a frequency given by:
,
so, ,
and in this case
giving us
In the top panel above, there is an electron dropping from level 2 to level 1 and emitting a photon with an energy equal to the energy difference between those two levels. So, an astronomer studying the light from that cloud of gas will see an emission line in the spectrum of that cloud with a yellow color, the one labeled "2 - 1" in the spectrum on the right.
Let's tie this idea of electrons moving between energy levels back to the observed spectra of astronomical objects.
Absorption spectra
A continuous source of light emits photons with all different energies. When these photons pass through a foreground cloud (or clouds) of gas, they can encounter the atoms in that gas, each of which has a set of electrons with specific energy levels. Those photons that have precisely the correct energy to kick an electron in an atom of the gas up to a higher level can be absorbed. All those photons that do not have the exact amount of energy to excite an electron pass through the cloud without being absorbed. Thus, what we see after light from a blackbody (that is, the continuous source) passes through a cloud of gas is that most of the photons in a narrow range of frequency (or color) don't make it, leading to breaks, or absorption lines, in the otherwise continuous spectrum of the light source. The absorption lines all correspond precisely to wavelengths or frequencies that are determined by the energy difference between the energy levels of electrons in the atoms that make up the cloud. So, again referring to the energy level diagram above, when an electron goes from level 1 to level 2 by absorbing a photon, an astronomer will observe an absorption line at the frequency that corresponds to that 1 - 2 energy level difference.
Try This!
At the website for the PhET Interactive Simulations, they have a simulation that allows you to investigate models of the Hydrogen atom.
- Go to the Hydrogen atom simulation.
- Click on the play button on top of the image of the simulation to start the simulation. (Note: Your computer / browser may require you to download it rather than play it in the browser).
- In the simulation, use the selector in the top left to choose "Prediction."
- Select "Bohr."
- Turn on the power to the electron gun (click the red button on the drawing) and observe the simulation.
Emission spectra
If you have a low density cloud of gas that is being warmed by some process, the electrons in the atoms in that cloud of gas will not be in the lowest level—they will be in higher levels. So, as they cascade down to the ground level, they will emit photons with precise frequencies, giving rise to emission lines. Neon lights you see in store windows contain low density gas, and the electrons get excited when you run current through the bulb. As the electrons cascade down to the ground level (level 1), they emit emission lines in the red part of the spectrum. Here is an image of a neon containing bulb, and the spectrum it creates when you pass its light through a prism:


A few consequences
Finally, let's end this discussion of spectra with a few consequences of the above physics:
- The energy levels of the electrons in an atom are like fingerprints—no two elements have the same set of energy levels, so the atoms of no two elements create the same pattern of absorption or emission lines. What this means is that if we observe absorption lines caused by a cloud of gas, we can tell what elements make up that cloud by the wavelengths or frequencies of the absorption lines. Tables exist that list all of the known wavelengths of the lines from a particular element as measured in the lab.
- A star will create an absorption line spectrum because the continuous spectrum emitted by the dense, opaque gas that makes up most of the star passes through the cooler, transparent atmosphere of the star.
- The electrons in the gas clouds that create absorption lines should also eventually fall back down to the ground level, so they should also be emitting photons with exactly the same wavelengths as the absorption lines. They do this, but the reason we still observe absorption lines is because the re-emitted photons can be emitted in any direction, while the absorption only occurs along our line of sight.
- When you observe an absorption spectrum of an astronomical object, any cloud of gas between us and the object can absorb light. So, in a typical star, you see absorption lines from the atmosphere of the object, you might see absorption lines caused by intervening gas clouds between us and that star, and finally, Earth's atmosphere will also absorb some of the star's light.
Visible Light Telescopes
Additional Reading from www.astronomynotes.com
Start Here!
The Hubble Space Telescope Science Institute team has put together an excellent resource on the history of telescopes called "Telescopes from the Ground Up." It covers much of what I'm going to present below, so I recommend spending some time looking through the material provided under the link "Get to the root of it: Basic Science Concepts." Many of the links in the material below take you to pages from this excellent resource.
The last step in studying the light from astronomical objects is detecting it when the light arrives here on Earth. The standard instrument that astronomers use to detect light is a telescope, which collects the light and brings it to a focus, and a camera to record the light from the object. Telescopes have three main functions:
- to gather as much light from an object as possible,
- to focus the light into a sharp image, and
- to magnify the image.
Magnification is probably the most familiar function of a telescope. Here is a comparison of two different familiar astronomical objects. One appears as seen with the naked eye, and the other is magnified. This presentation (with credit to Penn State Astronomy & Astrophysics) allows you to click through slides that demonstrate the magnification you can experience with a telescope or binoculars.
As you'll see at the Hubblesite pages about "What do telescopes do?" and "What makes a good telescope?," though, magnification is the least important property of telescopes.
The most important property is a telescope's light gathering power. The larger the aperture (the opening at the top of the telescope tube), the more light the telescope will gather. To understand this, picture a telescope as a “light bucket.” If you want to collect as much rain as possible in a short time, you would go out during a storm with a wide-mouthed bucket instead of a drinking glass, because the opening in the bucket will collect more raindrops than the glass in the same amount of time. Telescopes work the same way. As photons “rain” down on Earth, a telescope with a bigger aperture will collect more of them than a telescope with a smaller aperture. Thus, the light-gathering power (which measures how bright an object appears, or, alternatively, how faint an object is that is just barely detected) of a telescope is determined by the area of the opening at the front of the tube. For this reason, astronomers have built larger and larger telescopes since they were first invented four centuries ago.
Since most telescopes have circular apertures, the light gathering power is proportional to the area of the aperture, or . So, given two telescopes of different apertures (say one that is 1 meter across, and the second that is 4 meters across), the light gathering power of the 4 meter telescope is times better. You can translate that statement in the following way: you can say that if you look at the same object with the 1 meter and 4 meter telescopes, the object will look 16 times brighter through the 4 meter than it does through the 1 meter. Or, the 4 meter telescope will be able to observe objects 16 times fainter than the limit of the 1 meter telescope.
Try this!
You can get an idea for how much more powerful a modern research telescope is than the human eye. That is, how much fainter an object can you observe with the Keck telescope than with just your eye?
Repeat the calculation above, but use 10 meters for the diameter of the Keck, and 5 mm for the diameter of the pupil of your eye.
The earliest telescopes were simple—they had an objective lens at the end of an empty tube. The lens was shaped so that it would take parallel beams of light and focus them to an image inside the tube. An eyepiece (another lens at the other end of the tube), allowed you to magnify the small image in the telescope tube so that it appeared larger to your eye. Refractors (telescopes that use lenses to focus light) create sharp images; however, they suffer from chromatic aberration. That is, different colors of light get focused to different points (recall how glass prisms disperse white light into its component colors), so the blue light from a star is not focused as well as the red light, causing stars to be surrounded by a blue halo. For this (and other reasons described below), refracting telescopes were eventually superseded by reflecting telescopes (which use mirrors, not lenses).
Reflecting telescopes are empty tubes with curved mirrors fixed to the bottom of the tube. The mirror will focus parallel rays of light to a point inside the tube, near the top of the tube. Since the primary mirror is fixed at the bottom of the tube, a second, smaller mirror is set in the top of the tube to direct light out through the side of the tube into an eyepiece. This is called a Newtonian reflector. If the second mirror instead sends light back down the tube and through a hole in the bottom of the tube, that is called a Cassegrain reflector. The images created by reflectors are not usually as sharp as those created by refractors, because it is difficult to get curved mirrors to bring all of the light from a distant object to a common focus (an effect called spherical aberration).
In their article on buying your first telescope, Sky & Telescope magazine compares and contrasts these two types of telescopes and also has cutaways of the interior of a refractor and reflector, showing the path light takes to the eyepiece.
The largest refractor still in use today is the Yerkes refractor, which has a 40” (one meter) aperture. There are several reasons why larger refractors have not been built:
- As lenses get larger, they begin to sag under their own weight, degrading their ability to accurately focus light.
- The largest lenses need to be incredibly thick, but they can only be supported along their edges, where the glass is thinnest.
- Lenses need to be completely transparent and allow as much light as possible to penetrate. Thick, massive lenses are expensive to polish on both sides and absorb light.
Want to learn more?
The American Institute of Physics has written an excellent historical piece on how reflector telescopes became the standard research telescope.
Reflectors don’t suffer from most of the problems mentioned in this Lesson. Mirrors can be supported along the entire back side, correcting for the sagging problems of large refractors. Only the front of a mirror needs to be polished, and if the coating degrades and begins to reflect less light, it can be recoated to restore its reflection efficiency.
A 2.5 meter (100 inch) reflector has been in use at Mount Wilson in California since 1917, a 5 meter (200 inch reflector) has been in use at Mount Palomar in California since 1948, and the twin Keck 10 meter (400 inch) telescopes have been operated on Mauna Kea in Hawaii since the 1990s. All of the largest telescopes in the world are reflectors, and the next generation of large telescopes include proposed instruments with mirrors of 25 - 40 meters in diameter like the Thirty Meter Telescope, The Giant Magellan Telescope, and the Extremely Large Telescope.
The Effect of the Earth's Atmosphere
Additional reading from www.astronomynotes.com
To begin this page, let me ask a rhetorical question:
How close to you must a car be in order for you to tell that it has two headlights?
On the page, there is no opportunity for me to pause and let you think about it, so I'll just give you the answer. When a car is very close to you, your eye can easily tell that it has two bright headlights. However, when that car is one mile away from you, are you certain that you would still be able to tell? Your eye can tell that two distinct light sources are distinct if the angle that separates them is greater than 1/60th of a degree (a unit of measurement called an arcminute; an arcsecond is 1/60th of an arcminute). If those two light sources are separated by an angle smaller than this (which happens if two lights separated by 6 feet are about 4 miles away from you), you would see them blurred together, appearing as a single light source. Click on the Start button in the Flash animation below to see the animation and note at what point you see two headlights.
This is a type of calculation that will come up repeatedly. So, let's do an example here. If you consider yourself standing, observing the car from a distance, you can picture a right triangle with you at one point (near the vertex with the angle labeled in the image below).

If the separation between the headlights is the side labeled b, then the distance between you and the car is the side labeled a. You can ask how far from you the car must be for the angle to be equal to 1 arcminute. The value of the tangent of is equal to b/a, so, if you do the calculation below, you find:
or
If .
You can do the same experiment on stars. If two stars are separated by more than an arcminute on the sky, you are likely to be able to tell that they are two distinct stars just with your eye. If two stars are so close together that they cannot be split by your eye, with a telescope you may be able to resolve them into two distinct point sources of light. A rule of thumb is that:
The angle that a telescope can resolve is inversely proportional to the size of the aperture of the telescope.
That is, the larger the aperture of the telescope, the smaller the angle it can resolve. Mathematically, you can say that the minimum angle a telescope can resolve, , is proportional to the wavelength of light you are observing divided by the diameter of the telescope, or:
However, this simple rule of thumb only works for telescopes on the Earth with apertures less than about 30 cm. The light from a point source in space coming towards Earth passes through our atmosphere. Turbulent motion in different layers of air in the atmosphere blurs the light from stars into blobs about 1 arcsecond in width (this is why stars appear to twinkle). Thus, even if a telescope is technically capable of resolving two light sources separated by less than 1 arcsecond, the atmosphere will blur them out, causing them to appear as one blob of light rather than two.
The effect of the atmosphere on our view of the sky is called “seeing,” and it varies by location on the sky and over time. If you observe an object near the horizon, you are looking through a path with the maximum amount of atmosphere between you and the object, so the seeing will be bad and the stars will be blobs larger than 1 arcsecond. If you look towards your zenith, you are looking through the least amount of atmosphere, so the stars will appear sharper than those at the horizon. Sometimes the atmosphere is more turbulent, so you can have nights where the seeing is excellent and the stars appear smaller than 1 arcsecond, and at other times the seeing can be poor and stars can appear to be up to 5 arcseconds in diameter or more!
In order to maximize the usefulness of telescopes, astronomers build them on top of the highest mountains in the world (for example, Mauna Kea in Hawaii). At these heights, you are above a good fraction of the atmosphere, and the seeing is better than at sea level. Even better is to put a telescope in orbit, like the Hubble Space Telescope. Hubble is in orbit about 350 miles above the Earth, so its view of the sky does not suffer from “seeing” caused by Earth’s atmosphere. For this reason, the average Hubble image of an astronomical object is ten times sharper than most ground based telescopes can achieve.
Watch this!
Astronomers can actually correct for the effect of seeing. For example, watch this movie of a technique called speckle interferometry. In the movie, that weird blob on the left that looks filled with "speckles" of light is really what our eyes and telescopes see when they look through the atmosphere at two stars. The light from the stars hits the Earth's atmosphere, and the stars' light appears blurred and appears to bounce around, seeming to come from different parts of the sky. But astronomers can use computers to measure the pattern of speckles and recreate what the image would look like without any atmosphere. The image on the upper right is a reconstruction of speckles, showing that what looks like a big blob is the light from two stars, not one.
It turns out that the group that produced this movie took their website down, so the link above takes you to another set of course materials made by folks who captured a local copy of the movie.
Besides speckle interferometry, today telescopes are being outfitted with systems called adaptive optics, which can make the corrections for atmospheric distortion in real time. When those systems are used, they can improve the angular resolution of a telescope on the ground to perform as if it were in space, above the distorting effects of the atmosphere.
Watch this!
At YouTube, they have a movie of an adaptive optics system being used to observe a binary star. About halfway through the movie, the system is switched on.
Additional Resources
We covered a lot of ground in this lesson, and there are a lot of resources beyond those I linked in the lesson itself:
- At the PhET site with the link to the blackbody interactive simulation, there are resources for teachers on the topic of blackbody radiation.
- There is another applet on Blackbody radiation from the folks at the Sloan Digital Sky Survey.
- There are several different simulations of the Bohr model and the interaction between photons and electrons, including:
- another Bohr model simulation from the University of Toronto.
- In the page on telescopes, we did not have enough time to cover telescopes that are sensitive to other parts of the EM spectrum, but there are a number of resources on this topic, including:
- the Chandra X-ray Observatory;
- Spitzer Space Telescope background on Infrared Astronomy;
- the National Radio Astronomy Observatory on Radio Astronomy;
- literally dozens more—if there is a particular type of telescope you'd like to know about, feel free to post the request to Piazza or as a comment below.
- The image of the spectrum of neon came from an article written by a chemist about spectroscopy. He has an in-depth site on spectroscopy, including images of different lamps containing gas of a specific type that are available to be used in your own presentations.
- There is an excellent movie made about observing with small telescopes called "Seeing in the Dark" by Timothy Ferris. It was broadcast on PBS, and this project, too, provides a lengthy set of resources for teachers and families on astronomy, telescopes, and night sky observing.
- There is a company called Slooh.com that is offering remote telescope imaging for a price. There is another online observatory that is free for educators called the "MicroObservatory".
- As part of the International Year of Astronomy, astronomers have created "Galileoscope" kits that offer inexpensive but high quality telescope kits for school or home use.
Tell us about it!
Have another website or printed piece on this topic that you have found useful? Share it in our Comment space!
Summary & Final Tasks
Another one of the main messages I hope you have gathered from this lesson is how important the study of light is to astronomers. For the most part, everything we learn in the upcoming lessons will rely on astronomical observations that rely on the tools and techniques you just studied.
Activity 1
Directions
First, please take the Web-based Lesson 3 quiz.
- Go to Canvas.
- Go to the "Lesson 3 Quiz" and complete the quiz.
Good luck!
Activity 2 - Discussion
Directions
For this activity, I want you to reflect on what we've covered in this lesson and to consider some of the most basic questions about how astronomers do astronomy. Since this is a discussion activity, you will need to enter the discussion forum more than once in order to read and respond to others' postings.
Submitting your work
- Enter the "The Nature of Astronomical Experiments" discussion forum in Canvas.
- Post your ideas about the topic I have posted to that forum.
- Read postings by other ASTRO 801 students.
- Respond to at least one other posting by asking for clarification, asking a follow-up question, expanding on what has already been said, etc.
Grading criteria
You will be graded on the quality of your participation. See the grading rubric (identical to the one from Earth 530) for specifics on how this assignment will be graded.
Activity 3 - Lab
Directions
During this week, you should complete work on the lab exercise you began during Lesson 2.
- Lab 1, Part 2 is located on the next page.
- Perform the data analysis and calculations, and write answers to the questions.
- Submit your work to Lab 1 in Canvas.
Reminder - Complete all of the lesson tasks!
You have finished the reading for Lesson 3. Double-check the list of requirements on the Lesson 3 Overview page to make sure you have completed all of the activities listed there before beginning the next lesson.