Wind Energy
Wind Energy
By this point in the course, you have been told repeatedly that our energy and electric power systems are dominated by fossil fuels. And this is true. But you may be surprised to know that in the United States and many other countries, wind is among the fastest-growing sources of new power plant investment, as measured by megawatts of new capacity. In several areas, including Texas and the Mid-Atlantic (where a boom in fossil fuel production is currently underway), wind power is the largest source of new electrical generation capacity, making up a majority of new plants. That’s right – in oily Texas, more than 50% of new electrical generation in recent years has been from wind. In fact, Texas is the US leader in wind energy generation – much more than even California, which has somewhat greener political leanings.
In this section of the course, we’ll take a look at what’s going on in all those tall towers sprouting up along ridgetops and plains – and out in the middle of the ocean, in some places. Humans have been harnessing the wind to do useful work in one fashion or another for many thousands of years – the first “wind energy” systems were actually sailboats. Humans have also been smart enough to realize that wind is a very useful cooling mechanism on hot days. So in some sense, the windows in our houses are a form of wind energy. Windmills (the precursor to today’s wind turbines) appear to have first been used in Greece around two thousand years ago.

How Wind Turbines Work
How Wind Turbines Work
In a conventional power plant (fueled by coal or natural gas), combustion heats water to steam and the steam pressure is used to spin the blades of a turbine. The turbine is then connected to a generator, which is a giant coil of wire turning in a magnetic field. This action induces electric current to flow in the wire. The workings of a wind turbine are much different, except that instead of using a fossil fuel heat to boil water and generate steam, the wind is used to directly spin the turbine blades to get the generator turning and to get electricity produced.
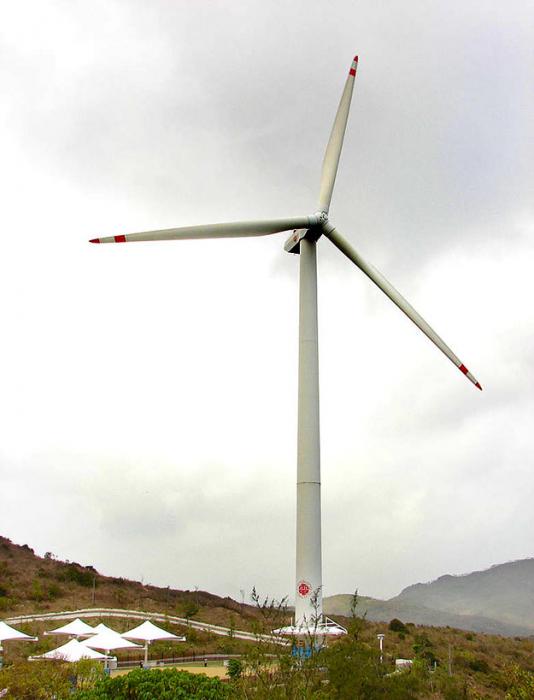
The inner workings of a wind turbine consist of three basic parts, seen in the figure below. The tower is the tall pole on which the wind turbine sits. The nacelle is the box at the top of the tower that contains the important mechanical pieces – the gearbox and generator. The blades are what actually capture the power of the wind and get the gears turning, delivering power to the generator. The direction that the blades are facing can be rotated so that the turbine always faces into the wind, and the pitch of the blades (the angle at which the blades face into the wind) can also be adjusted. Pitch control is important, especially in very windy conditions, to keep the gearbox from getting overloaded.
The amount of power (in Watts) collected by a wind turbine is explained in the following equations:

The Kinetic Energy (KE) of the wind is:
Where m = mass, and v = velocity of wind.
Power (P) in the wind is the KE per unit time, so we replace the mass(m) with the mass flux rate dm/dt:
Where p = air density, and A = swept area of blades.
So the wind Power(P) is:
If the wind turbine collected all of this power, the wind would have to stop and the blades would stop spinning. If you want the blades to keep spinning, it turns out that you can collect about 60% of the power (called the Betz limit).
So, collectible Power(P) is:
How much power could we get with a turbine whose blades are 100m long, with a wind speed of 10m/s (about 22mpg>, with an air density of 1.2kg/m2?
This is clearly a lot of power! But, mechanical inefficiencies related to the gears and the generator mean that we might only get 30% of this figure, but that is still a lot of power from one turbine.
All wind turbines have a minimum wind speed that differs depending on the size but is typically about 4-5 m/s (10 mph) and maximum wind speed above which they shut down to avoid damage, usually around 20-25 m/s (about 50 mph). Most wind turbines have a maximum spinning rate, reached a bit above the minimum velocity, and when the wind speeds up, the pitch of the blades is adjusted so that the rate of spinning remains more or less constant. The figure below shows a typical "power curve" for a small wind turbine.

The wind, as you may have noticed, is highly variable in any given place, but as a general rule, it is stronger and steadier as you rise up above the ground. This is because friction between the wind and the land surface slows the wind. But there is also a lot of regional variation in the wind velocity. Both of these factors (elevation above the ground and location) can be seen in the maps below, showing the average wind speed in the US at two different heights.


The graphs above show annual average wind speeds in the US at 2 different heights above the ground surface. For reference, 10 m/s is 22.3 mph. You can see that the wind speeds at 100 m are far greater than at 30 m — this is the friction effect of the land surface (which is minimal above large water bodies). As you can see, the Great Plains have great wind potential, as do the Great Lakes and offshore areas on both coasts.
The area covered by the turbine’s blades is another important factor in determining power output. While wind turbines are available in a wide variety of capacities, from a few kilowatts to many thousands of kilowatts, it’s the larger turbine sizes that are being deployed most rapidly in wind farms. Several years ago the image on the right side of the figure below of a Boeing 747 superimposed on a wind turbine gave an astonishing representation of the scale of the state-of-the-art wind technology. Now, turbine rotor diameters are approaching the size of the Washington Monument!

Activate Your Learning
Given that the area of wind captured by the turbine is proportional to the square of the radius (essentially the length of the blade), if you were to double the length of a wind turbine's blade, how much more power would that turbine generate? Assume that wind speed and all other variables remain the same.
Click for the answer.
Market Deployment of Wind Energy
 Market Deployment of Wind Energy
Over the last 20 years, growth in the total installed capacity of wind energy generation across the globe has been growing rapidly. Germany was the first country to lead the development of wind power, but the US and China have dominated the growth since 2010. China is especially impressive in terms of its recent growth.

Part of the reason for this growth is the steady decline in the cost of wind energy, as discussed in the previous section on solar energy. But government policies are another important factor. The United States has one of the most volatile markets for wind energy in the world, while those in Europe and China have been among the most stable. This is due in part to differences in how governments in these countries treat wind energy. In many parts of Europe, wind energy (and other renewable generation technologies) enjoy subsidies and incentives known as feed-in tariffs. The feed-in tariff is essentially a long-term guarantee of the ability to sell output from a specific power generation resource to the grid at a specified price (typically higher than the prices received in the market by other generation resources). The United States, on the other hand, has favored a system of tax incentives called the “Production Tax Credit” (PTC) to encourage renewable energy deployment. In theory, a tax incentive should not work much differently than a feed-in tariff (both are just payments based on how many kilowatt-hours are generated). But the PTC has historically needed to be re-authorized frequently by the US Congress – this “on-off” policy strategy has been a major factor in the volatility of wind energy investment in the US as shown in the figure below. It is worth noting that the PTC was recently renewed for 2013, but will lapse again at the end of 2019, so it is difficult to say what impact it will have on wind investment going forward.

The above clarifies that government policies are important to the growth of renewable energy production (both wind and solar). In a very real way, you can think about these policies (feed-in tariffs or tax credits) as a form of investment. Governments can also provide investments in the form of funding for basic research related to these technologies. In general, these investments do not add up to a huge amount when seen in the context of a country's gross domestic product (GDP), which is a measure of the size of the economy, as seen in the figure below.

The Potential Wind Energy Resource
The Potential Wind Energy Resource
A quick look at an annually-averaged wind map of the world (below) shows the regions of the world that are best suited for the production of wind energy in colors ranging from yellows to red (where the average winds are at least 9.75 m/s or 20 mph). The offshore regions are clearly the best in terms of the energy potential, but not all of these offshore regions are close to where people live. Even for onshore portions of the world, the wind energy potential does not always coincide with where the people are concentrated. This points to the necessity of new transmission lines to deliver this wind energy to major population centers.

So, just how much energy could be produced by the wind? In 2009, a group of scientists makes some calculations to estimate the potential for the world and the US, using wind data and some assumptions about the size and spacing of the turbines. They assumed 2.5 MW turbines on land, and 3.5 MW turbines offshore, which were big for that time. They assumed that you could only place the turbines in unforested, ice-free, nonmountainous areas away from any towns and that the turbines had to be spaced by several hundred meters so they do not interfere with their neighbors. They further assumed that each turbine generated just 20% of its rated capacity to account for mechanical problems and intermittent winds. What they came up with is summarized in the table below, and it is pretty remarkable. The units here are exajoules (EJ = 1 x 10¹⁸ Joules) of energy over the course of a year. For reference, in 2018, the US total energy consumption (not just electrical energy) was 106 EJ and the global consumption was about 600 EJ. So, with just onshore wind energy, the potential is more than twice what we consume in the US, and more than 4 times the global consumption. But getting there is a matter of installing a lot of wind turbines!
| Region | World | Contiguous US |
|---|---|---|
| Onshore | 2484 | 223.2 |
| Offshore 0-20m | 151 | 4.32 |
| Offshore 20-50m | 144 | 7.56 |
| Offshore 50-100m | 270 | 7.92 |
| Total | 3024 | 244.8 |
Now let's consider a more practical question — how much wind energy have we managed to produce, and can we somehow project the past trends into the future? The figure below shows the global history of wind energy (solar is plotted too just for comparison), and you can see that it is growing fast.

Both of these curves are growing exponentially, and the history so far suggests a growth of about 25% per year on average. If we assume that they continue to grow in the further following this exponential growth, we can project where we'll be at any time in the future. Below, we see where we might be in the year 2030, just eleven years from now. What you see is that we end up with vast amount of wind energy by 2030 — if it grows at the same rate it has been growing at, we end up with almost 300 EJ per year, about half of the current global energy consumption, and if it grows at a smaller rate of 20% per year, we still end up being able to supply about 20% of the total global energy demand.

Barriers to Additional Wind Energy Development
Barriers to Additional Wind Energy Development
It is worth noting that, as with solar, wind investments are not always happening in the windiest areas. The reality is that there are a large number of factors that influence the development of wind energy globally. As the technology for wind energy has improved, other factors have also come together to create market drivers for wind power. These drivers include:
- Declining Wind Costs
- Fuel Price Uncertainty
- Federal and State Policies
- Economic Development
- Public Support
- Green Power
- Energy Security
- Carbon Risk
 Earth: The Operator's Manual
Despite all of these barriers to wind energy deployment, wind is, in fact, one of the fastest-growing sources of power generation in the world. Wind energy is being embraced in areas that have traditionally favored low-carbon energy development as well as in areas that have a long history of fossil fuel extraction and use. The following video explains how two very different regions - Denmark and Texas - have embraced wind energy.
Video: Yes, in My Backyard (aka YIMBY!): (9:08)
We have already mentioned the US Production Tax Credit, which is responsible for a good amount of the trend in US wind energy investment – both up and down! A decline in wind investment in 2010 and 2011 was due in part to the global financial crisis. A drop in natural gas/wholesale electricity prices has made some planned projects less competitive than originally expected and halted development. There has also been a slump in the overall demand for energy. Another factor that limits the growth of wind power capacity is the constraint on the transmission infrastructure. As can be seen in the wind capacity map on the previous page, many of the locations that experience the windiest conditions are not close to coastal population centers. The cost of upgrading this infrastructure is significant — perhaps $30 to $90 billion in the US by the year 2030 according to some estimates. This seems like a huge amount, but consider that our government spends about \$20 billion each year in direct subsidies to the fossil fuel industry, which would sum up to \$200 billion by the year 2030. In light of that, the upgrade cost for better transmission lines is a bargain!
Note
A great resource for information on the current state of the US wind market and the wind industry, in general, is the US Wind Technologies Market Report [13]which is annually published by the Mark Bolinger and Ryan Wiser of the Lawrence Berkeley National Laboratory.