Module 5: Hurricane Formation and Evolution
Module 5: Hurricane Formation and Evolution
Introduction
Without a doubt, coastal storms are among the most devastating natural hazards to impact human societies. Even seemingly small hurricanes and nor’easters have the capacity to do significant damage in very short periods of time. Each year, these catastrophes result in numerous injuries, the loss of life and property, and are detrimental to the economic vitality of coastal regions around the world. Coastal storms, whether tropical or extratropical, result in significant erosion from high winds, high water levels and coastal flooding, and large turbulent waves. The list of damaging storms in recent years is extensive, in part because storms of one type or another can be generated throughout the year. In the U.S., hurricane season lasts from early summer through early winter, and when hurricane season is over, extra-tropical storms (nor’easters) become more frequent. In Module 5 we will learn about how these storms form and evolve and how they can be forecasted. In Module 6 we will examine the lessons dealt from recent storms.
Goals and Objectives
Goals and Objectives
Goals
- Students will continue to develop the fundamental geospatial skills and concepts needed to assess cyclones and their formation.
- Students will develop an understanding of the relationships between the atmosphere and hydrosphere that result in the development of cyclones.
Learning Objectives
By the end of this module, students should be able to:
- describe the atmospheric conditions that are required for the formation of tropical and extra-tropical cyclones;
- analyze case studies of how coastal systems are impacted by cyclones;
- investigate geomorphological changes that result from coastal hazards.
Module 5 Roadmap
| -- | Assignment |
|---|---|
| To Read |
In addition to reading all of the required materials here on the course website, before you begin working through this module, please read the following required readings to build some required background knowledge on storm surge: Extra readings are clearly noted throughout the module and can be pursued as your time and interest allow. |
| To Do |
|
Questions?
If you have any questions, please use the Canvas email tool to contact the instructor.
Hurricane Formation
Hurricane Formation
Tropical cyclones are storms that are born in tropical oceans and depend on warm water for their source of energy. They originate between 4° and 22° S of the equator, and between 4° and 35° N of the equator. During the northern hemisphere’s summer (July-September), most of the energy is delivered to the sub-tropical region of the northern hemisphere. The result is the development of large cyclonic (counterclockwise rotating) cells that are termed hurricanes if they form near North America and typhoons if they are formed in the western Pacific. Tropical cyclones do not, however, occur in the equatorial zone. More than two-thirds of tropical cyclones occur in the northern hemisphere and occur between May and November, when the ocean is at its warmest, with a peak in August and September. In the southern hemisphere, they occur between December and April, with peaks in January and February, where they are typically called cyclones.
We generally associate tropical cyclones with the damage they do when they come in contact with land, but they spend most of their “life” out in the ocean and are a phenomenon best explained in terms of heat transfer between the atmosphere and the ocean.
The Birth of a Cyclone
The generation of a tropical cyclone is dependent upon the transfer of thermal energy from the ocean to the atmosphere. When significant volumes of warm water vapor move upwards, low-pressure cells develop at the Earth's surface and large storms are generated. In the process, water vapor evaporated into the atmosphere will cool and condense. This is ultimately how storm clouds are produced. As the water begins to fall back to the surface, large scale convective cells are generated, and the air mass is forced to spin in response to the Coriolis Effect. This causes deflection of air masses to the right in the northern hemisphere and deflection to the left in the southern. For storms to sustain themselves, the upward movement of warm water vapor needs to be constantly resupplied or the storm will weaken and eventually fall apart. The video beelow explain how a hurricane forms and outlines its anatomy:
Video: Hurricanes 101 | National Geographic (2:57)
How a hurricane develops: Hurricane Facts [4]
For a tropical cyclone to generate, the temperature of the upper 60 meters (~200 ft.) of the ocean water must be greater than 26°C (~79°F). In addition, certain atmospheric conditions are needed to drive the formation of convection cell described above. Horizontal shear winds prevent formation; conversely, in conditions with low wind shear, heat and moisture are retained to allow continued development. The building of the tall cumulonimbus clouds associated with a tropical cyclone depends on the deep convection currents extending into the troposphere. The initial anomaly is called a tropical wave, and then with progressive intensification, it is called a disturbance, an investigation (where it is given a number), then a depression, tropical storm, then a hurricane. This is explained in the following video:
Video: The Basics of Hurricanes and Tropical Weather Forecasting (8:07)
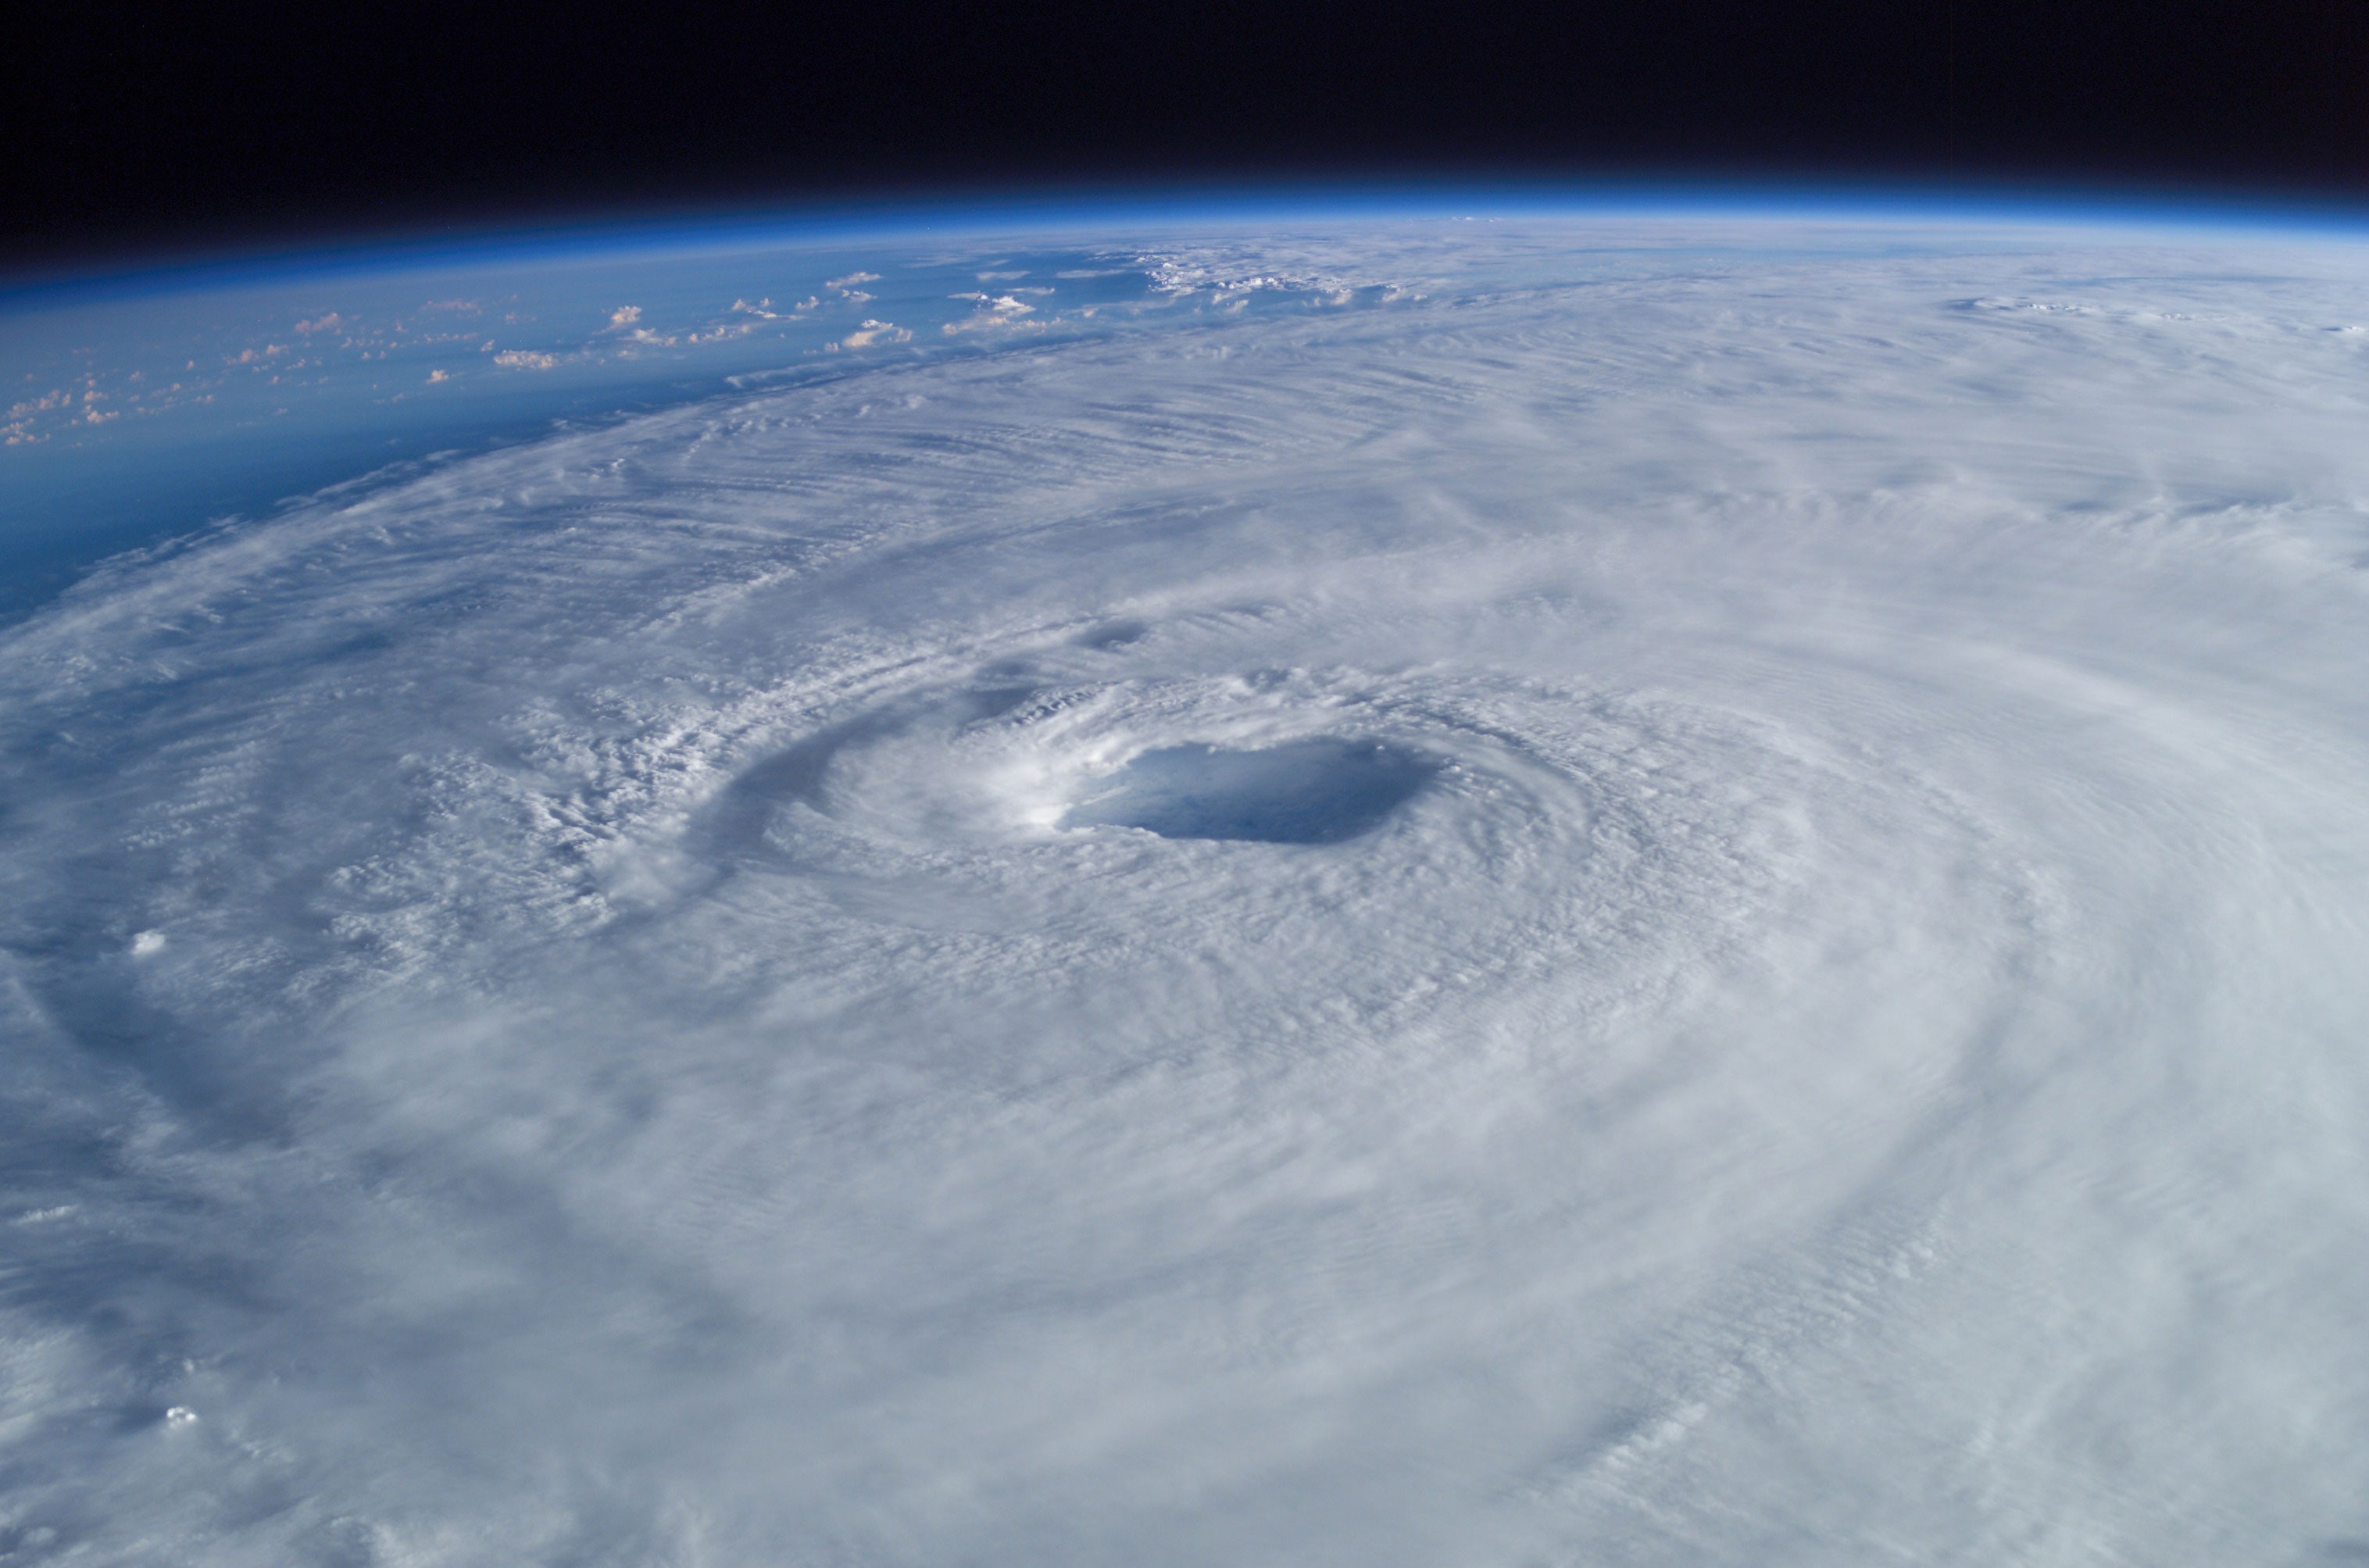
Anatomy of a Hurricane
There are distinct stages of formation that vary greatly from storm to storm. As the pressure drops in the center of the storm, the winds that rotate around the center increase. Narrow cloud bands form, spiraling inwards. The center of the storm, or the eye, is where the lowest pressure is found. The eye wall at the edge of the eye has some of the strongest winds and intense thunderstorms, but the eye itself is characterized by calm. The hurricane-force winds may extend out from the eye for 300 km (~186 miles). The strongest winds occur towards the right-hand side of the center in the direction of the cyclone’s path, so a storm moving north will have the strongest winds in the northeastern quadrant.


Hurricane Tracks and Forecasting
Hurricane movement is guided by surface winds. As we will see in the examples given, the Atlantic hurricanes travel west or northwest across the Atlantic and then recurve to the north and then northeast. This curvature is dictated by the Coriolis effect, which is caused by the Earth’s rotation. This pattern also occurs in the northern Pacific. Although these are predictable patterns, each storm has a unique path and there is great variation depending upon the atmospheric conditions near the storm, which act as steering forces. As we will see later wind movements are a function of atmospheric pressure, with storms basically moving around high pressure systems and towards low pressure systems.
Nevertheless, the patterns made by the historic tracks seen in the animation below show how the storms generally follow certain rules. This predictability aids in forecasting the paths using satellite data and numerical modeling.
Video: Hurricane Tracks Animation and Cumulative Map (0:14) (Video is not narrated.)
The cyclone’s interaction with the ocean’s surface has an effect of reducing the surface temperatures of the ocean. Once the storm approaches land, it encounters shallower water and begins interacting with coastal features. Friction and loss of the warm water “fuel” remove energy from the system, and it will dissipate once over land. It is at the ocean-land interface that the storm surge, which builds with the storm in the ocean, creates a tremendous hazard for those living on the coast.
Summarizing Warm Core Storms
Summarizing Warm Core Storms
Understanding the impact of storm systems as they come ashore is not straightforward. Although storm systems may have similar size, strength, and movement speeds, differences in their trajectories relative to the shoreline, together with geomorphic features present along the shoreline (i.e., reefs, mangroves, barrier islands, constructed shorelines, etc.), water depth, and timing of tides all have profound impacts on the intensity of damage individual storms produce. As will be seen in the case studies in Module 6, passive continental margins like the Atlantic seaboard, although they have limited risk from tectonic movement, are subject to extreme impacts from tropical storms. It is, therefore, incredibly important for communities located in such settings to not only understand the risks, but also to work to limit and minimize storm impacts on the human landscape as much as is possible while limiting the cost of doing so. Future modules will explore these factors in more detail.
Learning Check Point
Learning Check Point
Quick Review
Watch the following two videos for review and answer the Learning Check Point questions to be sure you have understood the material provided.
The following video provides an animation of the 2005 hurricane season, with an excellent review of the conditions required for active hurricane formation.
Video: Hurricanes Explained: How 2005 Was the Perfect Storm (4:56)
This NASA video explains the mechanism of tropical cyclone formation in terms of heat transfer.
Video: Hurricane Heat Engine (2:05)
Take a few minutes to answer the questions below.
Storm Surge
Storm Surge
Storm surge is the high water generated by the storm’s winds while at sea. The surge is the height of the water over and above the predicted astronomical tide. This is distinguished from “storm tide,” which combines surge and tide. When the storm approaches land, it pushes this elevated water onto the land, with energy levels that cause tremendous damage to human structures and rearrange natural coastal features. It is the most dangerous storm aspect, responsible for perhaps 75% of the deaths associated with tropical cyclones. A large storm surge can penetrate miles inland, destroying property, moving large amounts of sediment, and wiping the landscape clean of vegetation.
For more information about Storm Surge
- To appreciate storm surge impacts, check out the surge example at NOAA Storm Surge [13]. Note the animation is in shockwave format, so some tablets/iPads may not be able to play it directly, although Safari, Explorer, or similar browsers on other computers should be able to.
- The National Hurricane Center - Storm Surge Unit: Introduction to Storm Surge [14] document illustrates many important key points related to storm surge.
Historic Storm Surge Records
Historic Storm Surge Records
As we mentioned above, coastal settings with embayments are particularly prone to high waters from storm surges, which get magnified when they enter a bay or river mouth. Rocky shorelines are less susceptible because these shorelines are often configured with relatively deep offshore bathymetric approaches that do not support the development of significantly high volumes of water in the nearshore region. In the U.S., the largest storm surge ever recorded occurred during Hurricane Katrina in the area of Pass Christian, Mississippi, where the level was increased as it entered several bays, including Bay St. Louis. Combined with wave heights, the storm surge at Biloxi, Mississippi created a high watermark in excess of 30 feet.
Based on modeling using NOAA’s SLOSH (Sea Lake and Overland Surge from Hurricanes) program, geoscientists have predicted the highest theoretical storm surges, and all occur on either the Gulf Coast or the East Coast in areas that are heavily populated and developed. Go to: U.S. Storm Surge Records [15] to read about how first-hand evidence, such as high watermarks, and modeling such as the SLOSH models, can help us understand the potential of storm surge.
Globally, the highest storm surge ever is reported in northern Australia in 1899 during a cyclone. Although the exact height is still uncertain, it is reported to have been in excess of 40 feet. For details, see World Storm Surge Records [16]. In the Indian Ocean, a cyclone produced a surge measured at just over 10 meters (~34 feet) in Bangladesh in 1970. This event produced the largest number of casualties on record for all storms globally, see The 35 Deadliest Tropical Cyclones in World History [17].
You can use the NOAA Historical Hurricane Tracks server to search for specific storms. See the link below the image in the figure below.

Measuring the Strength of Tropical Cyclones
Measuring the Strength of Tropical Cyclones
Before looking at examples of catastrophic storms, let’s review the ways they are quantified in terms of strength. The Saffir-Simpson Scale was developed in 1971 by civil engineer Herbert Saffir and meteorologist Robert Simpson, who at the time was director of the U.S. National Hurricane Center (NHC).
The scale uses the wind speeds and pressure of a storm to determine its strength. It did not originally take into account storm surge. The modified version of the Saffir-Simpson Scale on HurricaneZone.net [19] attempts to rectify this by assigning storm surge ranges to the scale. Please visit this site to learn about the classification of tropical cyclones (Categories of hurricanes and typhoons).
An abbreviated summary of this modified Saffir-Simpson scale is shown below.
|
Category |
Wind speeds/ surge |
Types of Damage |
|---|---|---|
|
Category 1 hurricane |
74-95 mph (64-82 knots; 119-153 km/hr); surge 4-5 ft (1.2 – 1.7 m) |
“Minimal”: Minimal damage to buildings, boats, trees, etc. Main threat is from heavy rainfall. |
|
Category 2 hurricane |
96-110 mph (83-95 knots; 154-177 km/hr); surge 6-8 ft (1.8 -2.6 m) |
“Moderate”: Roof and window damage to buildings; severe damage to mobile homes. Some damage from storm surge. |
|
Category 3 hurricane |
111-130 mph (96-113 knots; 178-209 km/hr); surge 9-12 ft. (2.7 – 3.9 m); |
“Extensive”: Structural damage to buildings; complete destruction of mobile homes. Storm surge destroys some buildings and causes shoreline erosion. |
|
Category 4 hurricane |
131-155 mph (114-135 knots; 210-249 km/hr); surge 13-18 ft (4 -5.5 m) |
“Extreme”: Structural failure of some buildings. Severe coastal erosion. Hurricane force move winds far inland. |
|
Category 5 hurricane; Super typhoon |
Greater than 155 mph (135 knots; 249 km/hr) surge >18 ft (5.5 m). |
“Catastrophic”: Catastrophic storm surge damage; Many buildings destroyed beyond repair. |
Because storm surge is not well integrated into the Saffir Simpson Scale, it is often under-appreciated for the risk it poses when a hurricane comes ashore. It is the most dangerous part of any coastal hurricane impact and has been responsible for the majority of the deaths that have been recorded as a result of U.S. hurricanes. A good example is found in Hurricane Katrina. Although classified as category 3 upon landfall, Katrina was category 5 while in the Gulf of Mexico. Therefore, the storm surge, at more than 20 ft. fit the category 5 surge classification according to this modified scale.
Factors Determining the Size of the Storm Surge
Factors Determining the Size of the Storm Surge
You may wonder why a storm like Katrina, which made landfall as a category 3 storm, had such a huge storm surge compared to say, Harvey, which came ashore as a category 4 storm. When a hurricane is approaching a shoreline, the communities in its path need good information about what to expect. But surge predictions are tricky.
Refer back to the Saffir-Simpson Scale [19]. These are estimates that are not 100% reliable because there are many factors determining the height of a surge. They include:
- the size, intensity, speed, and angle of approach of the storm itself;
- the width and slope of the offshore shelf and the slope of the shoreline itself;
- the shape of the shoreline and coastal features present.
The intensity (wind speed) of a storm is directly related to the storm surge – with the relationship shown in the Saffir-Simpson Scale [19]. The speed of a storm has an impact on the size of the surge, but it is not a simple relationship. A fast-moving storm can generate a higher surge, but when a slow-moving storm pushes a surge into a coastal bay or other enclosed water body, it can cause the surge height to magnify. A large storm (in terms of diameter) can produce a larger surge than a smaller storm because the winds affect a larger area of the ocean. The communities along the Gulf Coast are keenly aware of another feature of hurricane storm surges: The greatest surge occurs in the northeast quadrant of the storm, to the east of the eye of a northward moving hurricane. Hence, Bay St. Louis, Mississippi received a greater storm surge than New Orleans in Katrina.
If the offshore continental shelf is wide and gently sloping, the storm surge will be greater than if the shelf is narrow and steeper. If the land also has a very gentle gradient, then there will be little to stop the storm surge from flooding far inland. This is the case on the Louisiana coast as well as other locations along the Gulf coast. This topic will be revisited in Module 8. Narrow inlets along a coastline will tend to magnify a storm surge as the water is funneled into the opening and “piles up”. This was evident on the Mississippi coast when Katrina’s storm surge came ashore in 2005. See the SLOSH model animation below. Here, the surge pushed into Bay St. Louis with an almost 30 ft storm surge. Conversely, features such as offshore barrier islands can act to reduce the surge height before it comes ashore, although these features take the brunt of the energy of the surge, resulting in massive amounts of erosion.
For more information
The Sea, Lake, and Overland Surge from Hurricanes (SLOSH) Model of Katrina’s storm surge, found at Historical SLOSH Simulations [20], shows a time series reconstructing the storm surge height as the storm came ashore, pushing the storm surge into the bays and estuaries. It helps to play it at a slower speed and repeat the loop several times to appreciate how the water behaved.
More on Hurricane Prediction
More on Hurricane Prediction
Hurricane Tracks and Forecasting
As we will see in the examples given, the Atlantic hurricanes travel west or northwest across the Atlantic and then recurve to the north and then northeast. This curvature is dictated by the Coriolis effect, which is caused by the Earth’s rotation. This pattern also occurs in the northern Pacific. Although these are predictable patterns, each storm has a unique path and there is great variation depending upon the atmospheric conditions near the storm, which act as steering forces.
Nevertheless, the patterns made by the historic tracks seen in the animation below show how the storms generally follow certain rules. This predictability aids in forecasting the paths using satellite data and numerical modeling.
Video: Hurricane Tracks Animation and Cumulative Map (0:14) (Video is not narrated.)
The cyclone’s interaction with the ocean’s surface has the effect of reducing the surface temperatures of the ocean. Once the storm approaches land, it encounters shallower water and begins interacting with coastal features. Friction and loss of the warm water “fuel” remove energy from the system, and it will dissipate once over land. It is at the ocean-land interface that the storm surge, which builds with the storm in the ocean, creates a tremendous hazard for those living on the coast.
Predicting the path and intensification of hurricanes can be very difficult. As we have learned earlier, there are many factors that control how a hurricane moves, and determining whether and by how much it will intensify is also complex. These variables include sea surface temperature, steering winds, atmospheric pressure, and several others. Because of this complexity, forecasting is now always done with atmospheric models that have become far more capable and accurate in recent years. There are dozens of models that are used in forecasting, and they don’t always agree. That is why hurricane forecasts have a cone of uncertainty. Moreover, different factors impact the storm path and whether it intensifies. The National Hurricane Center in the US compiles these model forecasts, and collectively they are called Spaghetti Diagrams because of the long, closely parallel paths of the different models. The models are used to build a cone of uncertainty that shows the range of the possible storm forecasts.
Try This!
You are strongly encouraged to visit Hurricanes: Science and Society [21] for an explanation of the processes that steer hurricanes. Then, use the information on this site to answer the following questions. These will help you master the lab activity.
- Why do disturbances move westward across the tropical Atlantic?
- What is the role of wind shear in the evolution of a hurricane?
- Do high-pressure systems such as the Bermuda high attract storms towards them or steer storms away from them?
- What is the name of the critical high-pressure system in the Atlantic that guides hurricane paths?
- Why do hurricanes gradually drift northward?
- What is the overall impact of wind shear on a storm?
- What is the impact of cooling water temperatures on the strength of a storm?
So in summary, hurricanes' paths are steered by winds which are a function of atmospheric pressure systems. Intensification is impacted by wind shear as well as ocean temperature. Satellite images of a hurricane help determine whether the storm is intensifying or weakening.
Extratropical Storms
Extratropical Storms
In Module 2 we briefly discussed extratropical storms (Northeasters and fronts) and their destructive power. Here we learned an important distinction: Although extra-tropical storms are typically smaller and less powerful than tropical cyclones, they are much more frequent, so their cumulative impact on a coastline can be more significant. We will now take a closer look at these types of storms, also referred to as “Cold Core” storms.
Extratropical storms, otherwise thought of as “cold core” storms, are generally produced outside of tropical regions. In contrast to tropical storms produced by an uplift of warm moist air masses fueled primarily by evaporation of warm waters, extratropical storms are formed when cold air masses interact with warm air masses on land or at sea. As these bodies of cold air collide with warm air bodies, discontinuities (that is, weather fronts) form. As the fronts mature and strengthen, the denser, drier cold air masses move underneath the more buoyant warm air masses and help force the warm air to rise. As a result of this rising air leaving the surface, low-pressure systems, called cyclones, develop and draw air (i.e., wind) into the low-pressure center. In the Northern Hemisphere, the winds of these cyclonic systems deflect to the right as a result of the Coriolis Effect. The opposite is true in the Southern Hemisphere. As a result, cyclones have a counterclockwise rotation in the Northern Hemisphere and clockwise rotation in the Southern Hemisphere. As the warm air rises in the atmosphere, it cools and releases its potential energy as sensible heat, thereby raising the temperature, making the air more buoyant, and consequently fueling a more intense upward movement of air, which further lowers the pressure at the surface, intensifying the storm. At the same time, the water vapor in the rising air condenses, turning into cloud droplets, and they subsequently become precipitation. Through these positive feedbacks, temperature, pressure, and humidity (moisture) gradients between lower and upper-level layers of the atmosphere help fuel the continued development of high winds and extreme types and volumes of precipitation. Most extratropical storm systems are neither large nor intense and produce modest winds and precipitation totals, but when conditions are right, they become quite powerful and extraordinary in their scale and impact. Blizzards, nor’easters, and thunderstorms formed along frontal boundaries are examples of powerful extratropical storm systems.
Arctic Cold Fronts, Gulf Stream, & Nor'easters
Arctic Cold Fronts, Gulf Stream, & Nor'easters
The storms discussed above occurred on the West Coast of the U.S., but what about similar storms that form on the East Coast? When similar storms form along the eastern seaboard, they can often grow into monster storm systems that have wide-ranging impacts. When they do develop, they are termed nor’easters. In most storm formation scenarios, warm moist air masses originating from the Gulf of Mexico move north and east. They then collide with cold fronts originating from Arctic Canada that push south. In many cases, the warm air masses form ridges of high pressure that form on either side of a cold air trough. When the air masses collide, low pressure develops as the warm air mass on the leading side of the trough is forced upward.
Like tropical cyclones, these storms can actually intensify when they are fueled by warm water. In the case of nor’easters, when the low-pressure system moves over the mid-Atlantic coast, they often intersect air masses fueled by the warm Gulf Stream. This warm water produces moisture-laden air that rises rapidly when displaced by the denser cold air and helps to strengthen the convective uplift. By pumping additional warm, moist air into the atmosphere, these storm systems can become stronger, often with gale-force winds, and intensive precipitation. As most of these storms occur in the winter, they often result in significant snowfall inland and have intensive coastal impacts with high waves and intensive erosion. Each year, nor’easters can be relatively minor or can be very severe.
Video: What is a Nor'Easter? (2:30)
This video helps explain how these types of storms form.
Click for transcript of What is a Nor'Easter?.
Video: Satellite View of February Nor'easter (0:45)(No Narration)
In this silent animation produced by NASA’s Goddard Space Flight Center using NOAA’s GOES satellite, you can see how a nor’ easter formed in February 2013 when New England and much of the U.S. Northeast was impacted by heavy snowfall, ice, and high winds.
By carefully watching this video, you can follow water vapor that originates in the Gulf of Mexico and a series of cold fronts that move east from the central U.S. As this water vapor moves off the mid-Atlantic, the air masses collide and intensify into a well-organized counter-clockwise rotating low-pressure cell that brings much of the moisture at high altitude back over land from the northeast. As the center of circulation is located along the New Jersey coast, the rotation brings intensive winds out of the northeast to the New England coastline.
Module 5 Lab
Module 5 Lab
This short lab will help you hone your skills for predicting whether a hurricane is likely to develop or not, and where it might go. As we have learned, there are many factors that control whether a storm develops and its ultimate path, but here we will focus on sea surface temperature (SSTs), wind shear, and pressure. Here are the basics: for a storm to develop you need some type of disturbance, SSTs above 79oF (26oC), and for it to gain momentum you need low wind shear. Storms are steered by winds, this essentially being “deflected” or moving around areas of high pressure including the Bermuda high and towards troughs of low pressure. As we’ve said, it's more complex than that, but these are the nuts and bolts.
To hone your skills, we have set up a few practice questions. Go to Module 5 Lab (Practice). You can take this practice quiz as many times as you like and ask us questions if you don’t understand something. When you are ready, go to Module 5 Lab (Graded) to answer questions for credit. You will only get one chance at them. Again, this is a fairly short and simple exercise, but we truly hope it will help you predict the next storm!
Summary and Final Tasks
Summary and Final Tasks
Summary
We hope you have learned more about how storms form and the forces that control their movement. And why they can be so difficult to forecast. In addition, we hope you understand the elements of storms that cause damage in addition to wind: massive amounts of rain and storm surge. You'll be learning about some incredible storms and the damage they caused in the next module. We hope from now on, you'll stay tuned in the summer months to the National Hurricane Center [24].
They also have a great free app you can access on your phone through the App Store.
Reminder - Complete all of the Module 5 tasks!
You have reached the end of Module 5! Double-check the Module 5 Roadmap to make sure you have completed all of the activities listed there before you begin Module 6.
References and Further Reading
The following links are meant to provide suggestions for further investigation into some of the topics covered in Module 5 (some of these are from the module).