Module 6: Hurricane Stories
Module 6: Hurricane Stories
Introduction
The 2005 hurricane season, in which Hurricanes Katrina and Rita devastated much of the northern Gulf coasts of Louisiana, Mississippi, Alabama, and parts of Florida, went down in history as the most destructive and expensive hurricane season in US history. After a 12-year period of relative calm, punctuated by Hurricanes Sandy (NY/NJ), Ike (Texas), and Gustav and Isaac (Louisiana), along came the 2017 hurricane season, in which Harvey, Irma, Maria, and Nate devastated many Caribbean islands, the coasts of Florida and Texas, and damaged other areas along the Gulf coast. The combined effects of the 2017 storms dwarfed even the 2005 storms, which at the time seemed like an unbelievable nightmare to those affected. And then came the monster Dorian in 2019 which dwarfed them all!
These catastrophic storms leave indelible marks on the communities they impact. People measure time relative to the storm – hence the common pre-Katrina and Post-Katrina references in New Orleans. They shape the way people live, build their homes, schools, businesses, and infrastructure.
Although Katrina is now more than a decade ago, it is still considered a landmark event that re-shaped the way our society thinks about natural disasters. Since Katrina have come Hurricanes Sandy, Isaac, Irma, Maria, Harvey, and many other catastrophes in the U.S. and around the world. Each of these disasters has provided lessons in resilience. Repeated disaster has an effect of putting stress on the resources designed to help communities recover.
These catastrophes have also shaped policies that are informed by these experiences. However, these policies are not perfect. Millions of people are still living in harm’s way, and local memories fade with time. Gradually, the wisdom gained gives way to reckless building practices, among other things. Billions of dollars are spent on protective engineering structures to protect the most valuable infrastructure and population centers. But some communities inevitably remain unprotected.
In Module 6 we will look at these events from the perspective of the communities affected; looking at case studies provided by New Orleans and the Gulf Coast, New York and New Jersey, Miami, Houston, Puerto Rico, and other Caribbean islands. We will ask – are we learning to live with increasing storm impacts by building more resilient cities? Or are we repeating old mistakes again and again? We hope, in this module, you will learn about the science of coastal catastrophes, but also gain an appreciation for how hazards like hurricanes and tsunamis have the capacity to do so much damage and take so many lives. Likewise, we hope that you will be able to, throughout the remaining modules, understand the societal consequences and some possible ways forward that reduce our risk and improve our resiliency to coastal hazards.

Goals and Objectives
Goals and Objectives
Goals
- Students will continue to develop the fundamental geospatial skills and concepts needed to assess the coastal processes and hazards discussed in this course.
- Students will develop an understanding of the relationships between the atmosphere and hydrosphere that result in the development of cyclones.
- Students will consider current shoreline processes in the context of cyclones and past and present evolution of coastline morphology.
Learning Objectives
By the end of this module, students should be able to:
- describe the atmospheric conditions that are required for the formation of tropical and extra-tropical cyclones;
- analyze case studies of how coastal systems are impacted by geologic and climatic hazards such as cyclones;
- investigate geomorphological changes that result from cyclones.
Module 6 Roadmap
| -- | Assignment |
|---|---|
| To Read |
In addition to reading all of the required materials here on the course website, before you begin working through this module, please read the following required reading to build some required background knowledge on historic storms:
Extra readings are clearly noted throughout the module and can be perused as your time and interest allow. |
| To Do |
|
Questions?
If you have any questions, please use the Canvas email tool to contact the instructor.
Instructors’ Personal Hurricane Stories
Instructors’ Personal Hurricane Stories
Hurricanes are very personal for us. Dinah lived through the calamitous Hurricane Katrina in New Orleans in 2005 and Tim was literally a first responder after Hurricane Andrew struck Miami in 1992 and lived through the much less severe Hurricane Fran that hit North Carolina in 1996. We start this module with these personal stories before moving to describe several of the most significant recent storms in detail. Each storm has lessons to tell about how our society deals with national disasters, what storms will be like in the future, and what we need to do to prepare for them.
Dinah’s Experiences
Years of evacuation preceded Hurricane Katrina in New Orleans. These included Hurricane Georges, Hurricane Ivan, and others for which New Orleanians packed up their cars and headed to wherever they had a safe haven. If you did not have relatives and friends in places within driving distance that were safe, or you didn’t have a reliable car, you stayed. I had packed up my daughter and dogs and headed with friends to places like Lafayette for a three-day trip and then returned to an unscathed city on several occasions. Hurricanes on track to impact New Orleans had a habit of making a northerly turn as they approached the Mississippi River delta and hitting the Mississippi coast instead of Louisiana. We were all armchair hurricane experts by the time Katrina entered the Gulf. At the University of New Orleans, I worked with a network of coastal scientists, some of whom were actual hurricane experts, including my boss, the late Dr. Shea Penland who was a renowned coastal geomorphologist and director of the UNO Pontchartrain Institute for Environmental Sciences. He had made a fateful prediction in the Scientific American Magazine the year before that it was just a matter of time before a storm surge would overwhelm the flood protection system and devastate New Orleans. I clearly remember our staff meeting on Friday, August 26, 2005, in which we discussed the storm entering the Gulf, and the need to retrieve boats and other equipment from coastal locations. It is hard to fathom now, but three days later, on Monday, August 29, Hurricane Katrina made landfall in Louisiana. The adrenalin-driven scramble to prepare for the impending storm is now a blur, punctuated by flashes of memories of moving computer equipment away from windows, moveable objects from yards, and conferring with elderly neighbors about their plans for leaving. After several days of exhausting preparation, during which I observed a general lack of urgency in New Orleans, I was ready to evacuate. I had noticed less boarding up than for Hurricane Ivan in 2004, and many acquaintances seemed almost blasé – I so clearly remember a rowdy crowd spilling from a daiquiri bar onto the street as I made my way home on Saturday night. There was a certain amount of bravado in not leaving. But then there were so many people who did not have any good choices, being without reliable transportation or no place to go to or being too frail or sick to choose for themselves. Neighbors and extended family formed support networks, but these efforts could not avoid the coming specter of tens of thousands of people seeking shelter in the Superdome and Convention Center after the storm flooded the city. The city neglected to plan a mass evacuation by bus prior to the storm.
I evacuated with my two dogs and a few belongings on Sunday, August 28th at around 4:30 am. I heard the Mayor of New Orleans announce the MANDATORY evacuation on the radio as I drove. This was way too late. Residents would have to at least have made their plans and be packing up to leave by then. Many already had, because we were so well trained to do so, but many were too cynical or had no choice but to stay put. Others did not want to leave their property unoccupied. But we were not uninformed. I took back roads to avoid the crush on the interstate. People reported taking four hours to reach Baton Rouge, a trip that usually takes a little over an hour. This was despite the use of contraflow on the interstate highways leading away from New Orleans and the Gulf Coast. I finally arrived in the small town of Walker, to the east of Baton Rouge, where my colleagues had been gathering. There, our business manager, Karen Ramsey, and her husband had a home that could accommodate quite a few people. But I arrived too late - there was no room at the inn. I traveled on to share an off-campus LSU dorm room in Baton Rouge with my daughter, literally time sharing her bed, with the dogs sleeping underneath. The complex of student housing, which amazingly still had power, quickly filled up with evacuee families. I wasn’t sure where I was going to stay for the longer term but, I had enough friends in Baton Rouge that I was soon able to find kind people with a room where I could stay with my dogs for several weeks. The population of Baton Rouge exploded with displaced New Orleanians, which caused some tension. This was happening in cities across the south as half a million people had to find somewhere to stay.
The thing to remember about New Orleans is that it is surrounded by flood protection structures including levees and floodwalls, and the draining of the wetlands upon which the city was built has resulted in significant subsidence of the land elevation so that 50% of the land area within the flood defenses sits below sea level. The other thing was that in 2005, the levees and floodwalls, designed and built after Hurricane Betsy in 1965, to protect the city from a category 3 storm surge, were now almost 4 decades old. They were worn, had subsided, and had many flaws. We had been warned repeatedly via so many information channels that this was a recipe for disaster. The disaster slowly unfolded on Monday morning, but at first, many residents in New Orleans were unaware that it was happening. The cell towers had toppled with Katrina’s winds so only landlines still worked. I was able to call my ex-husband before my cellphone went kaput on Monday morning. He had chosen to stay and was nonchalant at that point, oblivious to the encroaching floodwaters, which had by then broken through the flood defenses in many places and the “bowl” of the city was filling up. I remember saying I thought it was a matter of time before the waters reached his house, and that is what happened. The real misery began after the storm itself had passed and moved north. People were trapped on rooftops or were wading or floating on debris through floodwaters trying to find refuge, with children, pets, and belongings in tow. It was blazing hot. Meanwhile, I was in the safety of Baton Rouge just watching in horror and feeling helpless and suffering from survivor’s guilt. I was able to travel to deliver cash I had collected before leaving New Orleans to a friend (how do you access your New Orleans bank account when everything is broken?) and go to a hotel lobby in a small Southwest Louisiana town to use their computer to add texting to my cellphone account so my daughter could locate her father. Not many people were using texting in 2005 and with cell towers down, for some reason, texting worked but calling did not. A family I talked to at the hotel were from St. Bernard Parish, southeast of New Orleans and devastated, and they did not know if members of their family were alive or not, or how to reach them. My daughter was able to locate her dad who had made it out of New Orleans with dogs and cats; and she picked them all up in Baton Rouge. Many people and pets were not so lucky. Many ended up in shelters far from home and loved ones could not locate them. Children were separated from parents and elderly grandparents were lost in the chaos. Helicopters continually plied back and forth between Baton Rouge and other locations and the city, on rescue missions.
My first trip back into the city was on September 16. I clearly remember the unforgettable, indescribable smell as we got close to the UNO campus. My colleagues and I were headed there to pick up work vehicles and equipment to bring back to Walker to set up a temporary office for the Pontchartrain Institute. We needed a special permit to enter the city at that point. Although the city had been drained of floodwaters by then (using pumps shipped in from around the world), the entire population of over 480,000 had forcibly been moved out (by 2006 only about half had returned). We stopped to check on colleagues’ houses which had flooded to the roof and the contents jumbled around inside, covered with stinking mud. Dead fish lay in the streets. There was no power, so we had to feel our way up hot, dark stairwells to our offices where mold was already growing, making breathing hazardous. The National Guard had used our offices as a triage center and the campus was a processing center where people were shipped out to shelters. It was quite surreal. I remember looking out of a third-floor window at the downtown skyline and thinking how normal it looked from there, while the city as a whole was wrecked. The UNO campus sits on slightly elevated land on the shore of Lake Pontchartrain, next to the London Avenue drainage canal in which the concrete floodwalls had been breached and Lake Pontchartrain had poured into the low lying Gentilly neighborhood. It is worth repeating that 80% of the city had gone underwater and approximately 1,000 people had died (the exact number will never be known). My old neighborhood, where I had recently sold my home of 14 years had been deeply flooded. The neighborhood where was renting an apartment was fine because it was in Carrollton, an old part of the city on the natural high ground built by the Mississippi River. But on this occasion, I was not allowed to go to my apartment. We were there strictly on official business and we loaded up the trucks and drove back to Walker.
I was very fortunate to still have a job and an intact home, and eventually, we set up a place to work for a year in Walker. Our offices on the UNO campus were closed off for that duration. The fall semester, which had been so rudely interrupted by Katrina, continued in some fashion with online classes, but mostly it was a wash. Students scattered to other institutions to try to continue their studies, only slowly trickling back as accommodation was hard to come by. Residents of the city were able to return neighborhood by neighborhood in October, about six weeks after the storm. Most had to commute from outlying areas to begin work on their wrecked homes (remember the count of flooded houses in New Orleans alone was 134,000). The traffic was bumper to bumper from Baton Rouge to New Orleans with materials for rebuilding being shipped in. Recovery had to start from scratch. At first, the power supply was spotty and the infrastructure sparse, with few services such as groceries, doctors, etc. It was very hard to imagine how the city could possibly recover. I returned in November, having exhausted accommodation options, but still had to commute 1-2 hours to Walker to go to work.
One of the tasks I had in my varied job as a research associate after Katrina was to accompany a photographer who was working on documenting the aftermath of the storm. This took us to many outlying neighborhoods in St. Bernard parish as well as all over New Orleans. Shattered neighborhoods were silent and empty. Dried mud covered everything. Cars sat atop fallen roofs and household items and children’s toys were strewn across the landscape. This was before rebuilding began in earnest, but signs of activity were here and there. Homemade yard signs and sculptures made from the debris were evidence of the enduring humor of the south Louisiana people. Later the sounds of hammering and voices of the thousands of volunteers and day laborers who poured in to help rebuild filled the eerie silence. It was to be a long and difficult road to recovery and one of the many details that we could not fathom before the impending disaster happened, despite all the warnings. Year by year, for the first decade, New Orleans slowly became a fully functioning community. The levees were rebuilt and reinforced. The scars are still clearly visible with swaths of vacant land where there were once neighborhoods and shopping centers, but lives have been rebuilt and the city has moved on.
Hurricane Katrina Damages
Tim’s Experiences
I was literally one of the first people into Miami after Hurricane Andrew roared ashore on August 24th, 1992. I was on my way down to South Florida to fly to Cuba for fieldwork when I heard about the storm approaching. I had a seat on a charter flight, very difficult to obtain so there was no backing out or changes possible. The storm accelerated in the couple of days before slamming into southern Dade county leaving folks little time to prepare. I had lived in South Florida in the late 1980s and grew used to the days-long wait as storms approached, store shelves emptied out, windows were boarded up, only to see the storm veer off or weaken at the last minute. So it was easy to see how everyone was a little complacent in 1992.
Andrew formed over the Atlantic on August 16th, 1992 but very rapidly gained strength on August 23rd over the Bahamas. The storm made landfall in the early morning hours of August 24th near Homestead FL as a category 5 storm with sustained winds of 165 mph making it one of the strongest storms ever to make landfall. Gusts were over 175 and there were reports of gauges on boats recording 195 mph. The fact that the storm intensified so fast as it approached also increased the shock of the damage.
I packed my truck full of coolers, water, camping gas canisters, canned goods, and tarps, left Chapel Hill in the early afternoon of the 24th, and arrived in Miami in the early morning hours of the 25th. One good thing about a hurricane is the cops let you speed, I made 862 miles in just over 10 hours! The morning brought into focus the extent of the damage, but also how most of the heavily populated central and northern part of Miami had minimal damage and had really dodged a bullet. If the storm had gone just 10 miles further north the cost would have been far, far higher. But that was of no consolation to the communities that got hit, and hit very hard. In Kendall and South Miami, where I used to live, and in the Homestead, Cutler Ridge and Perrine areas the damage was unlike anything I had ever seen. It was like Andrew had mowed down the whole landscape, houses included. Almost every home had extensive roof damage, windows had blown out, and houses and pools were full of debris and sand. Some areas were worse than others with whole parts of homes completely destroyed. But the very worst areas were cordoned off by police and inaccessible. Almost every palm tree had lost all of its leaves and palm fronds were everywhere. Roofs of gas stations were now mangled metal and road signs and billboards were flattened. The sun was out and blazing, but power was out everywhere. People were in a daze and told harrowing stories of nights spent in bathtubs covered by mattresses only to emerge to see their homes almost gone. My supplies were happily accepted. I spent much of the next few days nailing tarps to roofs in the blazing sun before leaving for Cuba. It was amazing to leave powerless South Florida and arrive in the relative comforts of the communist country. My Andrew experience left an indelible mark on me, it made me in awe of the force of nature and fascinated by hurricanes and the threat they cause to coastal communities. From then on I became an avid storm watcher, glued to the Weather Channel when a storm was active and to the National Hurricane Center’s website. I’ve seen how sophisticated prediction has become, but, even then, there is still a lot of uncertainty which makes living in a coastal community very challenging in the summertime.
I experienced a hurricane up close, Hurricane Fran in Chapel Hill, North Carolina in 1996, although the storm was very minor compared to Andrew and Katrina. The storm was just turning seaward when I went to bed and the TV forecaster said “looks like we are out of the woods, folks” then the power went out. Imagine the shock then when a 150-foot red oak fell on our tin roof at 2 AM! The noise was deafening and woke me out of a deep sleep. Outside the wind was incredible and all I could hear was the snapping of trees then the boom as they hit the ground, tcshick-thud, tcshick-thud, tcshick-thud, tcshick-thud. They were snapping like matches! It was pitch dark and impossible to see anything and I was terrified (living through a storm is much worse at night believe me!). As I wandered around the house everything looked OK………until water started pouring through the light fixtures and terrified squirrels who came down with the tree and into the house came out of their dazes! Luckily we didn’t have to wait long to see the damage in the daylight, the huge oak tree had cut our roof in two, but fortunately hit the edge of the house so much of it was spared. It could have easily hit me when I was sleeping. Neighbors didn’t fare as well, whole pieces of houses were lifted out of their foundations by giant trees, people were trapped in their bedrooms, and cars were cut in half. Turns out the damage was done by microburst tornadoes spun off by the storm. Sustained winds in our neighborhood were about 60 mph but the tornadoes were over 100 mph.
After the storm came weeks-long rebuilding effort, eight hot days with no power, the constant buzz of chainsaws through the daylight hours, nights of curfew, haggling with the insurance companies. Within months things were back to normal, but the psychological scars were there for years, sleepless nights when thunderstorms came, worrying about which trees could fall and what direction they would fall in. The worrying would increase in summer as storms approached. But my Fran experience was nothing like what people who have lived through category 4 and 5 storms have gone through. And specifically what Dinah went through during and after Katrina.
Hurricane Andrew Damages
Hurricane Andrew: August 1992
Hurricane Andrew: August 1992
Hurricane Andrew was a wake-up call for the US. Hurricane Hugo in 1989 had caused a massive amount of damage in Charleston, SC as a result of wind and a massive storm surge up to 6 meters (20 feet). But Andrew was the first major hurricane to hit a major metropolitan area in a long time, and it exposed glaring weaknesses in preparedness, especially building codes. The storm narrowly missed downtown Miami and Miami Beach, which would have led to truly catastrophic damage and many more fatalities. However, the areas that took direct hit including South Miami, Perrine, Cutler Ridge, and Kendall had seen rampant development over the preceding ten years so the damage was still devastating.
Hurricane Andrew
Andrew came ashore in the early morning of August 24, 1992, near Homestead with sustained winds of 165 mph, gusts of 177 mph and a storm surge up to 5 meters (17 feet). Fortunately, the storm had a very rapid forward motion of 16 mph so the maximum impact didn’t last that long, and the storm was quite compact, however, Andrew’s winds still wrecked a narrow trail of havoc. In 1992 development in South Florida was booming. Much of the western part of the Miami metro area is land that has been reclaimed from the Everglades over the past half-century, one of the most extensive and radical reclamation projects in the world. The Everglades is the largest subtropical wetlands in the world, aptly called “a sea of grass” by the famous naturalist Marjorie Stoneman Douglas. The wetlands naturally drain to the south, but this was changed in the 1950s to 1970s when drainage canals were constructed, supposedly to control flooding from hurricanes, and diverted the water to the west and east. The resulting changes to the natural landscape were nothing short of disastrous. Rapid urbanization has covered large areas of the former Everglades with concrete leading to flash flooding in storms, which undoubtedly made damage from Andrew more intense. As devastating storms like Andrew and sea level rise (Module 3) threaten coastal parts of South Florida, we are constantly reminded that the Everglades were not meant to be urbanized.
The other lesson from Andrew had to do with building codes. I remember from my time living in Miami in the late 1980s numerous sprawling developments with large, wooden framed and wood and plaster sided homes packed close to one another on meandering streets with pools, clubhouses, and other amenities. Country Walk was one of them, a particularly massive development of wood-framed houses, which now lives in Andrew infamy. Construction in Country Walk by the company Arvida was particularly shoddy and houses fell like match-sticks in Andrew. The damage was just catastrophic. Residents told harrowing stories of windows and doors exploding, walls toppling over and popcorn ceilings, and whole second stories collapsing. Many people sheltered in interior bathrooms only to have the roofs collapse on them. Almost no homes were left with roofs after the storm. 95% of the 1700 homes in Country Walk were completely destroyed. The difference between Country Walk and neighboring developments with more solid construction was stark. Most residents of Country Walk collected their insurance money and moved away, often out of state.
Investigations of Country Walk found gables that were not braced or connected to roofs, plus poorly connected trusses, sheathing, strapping, and tie beams. Pre-construction plans on models were not checked by structural engineers and inspectors were found to have cut corners because of heavy workloads and many were just doing drive-bys instead of inspecting homes closely.
Video: Hurricane Andrew - Tamiami Airport/Country Walk (19:37) (Video is not narrated.)
This video shows the devastation of Country Walk.
Country Walk was not the only development with severe damage from Andrew. The storm basically exposed all poor construction. In light of this damage and with a view towards the stronger storms of the future, South Florida counties instituted very strict building codes. Code in the so-called “high-velocity hurricane zone” where “basic wind speed” (a measure of the recurrence of strong storms) is over 180 mph, including Miami-Dade and Broward counties, requires new construction to be a wind-resistant design, including windows, doors, and eaves. Hurricane shutters are mandatory in all parts of the state where the basic wind speed is over 120 mph. The performance and installation of shutters are very strict. However, regulations other than shutters vary from area to area and are constantly under attack from the construction industry, so who knows what the future will bring. One last aspect of living in a hurricane-prone area is crazy expensive insurance. Rates for insurance depends on the number of hurricane improvements a home has but can be up to $8,000 a year for a home valued at $150,000!

Video: Hurricane Andrew - Miami-Dade County, Florida - August 23-24, 1992 (8:18) (Video includes people talking, but is not narrated.)
This video summarized the power of Andrew.
Video: Then and Now: Scenes from Hurricane Andrew (11:39)
This video provides a more personal glimpse of the impact of the storm.
There is no doubt that South Florida is much better prepared than it was in 1992. And there is also no doubt it will need to be.
Hurricane Katrina: August 2005
Hurricane Katrina: August 2005

Hurricane Katrina’s historic impacts on New Orleans and Gulf Coast communities in Louisiana, Mississippi, and Alabama in 2005 serve as an important reminder of the destructive forces of hurricanes, most notably from storm surge. Katrina’s storm surge was so destructive that most gauges broke during the storm, making it difficult to get actual measurements. High-water marks in eastern Louisiana and western Mississippi indicate that the maximum surge was close to 9 meters (30 ft.).
In New Orleans, the failed levee systems allowed billions of gallons of seawater to flood 80% of the city, as well as some suburban areas. The mayor called for a mandatory evacuation approximately 24 hours before landfall. This was not enough time for many people to make necessary plans, and a large portion of the population of New Orleans was living in poverty and had no means of transportation, while others did not heed the evacuation order for a variety of other reasons. After the initial partial evacuation prior to the storm, the entire population eventually was evacuated from the city following the flooding. For many families, the evacuation dragged into a long-term or permanent situation because they had no home or jobs to come back to. Tragically, families were dispersed, or family members lost. Meanwhile, outside the levee system, there were areas that were completely destroyed, especially to the east of New Orleans and the Mississippi Gulf Coast communities from Bay St. Louis to Biloxi. Katrina will have lasting effects on these communities for decades to come. So, how is it that this storm became one of the most significant global storms in a century?
Scientists from NASA's Goddard Space Flight Center produced an excellent short video (3:03), "Katrina Retrospective: 5 Years Later," that explains many details of the storm’s development and path. Data from numerous weather satellites were compiled to produce these magnificent 3D animations that illustrate exactly what happened before, during, and after the storm. In the video, you will notice the role of warm surface waters in the Gulf of Mexico as they contributed to increased rates of atmospheric uplift, which resulted in strengthening the storm. You will also see how the bands of precipitation moved across the region and the distinct wind patterns that moved the storm over Florida, out into the Gulf and eventually steering it right toward the eastern tip of the boot of Louisiana, and southern Mississippi.
Video: Katrina Retrospective: 5 Years Later (3:04)
Required Reading
Please read from NOAA – A short summary of the meteorological impacts of Katrina: "Extremely Powerful Hurricane Katrina Leaves a Historic Mark on the Northern Gulf Coast - A Killer Hurricane Our Country Will Never Forget [3]".
The Times-Picayune newspaper produced an excellent interactive map-based time-series animation of the impact of Hurricane Katrina as it came ashore. Anatomy of a flood: How New Orleans flooded during Hurricane Katrina [9] tracks the flooding from levee and floodwall failures as they happened. Each scene includes pop-up dialogue boxes that will guide you through the storm. As you work through the scenes, play special attention to the areas that became flooded (shaded in blue) and the areas where levees were compromised and breached, either due to poor construction and failure or surge levels that overtopped them. Note that the water flowed into the portions of the city that lie below sea level and filled the shallow “bowl” with up to 15 feet of water. In the end, the only areas that sustained little, or no flood damage were located on the natural levees of the Mississippi River or the artificially-created higher ground near Lake Pontchartrain (location of the University of New Orleans).
The storm made its second landfall at Buras, Louisiana (it had already made landfall in Florida before entering the Gulf and strengthening). After crossing the Mississippi River bird’s-foot delta and entering the shallow bays including Lake Borgne in Louisiana and Mississippi Sound near the state line with Mississippi, it made its final landfall near the state line and delivered its historic storm surge to the coastal areas of both states. Water was pushed into the shallow bays, including Lake Pontchartrain and Bay St. Louis, with disastrous consequences. The storm left a trail of destruction, the magnitude of which is hard to imagine without seeing it for yourself.
New Orleans and the low-lying communities to the east that took the brunt of Katrina’s storm surge were essentially crippled for months. It took weeks to pump the water out of New Orleans, as all the pumps that usually drain the city were damaged by the flooding. Pumps were brought in from around the world to drain the city. All that remained of some communities were concrete slabs and pilings. The cities, including the entire city of New Orleans, were without basic services such as power, water, and sewage treatment. Without these utilities, the residents could not return to their homes. Many stories are still told of survival and heroic rescue efforts, as well as people managing to survive by camping out in their wrecked properties during the sweltering September heat following the storm.

Superstorm Sandy: October 2012
Superstorm Sandy: October 2012
Sandy, technically Superstorm Sandy because it merged with another low-pressure system before making landfall in the US, was the largest hurricane ever reported with a diameter of 1400 kilometers (1000 miles)! The storm is known for the damage it inflicted on the New York City region, costing a total of $65 billion. It was notable for two main reasons in addition to its size: first, because it was such a late storm, making landfall on October 29th, 2012, and second because it traveled so far north of typical hurricane country before hitting land.
While a hurricane, Sandy inflicted massive damage in Jamaica, Haiti, the Dominican Republic, and Cuba. In Haiti, the storm was especially destructive and responsible for at least 50 deaths. Sandy had a northerly path and after crossing Cuba and the Bahamas, the storm went out over open waters for several days before taking that dramatic left turn due to its interaction with the low pressure and slamming into the New Jersey coast near Atlantic City.
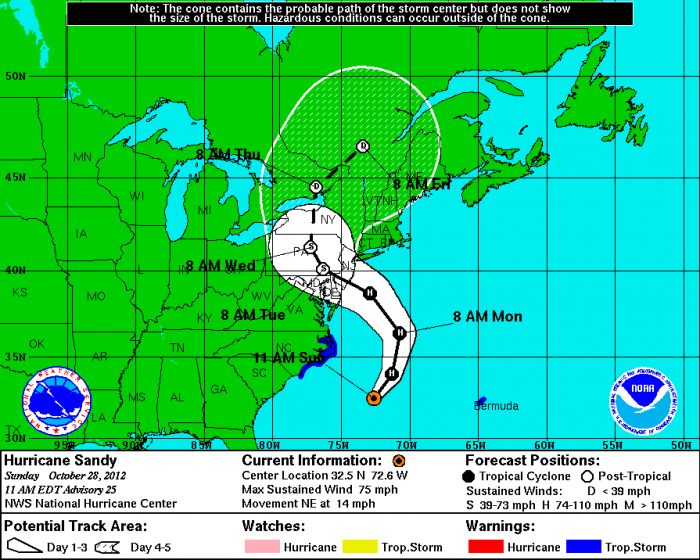

Coastal communities had plenty of time to prepare. New Jersey forced mass evacuations in low-lying areas, and New York City closed bridges and tunnels and covered subway openings. Sandy’s winds at landfall were 80 mph with gusts up to 90 mph, but most of the damage was done by the storm surge, which measured up to 3 meters (9 feet) in New Jersey and 4 meters (14 feet) in Lower Manhattan. Some areas received a foot of rain. The surge flooded city streets and the subway, including traffic tunnels under the river. Raw sewage was also released into city streets and tunnels. Most of New York City lost power for days. Flooding also occurred along the waterfront on the New Jersey side, with devastating flooding in Jersey City and Bayonne. The New Jersey shore bore the brunt of the damage, with whole towns ravaged by the storm. Close to 350,000 homes were damaged and 22,000 permanently destroyed. This destruction was largely flooding, with wind damage at the shore. Significant beach erosion occurred with on average 9 to 12 meters (30 to 40 feet) of shoreline removed by the storm and Sandy carved new temporary inlets along the shore. Up to a meter (4 feet) of sand was dumped on barrier island streets. Piers collapsed into the ocean. The damage was so extensive in some locations that residents were not allowed back for months. In all, 24 states were impacted by Sandy and there were 71 deaths in nine states. A total of six million people were without power right after the storm. At the time it was the second-costliest hurricane (after Katrina) but has now been surpassed by Harvey and Maria.
Hurricane Sandy
These videos show the damage after Sandy
Video: Hurricane Sandy: As It Happened (7:40)
Video: Most dramatic footage of Superstorm Sandy (3:15)
There are many lessons from Sandy. The New Jersey coast is one of the most developed shorelines in the world, with a booming real estate market. The shore has been developed since the 1940s, originally with small and simple family cottages. However, over the last 20 years or so, small homes were bought out in many areas, bulldozed, and large luxury mansions were built in their place. The shoreline contains billions of dollars of expensive homes, often built too close to the shorefront. As we discuss in Module 10, a lot of the blame for this overdevelopment rests with federal and state governments, who resisted passing sensible flood control laws numerous times. This failure resulted in development in areas that flood frequently. The lack of flood control was exacerbated by the National Flood Insurance Program that repeatedly bailed out homeowners, local governments, and the state. The program is supposed to include controls over where rebuilding can take place, but regulation has been loose. Today, NFIP covers 70-100 percent of rebuilding after hurricanes. Environmentalists and others have pushed for much stricter regulation and an end to bailing out homeowners who build in risky locations, but developers and the construction industry have won out (see more detail in Module 10). These failures resulted in homes rebuilt in harm’s way, in some cases multiple times. Environmentalists warned about the devastating impact of a Sandy event for many years, and the storm proved them right. However, once again, the government paid for everything after Sandy!
Extensive damage in New York City was also a wake-up call. Low-lying downtown Manhattan and the waterfront on the New Jersey side of the Hudson River contains some of the most coveted real estate in the world and is a global financial center. Sea-level rise over the coming decades will make the area even more vulnerable to storm surge, with potentially truly devastating financial implications. For this reason, Sandy inspired renewed discussions about a major investment in flood control that would protect Lower Manhattan and the New Jersey waterfront from storm surge in a future Sandy. There has been considerable planning into what this structure might look like with the most extreme cases involving 8 kilometers (5 miles) of concrete and steel surge “gates” extending from New Jersey all the way to Long Island across the harbor and another gate along the west of Long Island Sound. Each structure would involve miles of shore fortification at the ends of the gates. The system would cost in excess of $120 billion.

Read the latest on the proposed system here in this New York Times article: The $119 Billion Sea Wall That Could Defend New York … or Not [15]
The final lesson from Sandy is that climate change will cause powerful hurricanes to move further north and extend the season into October. It is still debatable whether Sandy was a result of climate change, though the Atlantic waters were warm unusually late in 2012. The New York metro area and the New Jersey shore have seen their share of powerful hurricanes, and Sandy may just have been a late-season anomaly. However, it is certainly reasonable with climate change to expect earlier and later storms and for stronger storms to make landfall further north. The large northeastern “megalopolis” extending from Washington DC to Boston and including Baltimore, Philadelphia, New York City is home to some 50 million people with $3.6 trillion in economic output per year. Sandy likely foreshadowed the future and this region better prepare for the eventuality of more large storms.
Typhoon Haiyan November 2013
Typhoon Haiyan November 2013
Before we start, remember a typhoon is the same as a hurricane but in the western Pacific Ocean while a hurricane is in the eastern Pacific and Atlantic. We choose to discuss Typhoon Haiyan (also called Yolanda) because it was the most devastating tropical storm of the last century in terms of damage and death toll. The storm was also one of the most powerful ever with sustained winds of 195 mph and gusts up to 235 mph when it came ashore on the eastern part of Samar Island in the central Philippines. The category 5 super typhoon had previously hit the island of Palau and would go on to impact Vietnam and China, but it was the Philippines where most of the damage occurred.
Haiyan came ashore on the eastern Samar island on 7 November 2013. Damage on the islands of Samar and Leyte was absolutely catastrophic, but other islands including Cebu and Bohol were hit very hard. On Samar and Leyte a storm surge of up to 5 meters (17 feet) and waves up to 6 meters (20 feet) were recorded and rainfall up to 0.3 meters (a foot) fell in a day. The damage was just terrible in the low-lying Tacloban City where flooding extended up to a kilometer inland and 90 percent of the city was destroyed. Many people in Tacloban drowned in rapidly rising floodwaters, cars were tossed around like match-sticks, and debris was thrown everywhere.
Typhoon Haiyan
In all, more than 7360 people died, 27,000 were injured and 6 million displaced. 1.1 million homes were swept away or destroyed. Tacloban city more than 4,000 people perished. Overall
Please check the following news reports for stunning before and after pictures of damage in Tacloban City.
In the aftermath getting aid to the millions in need was hampered by the severity of the damage. Water and food were extremely scarce. People had to dig up water pipes just to survive and getting food was even more difficult. The Philippines are used to natural disaster with frequent earthquakes and typhoons, but completely misjudged the strength of Haiyan in the leadup to the storm. Many citizens did not evacuate and remained in low lying areas. For those who did, evacuation centers situated in flood zones turned out to be death traps. Police and medics were also victims so the response was extremely slow and lawlessness ensued. Tacloban was described as a war zone after the storm. Looting was widespread. The city became so dangerous that aid workers were urged not to go. When aid arrived it was poorly distributed, often according to political affiliation. Reports surfaced that food delivered to particular areas was deliberately buried so people could not get access to it. Tens of millions of dollars in aid were sequestered in government bank accounts. Over time international aid flooded in and distribution improved. many places homes were rebuilt from materials damaged in the storm, including battered corrugated iron, old blankets, and tires. But the storm also caused massive resettlement of citizens of the impacted areas as well as relocation away from coastal areas.
Overall Haiyan will be remembered as the most devastating storm of the last century.
Video: Typhoon Haiyan Documentary (20:21)
This documentary portrays the devastation caused by Haiyan.
Hurricane Maria: September 2017
Hurricane Maria: September 2017
Hurricane Maria spread wreckage across the Caribbean as she sped toward the island of Puerto Rico. The damage was truly catastrophic in Dominica, where the storm basically flattened scores of homes and flooded others. The photograph below shows just how terrible the damage was there.
Hurricane Maria
Guadeloupe, Martinique, Haiti, and the Virgin Islands also suffered widespread damage. But Maria is almost all about Puerto Rico. The storm made landfall there near Yabucoa on the southeast coast at 10 AM on September 20, 2017. The island was still recovering from Hurricane Irma, which devastated the nearby Virgin Islands and passed to the north of Puerto Rico, but still caused widespread power outages. After Irma, Puerto Rico sent supplies to the Virgin Islands, including water and tarps.
At landfall, winds were clocked at 155 mph, a strong category 4 storm. After landfall winds weakened but the eyewall grew during replacement leading to a larger area of damaging winds. Rainfall caused significant damage, up to 1 meter (38 inches) of rain fell in mountainous areas and much of the eastern half of the island received over 0.4 meters (15 inches). The ground was already saturated as a result of rain from Irma and so this water had nowhere to go. In one notable incident, floodwaters released from the La Plata dam rose up to 4.5 meters (15 feet), caused extensive flooding, and trapped several thousand people. The Guayataca dam was deemed to be at risk of collapse and tens of thousands of people had to evacuate. Flash flooding, mudslides, and landslides were common in mountainous areas, cutting off whole communities. A month after the storm only 640 kilometers (400 miles) of 8000 kilometers (5000 miles) of roads were passable, making getting relief to citizens difficult. Maria destroyed a total of 70,000 homes and damaged up to 300,000 others.

Please take a look at the stunning before and after images from The Guardian, "Puerto Rico six months after Hurricane Maria: then and now" highlighting the impacts and recovery in Puerto Rico. Note that although repairs were completed, most houses pictured have only temporary fixes and blue tarps for roofs.

One of the lessons from Maria was the failure of the power grid. The Puerto Rico power grid was antiquated and extremely vulnerable to a storm like Maria. Lack of funding and years of mismanagement and failure to maintain equipment, combined with damage from previous storms left the grid extremely vulnerable. The national power company, the Puerto Rico Electrical Power Authority (PREPA) was over $7 billion in debt when it filed for bankruptcy months before Maria. Immediately after the storm, the power grid went down for the whole island, leaving 3.4 million people without electricity. Even hospital generators failed. Almost all cell and landline service was down. 90% of the island was still without power a month after the storm, and two months later 1.5 million people were without power. In some places, it took 11 months to restore power! After Maria, the federal government set aside $2 billion to fix the power system, but PREPA has been in bankruptcy negotiations for the last two years, and an earthquake in 2020 again led to widespread blackouts, so problems persist.

Video: Puerto Rico after Hurricane Maria: 'We're American, too, why don't they help?' (9:49)
This video exposes the severity of the poor response to Maria in Puerto Rico

Drinking water was also hit hard by Maria. Up to 50% of citizens had no running water for several weeks. Sewage treatment plants were inoperable for months. Maria wiped out 80 percent of the crop value in Puerto Rico, about $780 million, destroying sugar cane and fruit trees, coffee plants, and vegetables. The storm was particularly hard on trees, ripping off leaves, and stripping bark. One farmer described losing every single one of his 14,000 plantain trees. Row upon row of crops were destroyed. The island imports about 85% of its food, leaving it very vulnerable to a devastating storm like Maria, however before the storm small farming operations were increasing as were local farmers' markets. The loss of croplands combined with the slow response left citizens without food, hungry, and rationing canned goods. After Maria hit, a Federal Emergency was declared and FEMA assistance began with daily relief flights. The Navy deployed numerous ships to help in the relief. However, the scale of the disaster was daunting, hampered by poor communication and difficulty getting assistance to people who needed it, and the government has been criticized for underestimating the severity of the crisis. All in all the storm caused $90 billion in damage.
Estimating the death toll from Maria has been difficult. Officially, 64 people died as a direct result of the storm. However, power cuts, lack of drinking water, food shortages, and the extremely slow governmental response were responsible for far more deaths, especially of people with underlying health problems. But since some of these deaths might have occurred without the storm, the only way to estimate the number is by comparison with mortality rates in previous years. Numerous universities and investigative reporters have made these comparisons and the estimates are staggering. Up to 3,000 people are thought to have perished in the aftermath of Hurricane Maria, exceeding fatalities in Katrina. Many citizens moved to the mainland US, especially to Florida. Because Puerto Rico is a US Territory and citizens pay some federal taxes including Medicare and social security, the federal government has been blamed for the slow response, and for not providing more immediate relief and long-term financial aid to the island. The response was so inadequate and suffering so significant that the international relief organization Oxfam intervened and provided aid to the island. Although the storms, the location, and the nature of the damage were very different and comparisons are difficult, the response (or lack of) to Maria resembled Katrina to many. And because the majority of people impacted by both of these tragedies were minorities, African Americans in the case of Katrina and Hispanics in the case of Maria, there have been charges of environmental racism in both cases. Certainly, the responses to Harvey and Sandy were far superior. Even now, three years after the storm, blue tarps still dot rooftops all over the island, memories of Maria.
Hurricane Harvey: August 2017
Hurricane Harvey: August 2017
Hurricane Harvey came ashore on August 25th near Rockport, TX, with 120 mph winds devastating the small coastal town and flooding the coastal areas with a storm surge, then made another landfall at Holiday Beach as a category 3. By that time, the storm was rapidly weakening to become a tropical depression, and it also was moving very slowly towards the sprawling metropolis of Houston. The storm basically stalled over the city for a few days, and it was rain, not wind, that would become deadly. Harvey has two primary lessons for us: (1) that the warmer atmosphere of today and the future, combined with the predicted slower movement of some storms, can be devastating “rain engines” that dump biblical amounts of precipitation on coastal communities and cause life-threatening flooding; and (2) that particular cities have a great deal more vulnerability than others because of low elevation combined with poor planning. On this note, Houston is a sprawling metropolis of 6 million people that has set itself up for catastrophe.


Tropical Storm Harvey was the wettest storm ever to hit the US. The Gulf of Mexico is an incredibly warm water mass, with a temperature of 30 deg C (86 deg F) during Harvey. As we learned in the last module, warm water holds more moisture than cold water and ocean warmth also fuels the energy for the storm. For every 1°C increase in temperature, the atmosphere can hold around 7 percent more water vapor. This may not sound like a lot, but think about this, hurricanes can form when waters exceed 26 deg C (79 deg F) in temperature, so the Gulf of Mexico atmosphere could hold almost 30 percent more moisture than other storms. And because under many conditions the warm atmosphere makes storms move slower, means that devastating rain engines like Harvey will become increasingly common in the future.
Let’s talk about the rain. The rainfall in Harvey has often been called a rain “bomb”, but the term rain bomb is generally reserved for locally intense rainfall over periods of minutes or hours at most. So for Harvey, what we saw was a nuclear rain bomb! It poured for days! Over the five-day period from August 25 to August 29, many parts of Houston received over 30 inches of rain (0.76 meters) with a maximum of 60.58 inches in Nederland, Texas. In total, the Houston region received over 24 trillion gallons of rain. That is enough water to fill every NFL and Division 1 football stadium 100 times over!


The other ingredient for the disaster in Houston was the lack of planning and smart land use. Houston has experienced growth more rapidly than almost any US city, and it has spread outwards rather than upwards. The city now covers an area as large as Chicago, Cleveland, Detroit, and Philadelphia combined! In fact, a large part of the city is built on an ancient floodplain, the Katy Prairie, which extends 30 miles west of downtown. This prairie acts like a natural sponge for water, but is largely paved over during the rapid growth of the Houston metro area. Even outside of the prairie, urbanization clearly intensified runoff and flash flooding. In fact, planning is not a strong point of development in Houston. The city has no zoning and little regulation of any sort. It’s a pro-business, small-government boom town! You drive around town, and you might see pawn shops next to schools and factories next to churches. So the floodplain is full of housing developments and apartment complexes. To make matters worse, development was permitted inside two large reservoirs, the Barker and Addicks Reservoirs which ironically were originally purchased by the Army Corps of Engineers to protect the downtown from flooding, and many of the families living in the reservoir only found out about it AFTER Harvey. Water levels in the reservoirs were controlled by dams and flood gates, but the Corps had a delicate balancing act. They had to release water slowly down the Buffalo Spillway on the east side to prevent the dam from overtopping, which would have caused a catastrophe, but they could not release so much because that would have flooded downtown. But as it turned out, properties in the reservoir flooded; a gated development called Canyon Gate at Cinco Ranch within the Barker Reservoir with over 700 homes suffered extensive flooding. Those living within the reservoirs may have been more fortunate than those living around it. The Corps released water down the Buffalo Spillway into Buffalo Bayou without warning homeowners and flooded homes in West Houston. There was extensive damage and several fatalities. Needless to say, the Corps has endured severe criticism and lawsuits.


This sequence shows how the flooding occurred around the Barker and Addicks Reservoirs: New York Times: How One Houston Suburb Ended Up in A Reservoir [35]
Long term, there is a discussion about building structures called a berm around what is left of wetlands in the Katy Prairie to provide flood control to development in the western part of Houston. But even then the location of the city and its elevation combined with the sheer amount of concrete and lack of flood control means that storms like Harvey are almost certain to happen again, and it will take a lot more than that to avoid catastrophe in the future. Whole neighborhoods will need to be resettled, and new construction banned in certain locations. But those types of regulations will be a tough political sell in a pro-business town. In 2008, Hurricane Ike prompted a debate that was reinvigorated after Harvey about the need for better coastal protection to prevent storm surges from flooding Houston via the Houston Ship Channel and Galveston Bay, from the Gulf. And the next massive rain soaker of a storm might be on the horizon.
Hurricane Dorian: September 2019
Hurricane Dorian: September 2019
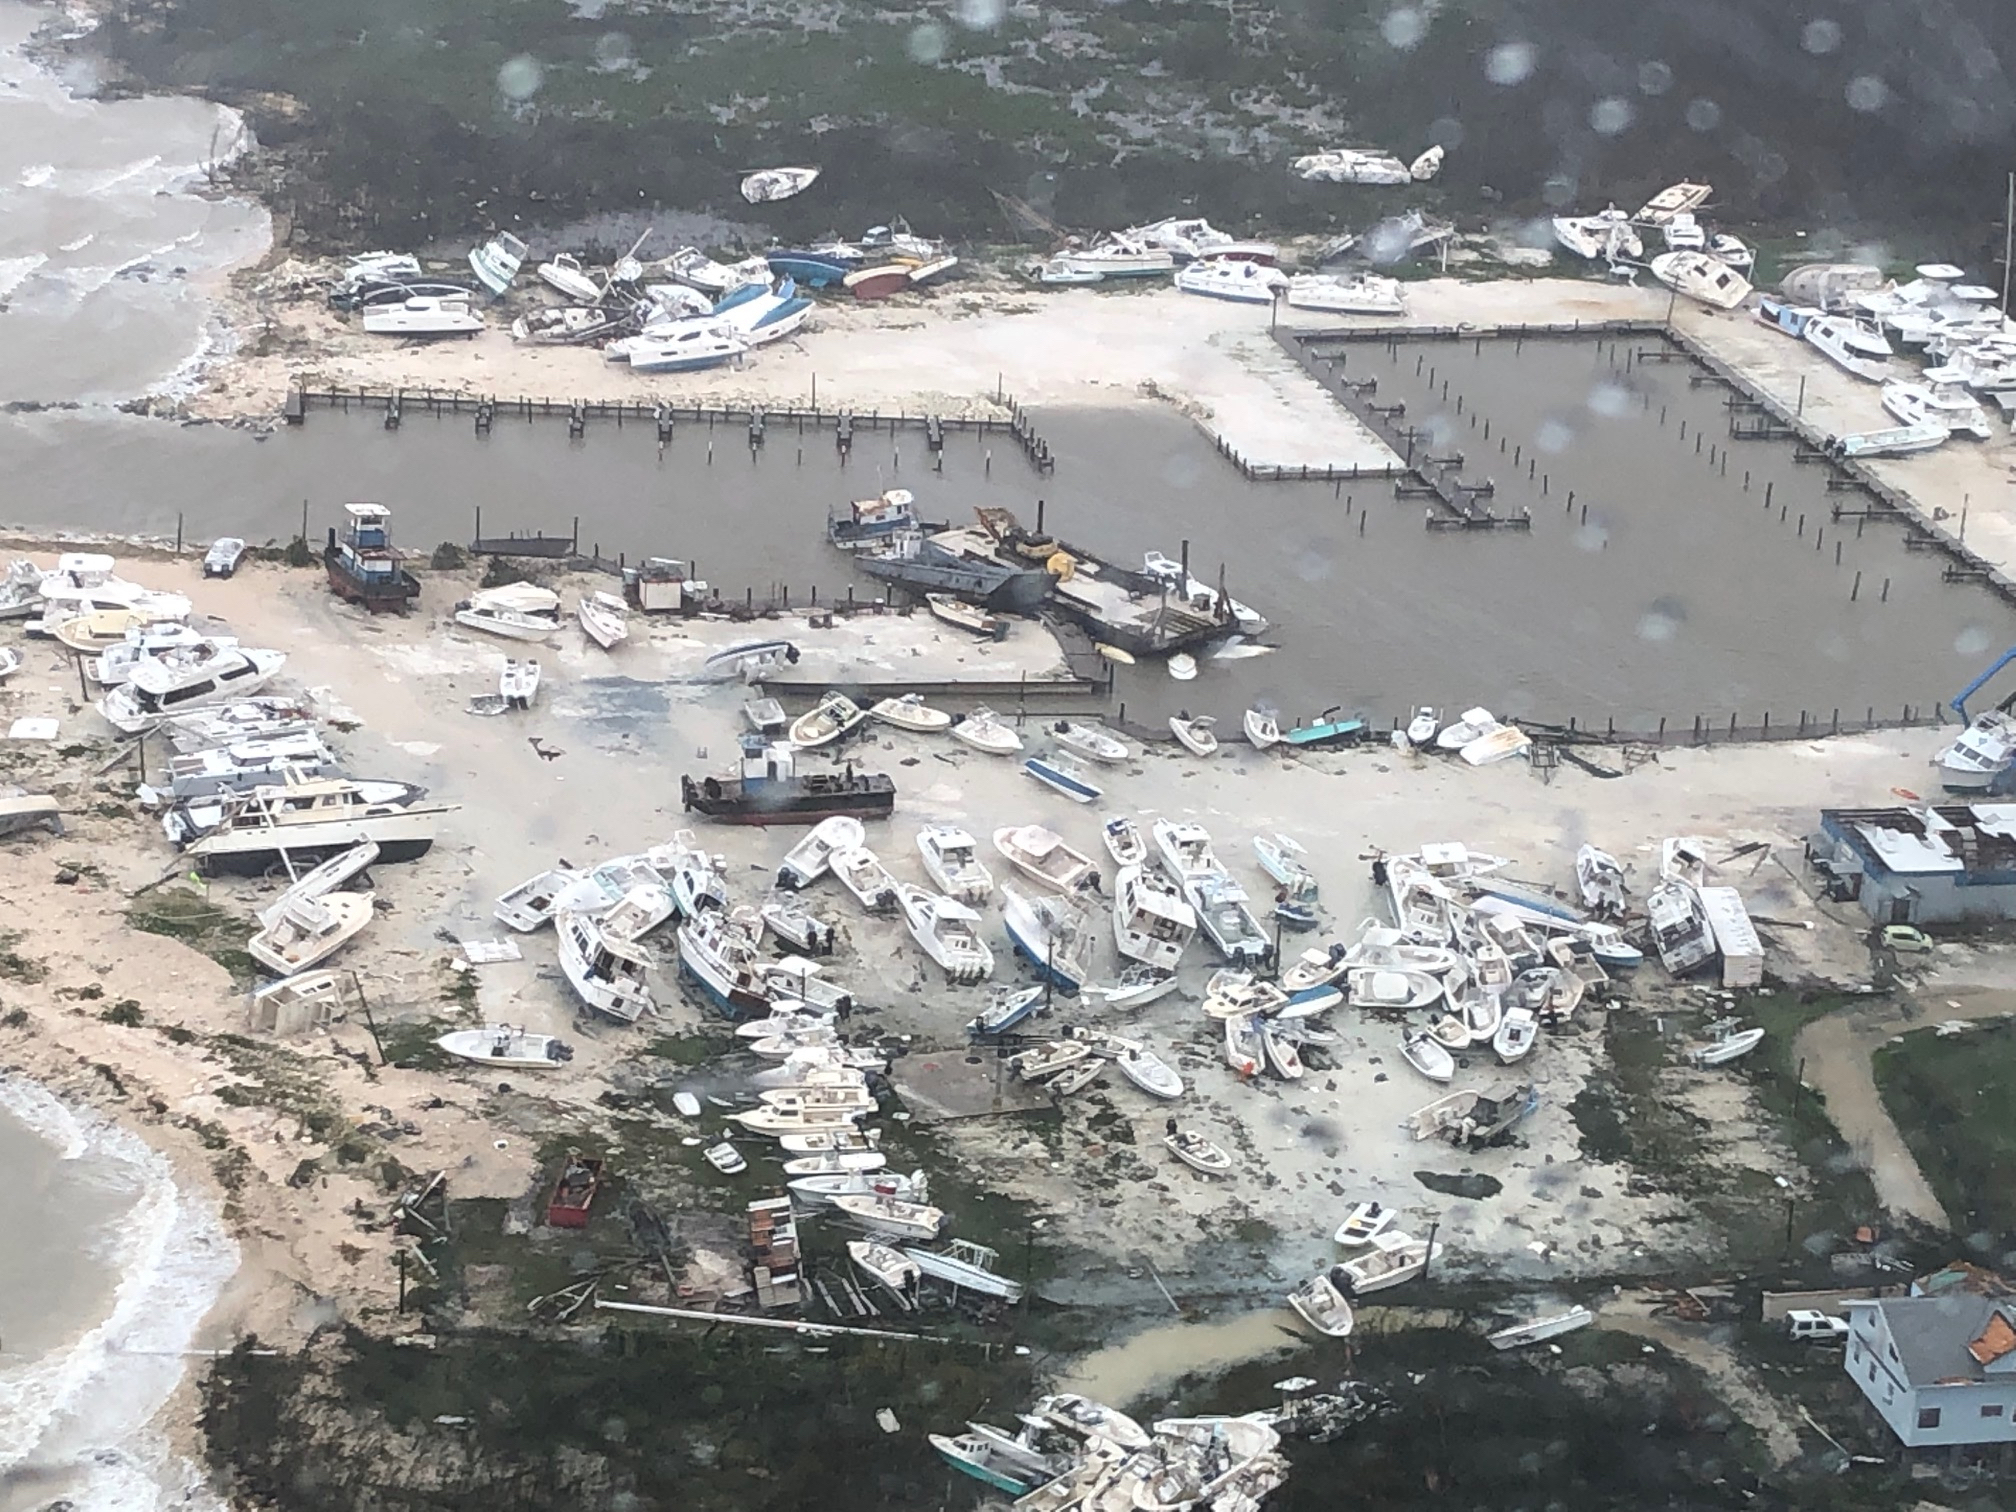
The Bahamas are used to hurricanes. There is no official “hurricane alley” (like tornado alley) but if there were, the Bahamas would be smack in the middle of it. The island nation is generally under a hurricane watch and warning several times a year and has been ravaged by storms in the past. But nothing like Dorian. The storm moved through the Caribbean and took aim on the islands before rapidly strengthening as it approached. Dorian made landfall on September 1, 2019, on Grand Abaco Island with sustained winds of 185 mph and gusts over 220 mph, let me repeat that sustained winds of 185 mph and gusts over 220 mph (!), making it one of the strongest storms on record in the Atlantic and Pacific.


Dorian was an unusual storm in several ways. Remember in the last module we learned that hurricane strength is generally measured by the minimum atmospheric pressure, and Dorian’s pressure was not that low. But, the storm was enormous. Dorian was particularly deadly because the devastating winds were combined with an extremely slow forward motion of about 5 mph so that the storm ravaged the Bahamas for days. Devastating storms like Andrew and Katrina had much faster motion, but the slow speed of Dorian made the damage much, much worse. It’s hard to imagine what it would have been like for all the citizens of the Bahamas to have experienced the impacts of the storm for that long. After pummeling the Abacos, a group of islands in the northeast Bahamas, the storm went back over open water and made landfall without weakening on September 2 on Grand Bahama, the largest Bahama island, where it literally stalled for a day before weakening a little and moving back over open water. The damage to the Bahamas was truly catastrophic, as the pictures show.
The Bahamas had plenty of time to prepare for Dorian. Evacuation orders for low-lying areas were given the day before the storm and residents were urged to seek shelter on higher ground, boats picked people up from small, low-lying islands, and resorts were closed, but even so, many people ignored the warnings. At landfall on the Abacos and again on Grand Bahama, Dorian’s intense winds were accompanied by a massive storm surge of about 6-9 meters (20-25 feet) and heavy rain. In total, about a meter (3 feet) of rain fell over most of the northern Bahamas. Again, imagine experiencing these winds, rains, and storm surge for almost a whole day like folks in the Abacos and Grand Bahama did! It must have been truly terrifying on both sets of islands. There are harrowing tales of people clinging on to trees and other harrowing survival stories, but sadly many were not so fortunate. The official death toll from Dorian is 70, but is almost certainly much, much higher because there were many undocumented citizens living in shantytowns. Initially, there were over 1000 people missing, and now that number is around 300, so the death toll is likely to be 500-600. The true number may never be known.
Watch these short videos that show incredible footage of the peak of the storm and its aftermath!
Video: Hurricane Dorian batters Bahamas with severe flash floods and ferocious wind (1:48)
Video: The town forgotten in the aftermath of Hurricane Dorian (4:33)
On the Abacos, 60 percent of homes were destroyed, in total thousands of homes, including most of the poor shanty town dwellings. The power grid was completely destroyed and the airport flooded. 60% of Grand Bahama island was left underwater, hundreds of homes destroyed and a hospital was badly contaminated by sewage. Dorian will certainly be remembered as one of the most devastating Atlantic storms.
Hurricane Dorian
Moving forward, the lesson from Dorian, like Harvey, is definitely that our warming climate often results in storms that move super slowly. We need to prepare for a Dorian-like storm to hit Miami or New Orleans or under the right circumstances, even Washington DC. Building codes and infrastructure need to be adapted for this eventuality. It’s just a matter of time.
Hurricane Ian: September-October 2022
Hurricane Ian: Sept-Oct 2022
Now to Hurricane Ian that hit southwest Florida in September 2022. The storm was notable because of how rapidly it intensified, with wind speeds increasing from 75 mph to 155 mph in just two days. The very large storm came ashore at Cayo Costa island just to the north of Fort Myers on September 28th, 2022. Sustained wind speeds at landfall were 150 mph, likely with higher gusts. It was the fifth-strongest storm ever to hit the 50 contiguous states.
But the damage in southwest Florida was not just inflicted by the wind. Since the path of the storm closely paralleled the coast as it approached land, and because the highest surge is in the right front quadrant of the storm due to its counter-clockwise circulation, the storm surge over large areas was devastating.
The storm surge was between up to 15 feet above normal sea level along the barrier islands of Captiva, Sanibel, and Fort Myers Beach. This wall of water caused massive devastation in these areas, as observed in the photographs below.


Ian moved slowly in the northeast direction across the Florida peninsula, and this slow path caused heavy rainfall over a wide area (see photo above), with precipitation totals of up to 17 inches over a 12-24 hour period. This rainfall caused widespread flooding well inland in places such as Orlando.
One of the main stories of the storm was a prediction. The different forecast models agreed closely as the storm approached southwest Florida, but because the path was so close to parallel to the coast, a small change led to a major difference in the landfall location. Two days out the path was more northerly with the eye forecasted to make landfall near Tampa, but then a day out a minor jog in the forecast to the east shifted the forecasted landfall of the eye well south. This change led to some delays in evacuation in the Fort Myers area.
The storm caused massive damage over a widespread area with catastrophic damage to housing along the coast, especially in Fort Myers, Sanibel Captiva, and Port Charlotte. More than 2.7 million people lost power at the height of the storm, and a large number were without clean water. Overall, the storm led to 136 fatalities in Florida and a total of $50 billion in damage.
Hurricane Helene: September 2024
Hurricane Helene: September 2024
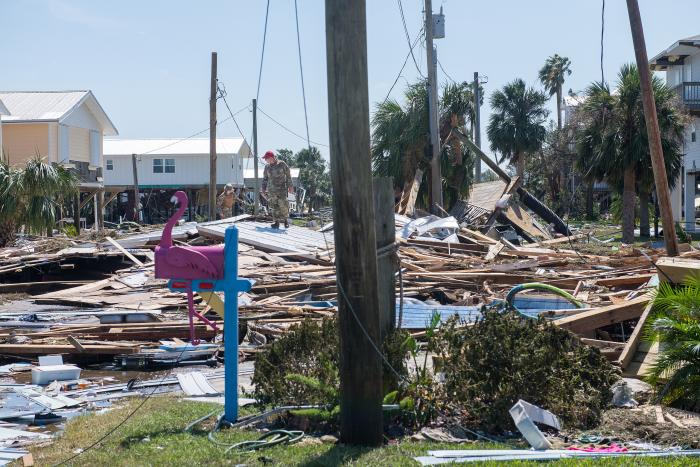
Hurricane Helene arose as a depression in the Caribbean. The storm rapidly intensified over the unusually warm Gulf of Mexico as it moved towards the Big Bend region of Florida where it made landfall on the evening of September 26, 2024, as a category 4 hurricane with sustained winds of 140 mph. The hurricane was also very large and had a high storm surge along a long area of the western Florida coastline from about 10 feet in the Big Bend to about 7 feet in the Tampa Bay region, causing extensive flooding along the whole coast.
Since the storm was moving so rapidly it maintained its strength inland and it was still a hurricane when it hit southern Georgia. Wind damage was severe well inland in both states.
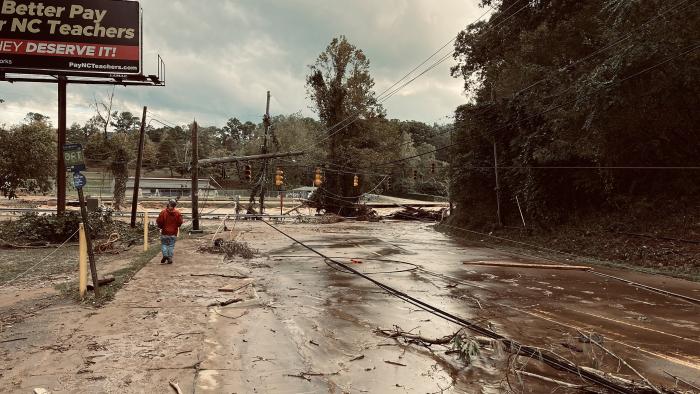
Helene was still a tropical storm when it moved across northern Georgia near Atlanta, South Carolina near Greenville, and North Carolina near Asheville. In these regions, some damage was caused by wind, but most of it was done by water. A stalled frontal boundary had dumped up to 9 inches of rain over the mountains of western North Carolina before the storm arrived. The ground was therefore already saturated when the storm arrived, and this led to extensive tree damage from tropical-storm-force winds. Rainfall totals of up to 32 inches in the mountainous terrain caused many landslides and mudslides. The water rushed down the hillslopes causing rivers to rise rapidly, and overflow their banks leading to extensive flash flooding. River levels were at record levels, for example, the French Broad and Swannanoa rivers in Asheville were up to 5 feet above historic levels, breaking a record set in 1916. The results were absolutely catastrophic in Asheville and small mountain towns all over western South Carolina, North Carolina, and Tennessee. Extensive flash flooding swept away single-family homes and mobile homes, and flooded businesses.
Video: Examining Hurricane Helene's shocking impact in North Carolina (7:51)
The most dire result of Helene was loss of life. The storm was the most deadly since Hurricane Katrina with over 280 dead as of this writing. Over 100 of these deaths occurred in western North Carolina, where many more are still missing at the time of writing. The storm was also the costliest since Katrina with estimates of over $50 billion with billions of dollars of uninsured flood damages.
Video: Surviving after Helene: 'Just living is a challenge' (4:27)
The storm left 4 million people without power, but more damaging was the flood damage, along the Florida coast from the storm surge and in the mountainous regions of the Carolinas and Tennessee from flash flooding. Here the water washed out roads causing severe disruptions to transportation and severed water lines including in larger towns like Asheville. Communication was made even more difficult by the loss of cell phone service as towers were knocked down by wind.
As of this writing, recovery over the wide area impacted by Helene was underway with major roles from FEMA and state agencies.
Asheville, NC: One month after Hurricane Helene
ETS Titan: February 2014
ETS Titan: February 2014
In the remainder of this module, we discuss historic extratropical systems. In early 2014 several winters (extratropical) storms developed off the western coast of the U.S. In the case of the storm featured in the video below, the extratropical cyclone had already developed and then merged with a cold front or “atmospheric river” in February 2014. Another event developed a strong rotation later in February and early March. This storm was named Titan. Collectively, these atmospheric river-producing events helped to form large coastal swells and brought much-needed rain to California. The state had been suffering from significant drought conditions for more than 3 years.
Video: Animation of extratropical cyclone merging with atmospheric river off California." (1:06) (Video is not narrated.)
Video: 2/28/14-3/1/14 West Coast Extratropical Cyclone Water Vapor Satellite Loop. (00:58) (Video is not narrated.)
The National Weather Service reported that more rain fell in a few hours than had fallen in eight months as a result of just one of these storms. Due to the relatively steep terrain of the region, and because of the extensive drought, as much needed as the rain was, numerous landslides resulted, and coastal erosion at the base of several sections of the coastal highway was undermined or buried. In some areas, roads were closed and people were evacuated. So, although the storms were not as large in scale as most tropical storms, they definitely impacted coastal regions in many of the same ways.
Below, a home video, taken in 2008 at Marina State Beach, just north of Monterey, California, and south of Salinas River National Wildlife Refuge, shows massive waves some 30’ high. The video illustrates the power of waves as they interact with the shoreline.
Video: Giant Pacific Wave Storm, January 5th, 2008 (1:53) (Video includes people talking, but is not narrated.)
Although the winds don’t appear to be too intense, significant wave run-up is shown, and you can easily see how the swells produce extensive coastal scour and erosion along the shoreline. In the months following, portions of California experienced additional storm activity. Large waves, some in excess of 15 feet, pounded the shoreline up and down the coast. High winds, some gusts as high as 55 mph, were measured, and significant accumulations of snow were dumped at higher elevations, High Surf, Wild Winds Pound Southern California [55] (CBS Los Angeles).
The Historic “Bomb Cyclone” of January 2018
The Historic “Bomb Cyclone” of January 2018
In January 2018 a particularly intense nor’easter impacted the northeastern United States, bringing a freezing storm surge ashore in cities such as Boston. Although this was a rare set of circumstances, storms like this are not uncommon.
The storm originated on January 3rd as an area of low pressure off the coast of the southeastern U.S., which traveled rapidly up the eastern seaboard. The storm explosively deepened during this period, earning the storm its memorable moniker of “Bomb Cyclone.” The storm was also given other unofficial names, such as Winter Storm Grayson, Blizzard of 2018, and Storm Brody.
The term bomb cyclone comes from meteorological terms describing an extreme drop in the central pressure of the storm. Terms including explosive cyclogenesis, weather bomb, meteorological bomb, bomb cyclone, and bombogenesis were used to describe the rapid deepening of the low-pressure area of the extratropical cyclone.
By the morning of January 4, the powerful storm system had deepened by 53 mbar of pressure in 21 hours—one of the fastest rates ever observed in the Western Atlantic (Wikipedia). This drop in pressure was over twice the threshold (24 mbar in 24 hours) for bombogenesis.
In Massachusetts, winds gusted to hurricane-force at 76 miles per hour (122 km/h) on Nantucket Island. At least 17.0 inches (430 mm) of snow fell on Boston. In Boston, a freezing storm tide of 15.16 ft (4.62 m) was recorded during the blizzard which flooded areas of the financial district, including a subway station, setting a new historical record. Significant coastal flooding occurred in Maine and New Hampshire.

_170923-H-NI589-0007_(36602415074).jpg)
_(50).jpg)
For more information
- Washington Post Video: Storm surge floods coastal towns in Massachusetts [57]
- Business Insider: Bomb Cyclone Imagery [58]
Shoreline Effects of Storms
Shoreline Effects of Storms
In “Beaches are Moving: The Drowning of America’s Shoreline”, coastal geologist and author Orrin Pilkey discusses the four components of shoreline equilibrium – material, energy, shape, and sea level, and how they interact in the event of a storm. He states: “During a storm the strong wind and waves pick up much more sediment than usual, carrying it inland into the dunes or seaward into the waves”…. “Covered by the storm surge, the beach temporarily loses its usual position in the marine environment and becomes an underwater or offshore bar... …the boiling surf keeps the sand particles in suspension, and because the energy of the big waves reaches deeper water, the sand cannot settle until it is either far offshore… or until it is washed up on land to reshape the beach”.
The result, after a storm has passed, is a very different shoreline than before. The energy of water is awesome in its ability to move sediment from one place and deposit in another. This is often in conflict with the human desire to stabilize and prevent shorelines from moving. But storms and the shoreline naturally interact in a dynamic way. Humans place structures on shorelines, and they get destroyed and rebuilt. But this cannot go on indefinitely.
A point that Dr. Pilkey repeatedly makes is that storms and shorelines are the natural state in a “constant, dynamic balancing of materials, energies and shapes”. When people attempt to change this dynamic equilibrium is when a catastrophe happens. This is something to keep in mind as we consider the impacts of the storms we have discussed in this module and as we move forward to explore ways communities deal with these impacts.
Dr. Sean Cornell of Shippensburg University, who does fieldwork on Wallops Island, captured the following images documenting the impacts to the barrier island after Hurricane Irene in 2011. Read through his description and examine the photographs to learn about the local impacts of a hurricane on a barrier island beach. He contrasts Hurricane Irene with Hurricane Sandy, pointing to the difference in angle of approach.
Irene developed as a tropical storm some 300 km off the eastern end of the Lesser Antilles and outside of the Caribbean Sea. It first became a hurricane on August 22, 2011 as it made landfall on Puerto Rico. Despite making landfall, the storm continued to strengthen and eventually became a Category 3 hurricane as it passed through the Bahamas on August 24. The storm then tracked northward and impacted the Outer Banks of North Carolina as a Category 1 storm before emerging once again out into the Atlantic Ocean off the coast of Virginia just south of Virginia Beach on August 28.
As the storm moved northeastward, it ran parallel to the shoreline of the Delmarva Peninsula, where it produced strong winds and waves and high water for the barrier islands and coastal bays located behind the barrier islands including Wallops Island, home of NASA’s Wallops Island Flight Facility, as well as Chincoteague and Assateague Islands. These barrier islands are nearly continuous along a distance of almost 150 miles of shoreline between the Chesapeake and Delaware Bays. They are interrupted only occasionally by relatively narrow inlets. Nearly 80 miles of this shoreline is relatively undisturbed and undeveloped and is generally allowed to behave naturally and without significant modification by human activity (although see the impact of constructed shorelines at Ocean City, Maryland and recent coastal engineering projects on Wallops Island to help protect the launch facility and infrastructure). Centered in this region is one of the largest bays on the Delmarva. Chincoteague Bay straddles the Virginia-Maryland border and today has two inlets to the ocean, one between Wallops Island and Assateague Island (i.e., the Chincoteague Inlet), on the south and one between Assateague and Fenwick Island on the north (i.e., the Ocean City Inlet; see figure below).

For the Eastern Shore of Virginia, and although it was relatively fast-moving, Hurricane Irene was a significant event as the center of the storm passed only about 30 miles offshore. During the onset of the storm, onshore winds and waves piled significant volumes of water along the barrier islands producing storm overwash, eroding shorelines (see images below), and relatively robust storm surge in back bay areas along the mainland (see images below), although nothing is comparable to the levels observed during Katrina on the Gulf Coast, or during Hurricane Sandy in New York. This was, in part, because of the trajectory of the storm, the speed of the storm, the fact that it moved along the continental shelf, and also because the number of inlets was relatively few and narrow. These factors, combined with the robust nature of the barrier island maritime forests and dune systems, helped reduce the total volume of water that could enter the coastal bays. As the storm moved north of the region, offshore winds on the trailing edge of the storm helped to push surge waters back out of the bays and helped produce extensive scouring in the vicinity of the unprotected inlet. This helped form a large ebb-tidal delta that helped fill in much of the navigational channel between Assateague and Wallops. Thus, for this region, Hurricane Irene’s impact was significant but could have been much worse if the storm’s trajectory was different.


Hurricane Sandy
In contrast, and although Hurricane Sandy was similarly scaled in wind speed and size to Irene, ultimately it was much more impactful further north to New York and New Jersey primarily because of the storm track it took and the orientation of the shoreline where the storm made landfall. The figure below shows the storm track for Sandy in the fall of 2012. Whereas Irene’s track was parallel to the shore, Sandy’s approach was more perpendicular with landfall approach toward the northwest. In this way, not only was the brunt of the storm’s energy focused on the shoreline, but the geomorphic configuration of the shoreline and the shallow nature of the inner shelf led to amplification of the storm surge as outlined in the previous module.

Module 6 Lab
Module 6 Lab
A few of our Labs in this course are considered "mini" Labs, meaning the work will not be as involved, and they will not be worth quite as much. However, the work remains just as important.
In this Lab, you will:
- Use Google Maps [60] to examine the impacts of two major storms in two locations.
- Observe and analyze, using street view and historic imagery in Google Maps, the changes to the landscape and communities caused by the hurricanes' surges and winds.
- Compare redevelopment in the two communities and consider the possible factors influencing redevelopment.
Lab Overview
For this short Lab, we tour two locations in the U.S. to view the impacts of two storms: Hurricane Katrina (Aug 29, 2005) in Pass Christian, MS; and Hurricane Sandy (Oct 31, 2012) in Mantoloking, NJ. Both of these storms were unique, and each community had unique characteristics based on the geomorphology of the coastline and the details of the structures built there. While you make your observations, keep these variables in mind. You will assess the damage to the human structures (mostly individual homes) and then use historic imagery and street views to estimate the level of rebuilding that has taken place in the years following the storms. Consider the factors that may influence homeowners' decisions about rebuilding, including the time elapsed and economic factors. Think about how exposed both of the locations are to coastal hazards and the probability of a future coastal disaster impacting this coastline. Your ability to judge details will be limited by the tools you are using, so you will need to estimate and use the online resources provided to help you fill in gaps of knowledge.
Downloads/Resources
- Module 6 Lab Worksheet [61]
- Pass Christian, MS [62] (Read the section on Hurricane Katrina)
- Mantoloking, NJ [63] (Read the section on Hurricane Sandy)
Instructions
Before you begin the Lab, you will need to download the Module 6 Lab Worksheet [61]. The worksheet contains the steps you need to take to complete the Lab in Google Maps. In addition, it contains prompts for questions that you should take note of (by writing down or typing in) as you work through the Lab. Once you have worked through all of the steps, and answered all of the questions, you will go to the Module 6 Lab Quiz and answer the multiple-choice questions. The questions and answer choices on the lab worksheet will match those in the multiple-choice quiz. Submit the quiz for credit.
Summary and Final Tasks
Summary and Final Tasks
Summary
Coastal storms ultimately present a great risk to human and natural landscapes. It is probably true that no one will ever die from sea level rise, but millions of people around the world live, work, and play in areas that are prone to the deadly impact of storms. Although modern meteorological equipment has been developed to the point where we now have good success at predicting major storms, evacuation out of harms way is extremely difficult, as we will see in Module 11. And as we will see in Module 7, tsunami are a much greater as the speed at which tsunami waves propagate as well as the complex ways that waves reflect, refract, and interfere with one another as they move around land masses and across oceanic shelves.
As these phenomena are so incredibly damaging to human societies around the world each year, it is critical that scientists help promote public awareness and facilitate the development of plans to respond, react, and minimize human losses in the event of the inevitable. In Modules 8-13, we will explore, in more detail, the ideas of coastal zone resource management, managing risk, and planning for a more productive, safe, and less impactful future. Given that global warming processes produce more severe storms each year, coupled with the fact that sea level is rising at a more noticeable rate than ever before, many hard decisions have to be made in the future if we are to continue to enjoy the quality of life that comes from living on or near the coastline.
Reminder - Complete all of the Module 6 tasks!
You have reached the end of Module 6! Double-check the Module 6 Roadmap to make sure you have completed all of the activities listed there before you begin Module 7.
References and Further Reading
The following links are meant to provide suggestions for further investigation into some of the topics covered in Module 6.