Module 12: Emergency Management Cycle for Coastal Hazards
Module 12: Emergency Management Cycle for Coastal Hazards
Introduction
We have demonstrated in previous modules just how destructive coastal hazards like storm surges and tsunamis can be. In Module 11 we focused on the vulnerability of coastal communities around the world to tsunamis and storm surges. In Module 12 we will explore the four stages of the emergency management cycle – mitigation, preparedness, response, and recovery – and examine policies related to tsunami and storm surge impacts.
Ever-greater numbers of people are migrating to coastal areas, thereby increasing exposure to these hazards. Consider these statistics – from Gaul, 2019.
- Population: In 1940 the population of the Atlantic and Gulf coasts of the U.S. was 16 million. In 2017, it was 70 million. That is more than a four-fold increase (Gaul, 2019).
- The costs of hurricane damage have escalated over recent decades as population density has increased along the coastlines of the U.S. In the past 20 years, coastal storms have cost $750 billion in damages. This is a six-fold increase from the prior two decades (Gaul, 2019).
- Seventeen of the most expensive hurricanes occurred since 2000.
- A warming ocean is fueling more intense storms, which in turn is leading to greater costs in terms of damage and human suffering.
These trends are likely to continue into the future. So the problems we have witnessed in our favorite coastal cities along the U.S. coastline in the past couple of decades are likely to increase in magnitude as the oceans warm and rise and the population of coastal cities continues to grow.
Meanwhile, over half of the United States' economic productivity is centered in the coastal zones, and almost all of these areas are vulnerable to storm surge or tsunami. Airports, too, are vulnerable: the U.S. National Climate Assessment reports that 12 of the 47 largest airports in the United States are vulnerable to storm surge hazards. During Superstorm Sandy, all three major New York area airports – LaGuardia, JFK, and Newark, NJ – experienced storm surges of up to 14 feet. The Pentagon is also well aware of the threat of sea level rise. The Naval Station in Norfolk, Virginia floods over ten times a year, a trend that will certainly get worse.
Sound coastal emergency management policies can reduce the vulnerability of residents to coastal hazards. In the case of tsunami policy, the United States is a world leader, with the nation’s public policy initiatives significantly reducing tsunami vulnerability in the United States and across the world. Coastal communities around the U.S. have recently experienced frequent and devastating flooding from storm surge. Policy addressing vulnerability to this type of coastal hazard may not be keeping pace with the climate factors behind these events. We will consider this dilemma in Module 12, among other policy questions.
After exploring the stages of the emergency management cycle, we will visit several case studies to better understand how the emergency management cycle works in real examples and to determine how policies may be improved as the threat of coastal hazards and disasters increase.


Goals and Objectives
Goals and Objectives
Goal
Students will assess how government and stakeholders can plan for and respond to coastal hazards.
Learning Objectives
By the end of this module, students should be able to:
-
examine the stages of the disaster management cycle and its application;
-
identify and compare policy options for preparing for and responding to immediate coastal hazards;
-
critically assess the implementation of the emergency management cycle in real disaster case studies.
Module 12 Roadmap
| -- | Assignment |
|---|---|
| To Read |
|
| To Do |
|
Questions?
If you have any questions, please use the Canvas email tool to contact the instructor.
Policy, Natural Hazards, Disasters, and the Emergency Management Cycle
Policy, Natural Hazards, Disasters, and the Emergency Management Cycle
Let’s go over some emergency management terminology to begin.
Policy
A policy is a principle or set of principles that guides decisions and tries to produce sensible, positive outcomes or to avoid the negative effects of some behaviors. A policy can apply to governments, businesses, other groups (such as sports teams or college courses), and even individuals. Policies are often established by governing bodies and implemented by executive officers. Many levels of government, schools, etc., have recently developed policies to help guide people through the COVID-19 pandemic.
Policies can only suggest ways for people or groups to do the right things or to avoid doing the wrong things, while rules or laws can use punishment as enforcement. We have all become familiar with the heated debates about mask-wearing during the pandemic. These arguments underline the difference between policy and rule of law.
So, tsunami and hurricane storm surge policies aim to help the public avoid or minimize harm from these natural hazards and recover quickly and efficiently from them when they strike.
Natural Hazards
Natural hazards are geophysical events that pose threats to human life or health, to the natural or built environment on which people rely for life support, and to things that people value, such as economic wealth or material possessions. Natural hazards are potentialities; that is, they have not yet happened but could occur at some time in the future.
Disasters
When a natural hazard such as a tsunami or hurricane does become active, it can trigger a disaster. Natural disasters are the major adverse human events resulting from natural hazards. Disasters are typically associated with loss of life, impaired human health, destruction of the natural and built environment, financial damage, and loss of land and possessions. The severity of the disaster is a function of the magnitude of the geophysical event coupled with the vulnerability of the people and place, which was the topic of Module 11.
Emergency Management Cycle
The emergency management cycle is used to understand appropriate human preparation for, and response to, disasters, including those resulting from a coastal hazard. The emergency management cycle can be divided into four stages: mitigation, preparedness, response, and recovery.
Mitigation
Mitigation includes all efforts that a person, household, community, or any other social unit takes to make a disaster less likely to happen or to reduce the negative effects if a natural hazard were to occur. Mitigation activities occur well before a natural hazard strikes and can be structural, such as building a sea wall, or non-structural, such as developing a warning system.
Preparedness
Preparedness, in contrast to mitigation, can take place right before the natural hazard strikes. Its goal is to make sure that the individual or community knows which tools to possess and how to use those tools, what actions to undertake. The actions can also continue during the hazardous event, or immediately after disaster strikes. In preparing for a hurricane, for instance, important preparedness activities may include planning for evacuation, including knowing when to evacuate, which destination to evacuate to, and what evacuation route to take.
Response
Response is the emergency assistance that takes place during or immediately after a disaster. Its purpose is to save lives, treat injuries, and reduce property damage while meeting the most fundamental needs — water, food, shelter, and medical aid — of the people affected by the event. The response period is stressful both to emergency managers, who face limited time, information, and resources, and to the public, who face evacuation, family separation, and the loss of property and loved ones.
Recovery
Recovery is the stage during which individuals, families, communities, and governments repair and reconstruct what has been damaged by or lost in the disaster. At the same time, recovery presents an opportunity to reduce the risk of a similar catastrophe in the future – in other words, to start mitigation activities and thereby start the emergency management cycle again.
In reaction to the disaster, governments usually provide substantial resources for recovery, including economic recovery, housing recovery, and individual, family, and social recovery, and possible mitigation of potential future natural hazard events. In addition, funds and assistance come from many other sources, including non-profit organizations, faith-based organizations, and volunteers.

Mitigation
Mitigation
Introduction
Mitigation involves taking action to reduce risk. Mitigation is a long-term planning activity, unlike preparedness, response, and recovery, which are more immediately part of the emergency itself. But mitigation can begin following a disaster, during recovery, to mitigate the effects of any future disaster. In the mitigation phase of the emergency management cycle, activities aimed at decreasing the likelihood of disaster or reducing its negative impacts can either be structural or non-structural. Examples of structural mitigation activities include building physical infrastructure such as sea walls or retrofitting existing buildings to withstand the hazard, or to serve as shelters. Instances of non-structural mitigation activities include developing storm surge warning systems, post-disaster recovery plans, and educational programs. Other non-structural mitigation measures include flood insurance programs (although some consider this as part of preparedness), and land use planning activities like zoning. As you can see, mitigation activities are wide-ranging and can overlap with other phases of the emergency management cycle.
Learning Check Point
Please take a few minutes to think about what you just learned and answer the question below.
Structural Mitigation
Structural Mitigation
Constructing levees and seawalls is probably the most obvious mitigation measure to protect a community against disaster. Seawalls can be very effective in physically impeding the progress of a tsunami and are common in tsunami-prone parts of the world, such as Japan. However, as the case of the Fukushima Daiichi disaster, which we covered in Module 11) demonstrates, cost considerations or inaccurate estimates of potential tsunami heights may result in seawalls of insufficient height to serve their intended purpose. Additionally, structures like levees require maintenance, and it was a lack of attention to the structural integrity of the levees protecting New Orleans that lead to the disaster of Katrina’s flood there.
In Module 8, we looked at the various hard structures and their designs for protecting coastlines and communities. In Module 10 we looked at smart building measures – both traditional and newly innovative. These measures are all methods for mitigation, and many have been used for centuries. The managed retreat strategies we explored in Module 9 are also considered mitigation measures.

Another structural mitigation measure is constructing or retrofitting buildings for use as shelters. As hurricane storm-surge risk zones expand as sea levels rise, so the location of existing shelters in hurricane-prone regions must be reevaluated over time. It is also important to note that tsunami shelters are only useful if a community is far enough from the tsunami source to allow sufficient warning for residents to get to the shelter. On the northeastern coast of Japan, for example, residents may have only minutes to respond between the time of the earthquake and the arrival of the tsunami.
Non-Structural Mitigation
Non-structural Mitigation
Warning Systems and Community Education
Developing effective warning systems is an essential non-structural mitigation activity. Hurricane forecasts typically provide a few days’ advance notice of the potential for a hurricane affecting a particular area; While not perfect, storm surge forecasts can provide enough time for emergency managers to issue warnings. After Superstorm Sandy, a storm surge warning system was developed for the Meadowlands District in New Jersey that can provide storm surge forecast maps at least three hours in advance. When a hurricane is approaching the shoreline of the U.S. the National Hurricane Center issues regular advisories which give graphic information about storm surge, as well as estimates of the height of the storm surge for an area (form of estimates for certain stretches of coastline). Local authorities can take this information and use it to warn residents, for example, if a certain roadway is likely to flood, or if a levee is likely to be topped. Each storm is unique and, due to the many factors driving the impacts in a particular location (say, your house), storm surge forecasting is still tricky to predict on a small scale, especially because it is affected by even small changes in the landfall location as was the case in Hurricane Laura in August 2020. On a neighborhood or larger scale, the National Storm Surge Hazard Maps [9] provide an interactive mapping tool to estimate storm surge based on the hurricane category on the Saffir-Simpson Scale.

Establishing detection and warning systems are particularly essential to tsunami policy, as we have mentioned in previous modules. After a 1946 tsunami killed 160 people in Hilo, Hawaii, and 5 in Alaska, the United States established its first tsunami warning center in Ewa Beach, Hawaii. This center, now known as the Pacific Tsunami Warning Center (PTWC), is responsible for issuing most tsunami warnings for areas bordering the Pacific Ocean. A center in Palmer, Alaska, currently known as the National Tsunami Warning Center, provides warnings for Alaska, the Pacific coast of Canada, and the Pacific coast of the continental United States.
Following the 2004 Indian Ocean tsunami, which cost hundreds of thousands of people their lives, the United States spearheaded an effort to establish regional warning systems worldwide for coastal regions vulnerable to tsunamis. Initial responsibility for managing the Indian Ocean and Caribbean Sea systems fell to the PTWC, but the Indian Ocean system is now administered by national government organizations in Australia, India, and Indonesia, while a Caribbean Sea center opens in Puerto Rico in early 2021. Together with the North Atlantic and Mediterranean Tsunami Warning System, a European partnership, these organizations provide critical early warnings for tsunami events that serve an important preparedness function for regions exposed to tsunamis. See more details about the Global Tsunami Warning and Mitigation System in the Banda Aceh Case Study in this module.
In addition to having a sophisticated warning system in place and multiple ways to communicate warnings to residents, including phone texts, email, local TV news, as well as announcements via other broadcasting methods such as mosque loudspeakers in Islamic communities, and community group messenger networks, public education about what to do when an alert is broadcast is essential. This need is articulated in the case study in this module on the 2004 Indian Ocean tsunami and its impacts in Banda Aceh, Indonesia.

Other Non-Structural Mitigation Activities
Post-Disaster Recovery Plan
After disasters occur, the recovery process can be complex and overwhelming, so a post-disaster recovery plan is another helpful non-structural mitigation measure put in place by community-level government agencies. There are many aspects of recovery – economic, housing, environment, and social recovery – that should be considered. There are also many stakeholders who need to be involved in the recovery process. Developing a post-disaster recovery plan can identify and prioritize tasks and can recognize and engage stakeholders before an event takes place, thereby assisting recovery and minimizing chaos during a stressful time.
Zoning
Another non-structural mitigation measure is zoning. Zoning enables local or regional governments to set restrictions on the types of structures that can be built in various locations within their jurisdictions. This tool can be used to prevent critical infrastructures such as power plants and hospitals from being built in tsunami or storm surge inundation risk zones. It can also be used in conjunction with development restrictions to prevent projects that would damage natural habitats, such as mangroves, that can mitigate tsunami or hurricane damage.

Education and Outreach
As we noted above, educating the public about mitigation measures are essential so that residents know what they can do to protect themselves, their families, and their property. So, education about tsunami and storm surge planning can fall under mitigation, but it is also part of preparedness.
Mitigation Summary
Mitigation Summary
Policies that promote mitigation are crucial to reducing the threat of disaster caused by natural hazards. In the United States, the National Tsunami Hazard Mitigation Program (NTHMP), run by NOAA in cooperation with USGS, FEMA, and the coastal U.S. states, has been developed to encourage tsunami mitigation practices. For more information, see the Tsunami Risk Reduction for the United States: A Framework for Action [14]. NOAA also manages the Storm Ready [15] and Tsunami Ready [16] programs, which recognize thousands of counties, communities, universities, and other members that meet a set of mitigation and preparedness criteria. Such programs and the policies advancing them are foundational to protecting people and places from disaster.
Preparedness
Preparedness
The goal of the preparedness stage of the disaster management cycle is to enhance people's capacity to respond to natural hazards and recover from a disaster. The basis of preparedness is planning, whether that planning takes place at the household, local, state, national, or international level. Thus, policies from a local to international scale that guide sound hazard and disaster planning are essential. Emergency planning and communication of plans for their successful execution when a hazard occurs, happens at many levels of society, from the federal level down to the individual. Therefore, for organizational units including state, county, and city governments, to schools, universities, hospitals, and many other organizations, a clear plan is essential.
Insurance Challenges
Insurance Challenges
Insurance coverage for homeowners in hurricane prone areas is becoming one a major policy challenge. As it turns out both instructors have their own insuance nightmare stories to tell.
The recent and ongoing cost increases for homeowner’s and flood insurance coverage in coastal Louisiana (including metro New Orleans), coupled with collapse or relocation of some insurance companies, is negatively impacting ordinary, working people who live in the area. Dinah’s experience may be “average” compared to her neighbors, some of whom have suffered much greater heartache and loss following Hurricane Ida in 2021. Ida hit the Louisiana coast as a category 4 storm, wrecking the Gulf town of Grand Isle and leaving a wide swath of flooding and wind damage in its wake as it traveled inland. Jogging close to New Orleans, it wreaked havoc in the western suburbs of the city, leaving tens of thousands of damaged roofs, not to mention cutting power and water for weeks. Then came the insurance nightmares, playing out over the next couple of years. Dinah had a homeowner’s policy with a company that left Louisiana because of Ida’s losses. Although this insurance company did cover the cost of the repairs, including a new roof, a new homeowner’s policy had to be found. As of 2023, the cost of the new homeowner’s policy is approximately 3 times the cost of the original one at over $3,000 annually. Many families cannot afford these policies, and some go without. This results in neighborhoods sporting blue tarps for years after a storm as repairs are unaffordable for many families.
Meanwhile, flood insurance has increased steadily each year (FEMA's updated Risk Rating 2.0 is allowed to impose an 18% annual increase to existing policies). Dinah’s house is in flood zone X and does not require a flood insurance policy, but recent experiences in Louisiana mean it is wise to carry flood insurance in this location. The house is a few blocks from the Mississippi River levee and close to much lower ground and flood zone AE. Dinah’s family also has a small home in coastal Mississippi (flood zone AE), built recently and elevated to 20 feet (3 feet above the required base flood elevation). Flood insurance on this property under the new National Flood Insurance Policy is $4,000 annually. Again, this is a modest house and built with flood mitigation in mind. Other properties are much more costly to insure or are uninsurable because they do not meet minimum elevation requirements. In some cases, families use cash to purchase homes and go without insurance. It is clear as Dinah looks around and talks to neighbors that these increasing costs are having a deep impact on the housing market, changing what were previously modest neighborhoods in coastal areas into places only the wealthy can afford, and many properties are bought by companies that make rental money from them. This is happening all around the coastal areas of the U.S. and impacting millions of people.
Tim’s insurance nightmare started after hurricane Fran sent a 150 foot red oak tree onto his Chapel Hill house at 2AM on September 6th 1996. The tree caused extensive roof damage and water damage in the house. Ceilings were wrecked and carpet was damaged. He contacted his insurance companies, one of the largest insurance companies in the country, and they came out to the house within days and promised to help restore the damage. It was a shock when a letter from the adjustor arrived with estimates of what the company would pay. 54 cents a square foot for ceilings to be repaired, a few hundreds of dollars for the roof. This was insult to injury for Tim and his family who had endured to trauma of a massive tree hitting their roof followed by 10 days without power in sweltering heat.
This anecdote is sadly very common for home and business owners who have been impacted by storm damage and the situation seems to be getting worse as coastal areas have become increasingly developed and storms more devastating. In fact, insurance companies themselves have been faced with major financial losses resulting from major hurricanes. Homeowners’ premiums have risen sharply, and in several cases, insurance companies have left states such as Florida and Louisiana because business is not profitable. This leaves states in a real bind as these two videos show.
Video: Florida Faces Insurance Crisis From Hurricane Ian (7:56)
Video: Louisiana's Insurance Crisis: Homeowner's policy rates by ZIP Code (7:22)
The National Flood Insurance Policy (NFIP)
The National Flood Insurance Program (NFIP)
If you purchase property in a flood zone, and you have a mortgage, you are required to purchase a flood insurance policy in addition to a homeowner’s policy. The National Flood Insurance Program, (NFIP) was created by legislation in 1968 and has maintained the affordability of insurance for homeowners in flood-prone (both inland and coastal) areas since then. This sounds like a great idea on the surface, but there are some problems with this policy that need to be addressed by Congress.
The NFIP was created to protect property owners in flood-prone areas from disastrous losses in the event of flooding. NFIP, which is managed by the Federal Emergency Management Administration (FEMA) is federally subsidized and kept affordable by borrowing money from the U.S. Treasury in order to keep the program solvent. It is currently in “deep water” so to speak, in fact, it is in debt to the tune of $40 billion. Climate change is complicating the picture. Because of the increase in the frequency of catastrophic flooding in the past 20 years, NFIP has become deeper in debt and in danger of lapsing coverage for property owners. For example, in 2017, many Houston residents whose property flooded in Harvey were not required to have insurance based on their flood zones. This raises further questions about how to manage flood loss in the coming years. The NFIP is no longer a sustainable way to protect property, and it is clear that changes are needed.
Also, although it was not originally intended to do so, the affordability of flood insurance through the NFIP has encouraged development in flood-prone areas, creating an even bigger problem. Homeowners have become accustomed to the availability of affordable flood insurance for their primary residences as well as their second homes on the coast, the number of which has ballooned since the NFIP first came into existence. According to a 2013 study, about one-third of all properties insured under NFIP are second homes (Gaul, 2019).
Without government subsidies insurance rates are likely to increase dramatically, so attempts to change the NFIP have so far been unsuccessful. However, FEMA is in the process of updating the NFIP with the Risk Rating 2.0 Program, which went into effect in 2021.
The overhaul is designed to help address some of the inequity issues with the NFIP and to update the process using current data and technology. New maps are replacing the older FIRM maps and properties are assessed based on their proximity to a water body as well as other features of the property. Raising your property’s height to an additional elevation above the standard base flood elevation* no longer reduces flood insurance premiums, however. You can read about these changes at FEMA: RiskRating 2.0: Equity in Action [21].
The 21st-century rating system, Risk Rating 2.0—Equity in Action, provides actuarially sound rates that are equitable and easy to understand. It transforms a pricing methodology that has not been updated in 50 years by leveraging improved technology and FEMA’s enhanced understanding of flood risk. (fema.gov)
Video: Defining a Property’s Unique Flood Risk (1:15)
However, there is still work to be done, as in some cases flood insurance has become unaffordable. Lower-income families are having to forego insurance, placing them further at risk. The changes have the potential to change where people choose to build or buy, and the changes are also affecting the livelihood of people who live and work in communities that are flood-prone.
According to the Natural Resource Defense Council (NRDC) in It’s Time to Fix Our Water-Logged National Flood Insurance Program (nrdc.org) [24]:
Congress must act to create a means-tested flood insurance option that helps lower-income families purchase flood insurance, and that prioritizes those same families for flood adaptation assistance. (nrdc.org)

More on Flood Insurance Rate Maps and Base Flood Elevation
Flood Insurance Rate Maps | FEMA Flood Maps Explained [26] are used to determine a property’s flood insurance. A potential homeowner can access these maps before deciding to purchase property in a flood zone. The maps are also designed to help residents of coastal communities plan for and mitigate the flood risk to their properties by delineating flood zones and identifying Base Flood Elevations (BFE). The BFE is the height to which a location has a 1% annual chance of being flooded. A house must be built at or above the BFE to be eligible for flood insurance.
The FIRM zones are based on elevation and proximity to water, as well as several other factors that determine a property’s risk of flooding. Visit this site to read about the flood zones shown on a Flood Insurance Rate Map (FIRM) [27].
Emergency Operation Plans
Emergency Operation Plans
For state and local governments as well as entities such as hospitals, universities, and school districts, developing Emergency Operation Plans (EOPs) is a vital task. An EOP helps everyone who is involved in the disaster management cycle know what he or she should do from the point at which a natural hazard threatens to strike, all the way to the final recovery from the ensuing disaster. It explains who will do what, when, with what resources, and by what authority. Included in these responsibilities is the need to transmit hazard preparedness information and last-minute hazard information to the public. In the response period, when time is in short supply and everyone – from the highest government official to individual householders – is under stress, an EOP helps people respond appropriately and use resources efficiently. See an example of part of an EOP in Box 1.
Box 1: An example of an Emergency Operation Plans (EOP)
Brunswick County is located on the Atlantic coast of North Carolina and is often assaulted by hurricanes. It suffered several direct hits from hurricanes in the 1990s and most recently received a direct strike from category 2 Hurricane Arthur in July 2014. In response to this annual threat, the county in 2008 developed a long and detailed Emergency Operations Plan (EOP) for multiple hazards, including an annex designed specifically for hurricanes.
Presented here are modified excerpts of the hurricane annex to help you understand what an EOP looks like. The first part of this example defines Operating Conditions, or OPCONs, that trigger emergency management actions. There are 5 OPCONs: OPCON 5, Hurricane Season; OPCON 4, Alert; OPCON 3, Stand-by; OPCON 2, Preparation; and OPCON 1, Evacuation. The second part of the example lists important actions to take during the OPCON 2 Preparation phase.
OPERATING CONDITIONS (OPCONs)
The Control and Support Groups will be located in the Brunswick County Emergency Operations Center (EOC) at the Brunswick County Government Center. In the event that it becomes necessary to move the groups to an alternate EOC, the new location will be announced.
OPCON Triggers: To ensure that all activated personnel in the county have a coordinated hurricane response activities approach, the following OPCON levels will be utilized throughout the event.
- OPCON 5: Hurricane Season
This OPCON indicates that hurricane season is open. Brunswick County will stay at OPCON 5 as of June 1st, the start of the hurricane season. At this time, all hurricane plans and procedures should be reviewed. Alert Rosters should be updated and verified. Storms will be monitored and tracked at this level. - OPCON 4: Alert
If the Brunswick County Emergency Management Director determines that a storm could possibly threaten Brunswick County, the County will be moved to OPCON 4. The primary events that will take place at this level are the notification of key personnel of the threat, and initiation of preparatory activities. The EOC (Emergency Operation Center) will not be activated at this stage. - OPCON 3: Stand-By
Once the Brunswick County Emergency Management Director has sufficient information that a storm poses a significant threat, the County will move to OPCON 3. This decision will be based on each of the storm’s specific characteristics. The EOC will be activated at this level, either at a partial or full status. The primary events that will occur include discussing evacuation and conducting pre-evacuation conferences and other preparatory activities. - OPCON 2: Preparation
Once a decision is made to recommend a Voluntary Evacuation or Mandatory Evacuation, the OPCON level will automatically move to OPCON 2. The EOC will be under Full Activation at this level. At this level, shelters will be prepared for opening. Public notification will be coordinated and press conferences coordinated. It is understood that once the County moves to OPCON 2, the County is prepared to commit substantial amounts of money and resources to the effort. - OPCON 1: Evacuation
Once a Voluntary Evacuation or Mandatory Evacuation order is announced to the public, the OPCON automatically moves to OPCON 1. At this level, the primary activity will be the evacuation of the vulnerable population. The EOC will remain at full activation throughout the evacuation and landfall.
EMERGENCY SERVICES
- Manage the EOC Operations in accordance with the Brunswick County EOP.
- Notify the following agencies of the current situation:
a. EOC Operations Personnel
b. North Carolina Emergency Management EOC
c. National Weather Service, Wilmington
d. County Administration / Elected Officials
e. Municipalities
f. Utilities and other stakeholders
g. Adjoining County Emergency Management Divisions - Monitor the weather situation.
- Be available for media interviews and press conferences.
- Install Variable Message Signs at designated locations.
- Begin monitoring traffic patterns and prepare to adjust traffic signals, as appropriate.
- Prepare to implement the traffic assistance plan.
- Complete the establishment of the Amateur Radio Network.
- Position equipment to support evacuation.
- Take appropriate actions to protect critical Brunswick County facilities.
- Coordinate for the movement and/or protection of Fire/EMS equipment during the storm’s impact.
- Assist with status information concerning Law Enforcement Management.
- Prepare to open shelters.
- Coordinate with the PIO for a press release once the evacuation decision is announced.
- Prepare to open Special Medical Needs Shelters if needed. Coordinate with the PIO for a press release once the evacuation decision is announced.
- Position resources to assist with the management of the evacuation traffic. Resources must be in place prior to the start of the voluntary relocation.
- Prepare to conduct “evacuation warning” in the evacuation zones, within the unincorporated portions of the county.
- Implement the security plan in the evacuated areas.
Educating the Public about Tsunami and Storm Surge Preparedness and Warning Systems
Educating the Public about Tsunami and Storm Surge Preparedness and Warning Systems
Educating the public about the existence of warning systems, how they work, and how to react when it is activated are essential components of the preparation.
Tsunami Warning and Public Readiness
In the parts of the United States' most vulnerable to tsunamis – that is, the coastal zones of Hawaii, Alaska, Washington, Oregon, and California – this primarily takes the form of evacuation planning. Anyone driving through low-lying coastal areas of these states is likely to notice tsunami hazard zone and tsunami evacuation route signs lining the roads, and warning signs in beachside hotels and motels.

The National Weather Service’s Tsunami Ready [28]website provides a wealth of guidance for the public about what readiness for a tsunami involves and how to achieve it. Communities can organize tsunami ready training through the NWS program with the goal of achieving community-wide tsunami readiness.
Residents and visitors on the Oregon coast have several location-specific tools to use to learn about tsunami risk in their area and to receive messages about tsunami threats. The State of Oregon Department of Geology and Mineral Resources Oregon Tsunami Clearinghouse [29] is a web site where you can go to get detailed evacuation maps, smartphone apps to aid evacuation, and an interactive evacuation zone map viewer at NVS Tsunami Evacuation Zones [30].
Learning Check Point
Hurricane Storm Surge Warnings and Public Readiness
When a hurricane is approaching the United States and threatens to make landfall, Emergency Operation Plans go into action in the areas likely to be affected. As we mentioned above in the mitigation section, forecasting local storm surge levels can be challenging as it depends on several factors, including the track of the storm, exact landfall location, the timing of the tide cycle, water depth, and the angle and slope of the shoreline, complicating accurate predictions. This, in turn, affects preparation communication.
Therefore, hurricane preparation in a community that may receive a storm surge must start well before the magnitude of the threat is certain for that location. Evacuation orders should be made 72 hours in advance of a storm’s landfall. Many mandatory evacuations have been communicated to the public, only to see the path of the hurricane turn elsewhere. This means that city or county leaders must decide several days out to close schools and businesses, mobilize transportation for those without, prepare shelters, etc. Additionally, all communities within the “cone of uncertainty” of forecast tracks based on modeling, must be on alert and be making preparations. A storm’s track can change significantly during the approach, depending on the steering factors. Hurricane Sally in September 2020 is a good example. Greater New Orleans and Southeastern Louisiana were under a hurricane warning and evacuations and preparation well underway but within 36 hours of landfall, the track moved significantly to the east, so that Mississippi, Alabama, and western Florida received the brunt of the storm surge effects and hurricane warnings were downgraded to tropical storm warnings in New Orleans. Residents of the storm-aware Gulf coast must stay vigilant for these kinds of changes in the forecast.
On a family level, preparedness begins with making a hurricane supply kit (see below) and making a plan for the event of a hurricane. Within 72 hours of landfall, multitudes of decisions must be made, and actions taken. A very abbreviated list of things to be considered in a coastal community threatened by storm surge is: Securing or moving all moveable/ floatable items to a safe place; Securing boats in dock; fueling and moving vehicles, boats, trailers, etc. out of harm’s way; securing the house, by boarding up windows or closing hurricane shutters, and turning off water and power; planning evacuation route and accommodation while away; and communicating with neighbors and family members to ensure everyone has a way to evacuate and a place to go.
Information driving preparedness is broadcast in many ways. A resident in a storm surge zone can best track the storm via local TV news stations and weathercasts to find details about the storm’s impacts in their community. These are often pushed as notifications to mobile devices. The National Hurricane Center [31] provides many kinds of useful graphics that are updated every 4 hours. Mobile Apps are available to access this information too.

Challenges with Communicating Emergency Plans
Challenges with Communicating Emergency Plans
It is easy to recognize the importance of communicating emergency plans to the public, but many problems can occur in the process. In reality, when emergency information is sent out by a city or state governmental entity, some people will not receive this information, or they may not respond appropriately to it. For example, if the information is broadcast only in English, then non-English speakers in the United States may not fully understand the messages. Poor households in developing countries may not have radios, televisions, smartphones, or other devices needed to receive the information.
Due to many factors (cultural, language, economic, psychological, and social), some people who do receive and understand the government’s communications will choose not to heed warnings and follow instructions given by the government. In the case of Hurricane Katrina, many long-time New Orleans residents chose to stay in New Orleans despite dire evacuation warnings. Among many reasons used for not evacuating, some included: financial constraints on their ability to evacuate the city (typically lack of transportation and no funds for traveling); frequency of hurricane evacuation warnings in recent years (evacuation fatigue); misconceptions about the severity of the storm; perceptions that they were not vulnerable to hurricane risks; worries about leaving pets; and concerns about the need to protect their property from criminal activity.
In many communities in the U.S. and elsewhere in the world, cross-cultural communication has been adopted to ensure all residents receive important messages for preparation for hazardous events. Cross-cultural communication recognizes the diversity of target populations in terms of language and culture, and emergency managers must take these factors into account so that messages are broadcast in the multiple languages spoken in the community in question. Using multiple media platforms and methods for disseminating messages is also essential. The technology available to many people such as texting and social media has helped greatly in recent years. Traditional media like television, radio, newspapers, the Internet, and printed flyers are still important, but other ways of communicating, such as through multiple social media platforms, have become more and more important. Modern communication tends to depend heavily on the mobile or cellular telephone network. In cyclone and tsunami conditions, communication towers can be toppled and rendered useless. In 2005, when cellphone use was common, but texting was less common, loss of communication was an enormous problem across the Gulf Coast following Hurricane Katrina, rendering cellphones useless and greatly hampering search and rescue and preventing people from locating loved ones.
Learning Check Point
Please take a minute to answer the question below. It will not be graded, but it may help you on the Module Summative Assessment.
Creating an Emergency Supply Kit
Creating an Emergency Supply Kit
The Department of Homeland Security’s website: Ready [34] gives guidance to Americans on readiness for all types of emergencies. The section focusing on hurricane preparedness includes this engaging video to catch the viewer’s attention.
Please watch the following short video on hurricane preparedness from Ready - Hurricanes [35].
Video: When the Waves Swell (1:30)
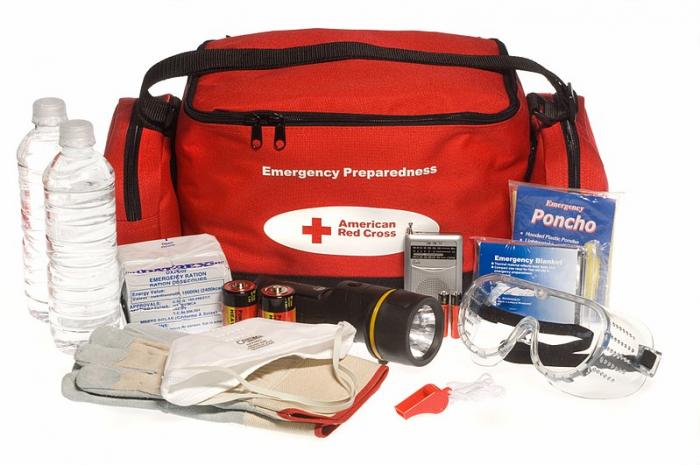
A basic emergency supply kit suggested by ready.gov includes the following recommended items to prepare in case of evacuation:
- Water, one gallon of water per person per day for at least three days, for drinking and sanitation
- Food, at least a three-day supply of non-perishable food
- Battery-powered or hand-crank radio and NOAA Weather Radio with tone alert and extra batteries for both
- Flashlight and extra batteries
- First aid kit
- Whistle to signal for help
- Dust mask to help filter contaminated air and plastic sheeting and duct tape to shelter-in-place
- Moist towelettes, garbage bags, and plastic ties for personal sanitation
- Wrench or pliers to turn off utilities
- Manual can opener
- Paper local maps
- Cell phone with chargers, inverter, or solar charger
I am adding a couple of items to this list from the article in the Tampa Bay Times linked below:
- Camping equipment – Sleeping bags, pillows, and propane stove
- Plenty of cash to tide you over a period of no power for digital payment transactions
- Prescription medications and medical records if health conditions warrant
- Personal documents such as government ID, passport, birth certificate (latter should be stored in a dry box in a safe place if not included in evacuation kit)
Emergency Supply List
Building an emergency supply kit is an important hurricane preparedness activity. Go to Ready [37] and find a document called Emergency Supply List. This is a list that helps you build an emergency supply kit. The document identifies recommended basic items and additional items for adding to the kit. Answer the questions below, identifying the items listed either as a “basic item” or an “additional item” based on this document.
Learning Check Point
Check all that apply for each question
Additional Emergency Preparation Considerations
Additional Emergency Preparation Considerations
Example of Community Hurricane Preparation – Tampa Bay Times
Tampa Bay Times provides readers with very thorough guidance on hurricane preparation:
- Hurricane 2019: The gear you need to stay safe - and comfortable - for the storm [5]
- Hurricane 2020: Protect your home, business, documents, and photos [38]
These two articles cover hurricane preparation – including protecting property and preparing for evacuation. The article covering protecting homes and businesses makes some very important points relevant to any hurricane season, but particularly relevant to 2020, with the extra complication of the COVID-19 pandemic. It emphasizes the importance of planning ahead and making preparations such as purchasing supplies for securing homes and businesses (generators, plywood, storage bins, etc.) early in the hurricane season, and not waiting until a storm threatens.
It also details important tips on storing important documents in waterproof containers ready for evacuation and having a supply of prescription medications on hand for the event of a long period without pharmacy service. The importance of these details may easily be overlooked until the event. Many New Orleanians can attest to this, having neglected to prepare ahead of time and protect essential documents like birth certificates and medical records, which had to be replaced after Katrina. Another really important tip is to have cash on hand. Without power, normal methods of card payment and bank ATM machines and the like do not work. Without cell phone service and power, the ability to access information and to do online banking and shopping is severely curtailed.
In addition, the importance of preparing digital copies of important documents cannot be overemphasized. But this also brings up the importance of taking care of computers and other digital devices and office equipment. File backup onto portable hard drives is essential and once this is completed, if a storm is threatening your area, desktop computers, larger devices, and machines should be powered down and unplugged. All valuables should be moved to the highest points of homes, such as upstairs, if possible. Tablets, phones, etc. should also be backed up but they should be included in the to-go list. It’s important to remember that although you hope you will be able to return in a couple of days after evacuation, this may not be possible. So, preparing for at least one week is important. After Hurricane Katrina, most New Orleans residents could not return for 6 weeks or longer and returned only to survey destroyed properties.
Learning Check Point
This activity will not be graded, but the Module Summative Assessment requires you to have the skills and knowledge it applies. Please take a few minutes to think about what you just learned and answer the questions below.
Summary: Preparedness
Summary: Preparedness
In short, policies that encourage emergency planning, including effective communication of warnings and evacuations, are foundational to protecting people and places from the ravages of tsunamis and hurricane storm surge.
Response
Response
Response policies guide actions undertaken during and in the immediate aftermath of a tsunami, storm surge, or other natural hazard events. The most immediate response is activating warning systems, evacuating residents, and activating the emergency plan (if there is one available). With sufficient warning time, it may also be possible to pre-position personnel and supplies that will be needed for recovery efforts in areas adjacent to those likely to be affected by the tsunami or storm surge.
Immediately following the passing of the hazard event, the scope of the disaster becomes evident, and response activities expand considerably. It is important for governmental staff and others to follow their assigned responsibilities according to the EOP. For emergency managers, the most urgent need is search and rescue. Locating victims and providing medical treatment needs to be accomplished as quickly as possible. Search and rescue teams also may be responsible for addressing dangerous conditions left in the aftermath of the disaster, such as dangling live wires and gas leaks. The emergency needs to be assessed and updated regularly as new information becomes available and the situation on the ground changes.


Overcoming Response Challenges
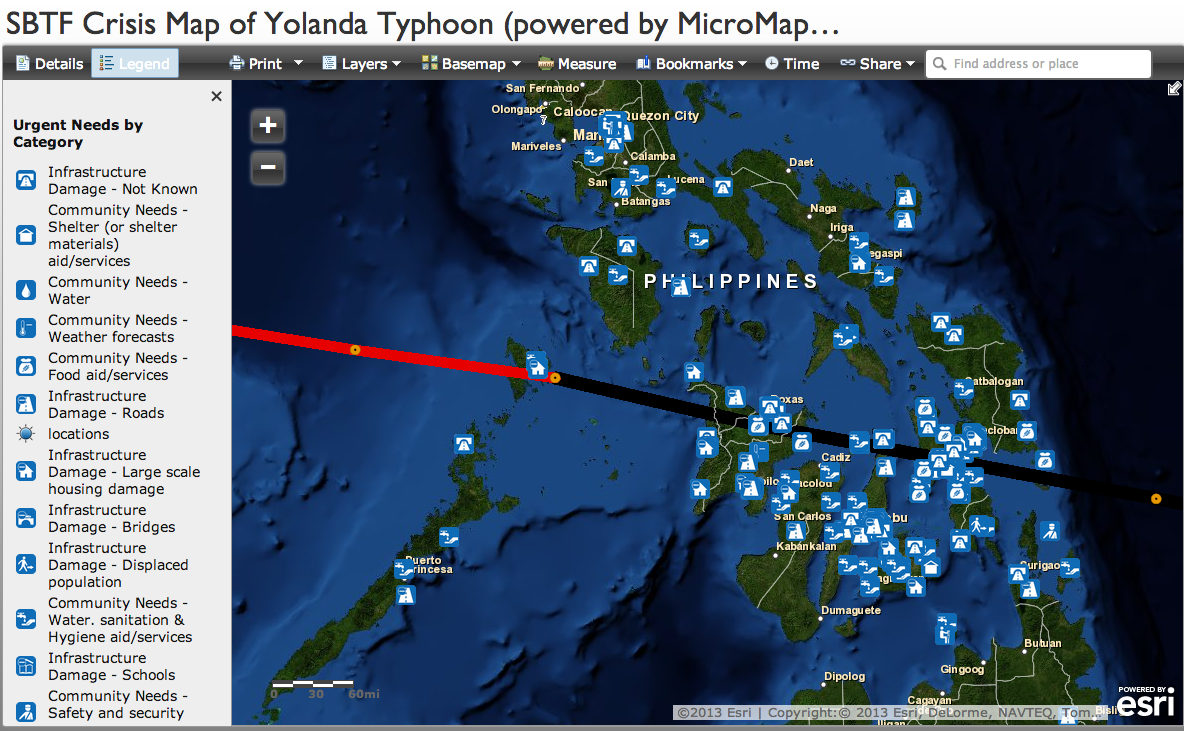
Overcoming Response Challenges
While many people and organizations are eager to help in search and rescue activities, numerous challenges occur during this tense period. For example, volunteers from outside the area might have a hard time locating victims or knowing the most urgent needs of local people or communities. Using real-time tools can help address this issue. Disaster victims and other local people should be encouraged to use Twitter, Facebook, or other social media to post search and rescue information. The GPS locations of these social media posts can then be used to create real-time crisis maps, which can help inform rescue personnel which areas to concentrate on. Lack of coordination among organizations from both inside and outside the locale might also occur, and this can waste valuable time – for example, by searching the same place several times for victims. To address this problem, large-scale disasters need an operations office to coordinate the rescue teams. An example of the challenges of search and rescue during the response to Hurricane Katrina is shown in Box 2, taken directly from the White House archives.

Box 2: Search and rescue in the Hurricane Katrina disaster
-
Critical Challenge: Search and Rescue
After Hurricane Katrina made landfall, rising floodwaters in New Orleans stranded thousands on rooftops, requiring a massive civil search and rescue operation. The Coast Guard, FEMA Urban Search and Rescue (US&R) Task Forces, and DOD forces, in concert with State and local emergency responders from across the country, courageously combined to rescue tens of thousands of people. With extraordinary ingenuity and tenacity, Federal, State, and local emergency responders plucked people from rooftops while avoiding urban hazards not normally encountered during a waterborne rescue.
Yet many of these courageous lifesavers were put at unnecessary risk by a structure that failed to support them effectively. The overall search and rescue effort demonstrated the need for greater coordination between US&R, the Coast Guard, and military responders who, because of their very different missions, train and operate in very different ways. For example, Urban Search and Rescue (US&R) teams had a particularly challenging situation since they are neither trained nor equipped to perform water rescue. Thus, they could not immediately rescue people trapped by the floodwaters.
Furthermore, lacking an integrated search and rescue incident command, the various agencies were unable to effectively coordinate their operations. This meant that multiple rescue teams were sent to the same areas while leaving others uncovered. When successful rescues were made, there was no formal direction on where to take those rescued. Too often, rescuers had to leave victims at drop-off points and landing zones that had insufficient logistics, medical, and communications resources, such as atop the I-10 cloverleaf near the Superdome.
-
Lessons Learned
The Department of Homeland Security should lead an interagency review of current policies and procedures to ensure the effective integration of all Federal search and rescue assets during disaster response.
Credit: Whitehouse Archives [42]
As the tsunami or storm surge disaster unfolds, emergency workers need to help make sure survivors have access to water, food, shelter, medical care, and sanitation. Depending on the scale and location of the disaster, each of these needs may present significant logistical challenges. People displaced from their homes have no access to these essential needs, and even families whose homes were not destroyed may not have water (due to contamination or pipeline disruption) or food (due to supply chain interruption and loss of refrigeration from electricity outages). The number of injured may exceed the capacity of existing medical care facilities, and those facilities themselves may be damaged, destroyed, or without power in the wake of a tsunami or storm surge. Damage to water and sewage infrastructure may also create a risk of outbreaks of diseases such as cholera, which emphasizes the need for repairing critical infrastructure as quickly as possible.

Response Examples from 2020: Hurricane Laura in S.W. Louisiana
Response Examples from 2020: Hurricane Laura in S.W. Louisiana
In the early hours of August 27, 2020, Hurricane Laura made landfall as a category 4 storm on the coast of Southwestern Louisiana, near the Texas border. This coastal area is sparsely populated, with the town of Cameron (population around 400) close to the shoreline and in the direct path. The industrial city of Lake Charles (population 80,000+) sits just 30 miles inland across flat, marshy terrain with direct water connections to the Gulf. Laura hit Lake Charles almost directly, packing winds of close to 150 miles per hour and leaving a path of destruction. Lake Charles and neighboring Westlake are home to several oil refineries and chemical plants. Oil refineries must be shut down with the approach of a storm to prevent hazardous results such as explosions, fires, and leaks. A chlorine manufacturing plant did catch fire and leak gases into the air. Laura’s storm surge was predicted to be up to 20 feet, and the warnings used words like “unsurvivable” to try to convince coastal residents to heed the evacuation warnings. It appears that: 1. Most residents did heed the warnings, and 2. Laura’s measured surge did not reach the predicted height at landfall.
NOAA’s water level gauges available on the site: NOAA Tides and Currents - Inundation Dashboard [44]registered close to 10 feet at Calcasieu Pass. There were no operable gauges immediately east 0f the Calcasieu Pass gauge, so the actual maximum storm surge will be determined by analyzing high-water marks using field methods. This will probably reveal higher water levels to the east of the eye of the hurricane. There have been no drowning deaths reported to date, although 14 deaths have been attributed to Laura, with 8 of those due to carbon monoxide poisoning when gas-powered electrical generators were used in closed spaces. An additional 4 deaths were attributed to falling trees. There is no doubt that it could have been worse, but many harrowing tales are emerging. Perhaps the most vivid have been told by the fishermen who stayed with their boats sheltering in the bayous near Lake Charles, connected to Calcasieu Pass. These seasoned watermen feared for their lives and helped each other survive as they watched boats come apart and sink, even as they sat in port. Amazingly, everyone survived. Meanwhile, thousands of families evacuated ahead of the storm, heeding the mandatory evacuation orders.
Due to the COVID-19 pandemic, which has hit Louisiana hard, the state provided a system by which evacuees were provided shelter in hotel rooms, rather than congregate settings of traditional shelters. Baton Rouge and New Orleans were the two main destinations. In New Orleans, evacuees, some arriving by state-chartered buses, and others in private vehicles, had to register at a central location before being assigned a room. Phone and text numbers were made available to obtain information. Electronic message boards on the I-10 entering New Orleans displayed a number to call for assistance. By Monday after Hurricane Laura’s Thursday landfall, all rooms were filled, with more than the 9,000-person capacity in New Orleans having been reached. Other people found shelter with relatives, friends, or found their own accommodation elsewhere.
It is worth noting here that Louisiana’s emergency planning and response has had plenty of practice in recent years. In our case studies, we look at the aftermath of Hurricane Katrina, almost exactly 15 years before Laura. In September 2005, Hurricane Rita also hit the same communities as Laura did 15 years later. Not only have the state, parish, and municipal government Emergency Operation Plans been refined and developed over these years, but the residents of coastal Louisiana have lots of experience in planning and response on a personal and family level. This does not diminish the trauma and hardship felt when displaced from your home, not knowing if it has been destroyed or not.
In addition to helping people get out of the way of a major hurricane, what does the immediate response look like when the state EOP is put into practice? The first step is to mobilize first responders from around the state to perform search and rescue in the affected communities. This includes many units, including fire-fighters, EMS and other medical personnel, and state agencies such as the Department of Wildlife and Fisheries, with boats, aircraft, and helicopters available. On a federal level, the National Guard and the Coast Guard are deployed. In addition, non-governmental organizations including the Red Cross are on the ground to distribute needed supplies to survivors.
Typically, the hurricane leaves large areas without power. This is highly predictable, so power companies deploy personnel before the storm makes landfall and stage thousands of trucks and linemen from within the state and neighboring states to secure electrical lines and begin repairing them as soon as the storm has passed. In addition, other infrastructure such as water supply and sewerage must be repaired before a community is livable again.
Private citizens also participate in the search and rescue operations, with Louisiana’s fleet of private boats pressed into service by the now-famous “Cajun Navy”, who made their debut in 2016 after the devastating floods in Baton Rouge and assisted in Houston after Hurricane Harvey’s floods in 2017. Private citizens can also help by making donations of needed items and money to charities assisting those affected by the storm. The importance of charitable and non-profit organizations at these times cannot be overstated, as it takes time for government funds and relief to be released.
Cultural Norms and Religious Laws
Cultural Norms and Religious Laws
As in the preparedness phase of the emergency management cycle, emergency managers, rescue team members, and medical service providers must be sensitive to the cultural norms and religious laws of the victims to avoid adding further stress during disaster response. For instance, some cultures require unmarried men and women to live separately, so disaster emergency staff could create significant trauma by asking men and women to stay in the same quarters. Emergency workers could also cause stress if they provided pork products to strict Muslim or Orthodox Jewish victims, whose religions strictly forbid the consumption of pork. Racial and ethnic issues might also come into play during disaster response. Emergency shelters also need to be sensitive when sheltering people of different races and ethnicities. In these and other potentially difficult cultural and social circumstances, emergency managers, staff, and volunteers must be ready to coordinate among people with varying backgrounds, needs, and expectations.
Summary: Response
Summary: Response
In sum, all disaster responses require coordination, cooperation, and cultural sensitivity, but the complexity of, and challenges presented by, the response effort increases significantly with the size of the disaster. The case of the 2004 Indian Ocean tsunami – one of the greatest disasters of all time, with an enormous, unprecedented response required of the international community to address a disaster that affected numerous developing countries with varying languages, cultures, religions, and levels of development – demonstrates this complexity. Emergency response policies at all scales need to recognize and account for complexity.
Recovery
Recovery
In the recovery phase of the emergency management cycle, policymakers aim to repair, reconstruct, and restore what has been lost during a disaster. Recovery policies and activities also ideally aim to reduce future vulnerability to natural hazards, so that renewal might result in a physical and socio-economic environment that looks and functions somewhat different when compared to the original community. This is where recovery and mitigation may overlap in the cycle. During recovery, for example, city planning experts may call for rethinking how a community wiped out by a storm surge or tsunami is designed so that it has greater resilience than the original. Rebuilding employing methods designed so that the buildings can better withstand a storm surge – such as elevating the buildings above base flood elevation - would be the simplest example. Moving buildings to a safer location is also an option. There are many other details and considerations that can be incorporated, some of which were discussed in the Managed Retreat and Smart Building modules of the course. Consensus is recently being reached that building back communities exactly as they were is not the wisest path to take.
Funding Recovery
Funding Recovery
Effective recovery requires financial resources, usually in the form of cash or loans. Cash can come from a variety of sources, depending on the context and circumstances of a particular disaster. The local and national governments of affected countries are typically the first source of funds. In some countries, including the U.S., there are funds reserved for disasters but – particularly in poorer countries – funding available from these sources may be insufficient to cover a large disaster or multiple smaller disasters.
Donations of various kinds are a second major source of funds, particularly in major international disasters, such as the 2004 Indian Ocean tsunami or the 2011 Tohoku earthquake and tsunami in Japan. Donations can come from other governments (as in the case of the United States Agency for International Development’s efforts in countries affected by the Indian Ocean tsunami), from non-profit, non-governmental organizations like the International Red Cross/Red Crescent, from direct donations by private citizens and businesses, and from various other sources. Insurance payouts are a third source of funding for recovery.
Individuals and businesses in developed countries are often required by governments and lenders to carry insurance, but insurance is far less common in developing countries. In those countries, loans typically make up the remainder of recovery funds. These loans are often offered by major international financial institutions, particularly the World Bank and the International Monetary Fund. Such loans are sometimes controversial because they usually come with political and economic strings attached that policymakers and citizens of recipient countries dislike. These lending institutions played a major role in financing recovery in nations affected by the Indian Ocean tsunami. In summary, internal government transfers, donations, insurance, and loans typically provide local governments, institutions, emergency managers, and private citizens with needed financial resources to pay for recovery.

Reconstruction of Basic Infrastructure and Buildings
Reconstruction of Basic Infrastructure and Buildings
Tsunamis and storm surges are tremendously destructive to the built environment of coastal communities, and the aftermath is overwhelming as houses and businesses are wrecked and infrastructure is crippled. Restoring basic infrastructure is the first line of business after the water recedes. This includes restoring water, sewerage, roads, electricity, and telecommunications. The funds come from a combination of local government funds, utility company coffers, and state and national government aid. Local government funds rely on property and business tax receipts, but if much of the tax base has been destroyed in the disaster, then sufficient local funds for rebuilding infrastructure cannot be sustained. Consequently, in most cases, funds for the reconstruction of water, sewer, and roads must come from state and national government aid.
The task of rebuilding homes and businesses – all the buildings damaged by the event also must be funded and typically, building reconstruction is funded with a combination of insurance payouts, government aid, and other funds from private and non-profit sources. For private homeowners, this is a very stressful and often expensive process and can take a great deal of time, during which your family may need to be living elsewhere. As we have noted in Module 11, it is a process that proves much easier for people with strong economical means and can be very hard for people who have few resources.
Ideally, rebuilding should not be done in a business-as-usual way, using the same locations and with construction techniques led to damage in the initial disaster. However, meeting higher standards and building in a different, safer location can be expensive. Following a hurricane disaster in the United States, insurance payouts and government aid are contingent on rebuilding houses with hurricane-resistant designs to reduce future hurricane risk. This can include elevating the house to a new level required for insurance coverage and using materials and methods that make the building more resistant to hurricane damage.
After Hurricanes Katrina and Rita in Louisiana in 2005 many homeowners were unable to rebuild to the new standards and had to move to different communities further inland. Communities such as Cameron, Louisiana, which was devastated by Hurricane Laura in 2020 had only 400 residents at the time. The census data show that Cameron’s population diminished by 79% between the years 2000 and 2010 during which it was impacted by Hurricanes Rita and Ike. Another phenomenon is the change in demographics in certain communities over time after multiple storms impact them. For example, Grand Isle, Louisiana, Dauphin Island, Alabama, and other barrier island and beach communities which were home to modest fishing camps and year-round housing prior to the multiple storm events that have occurred over the past few decades, now boast many more very large, expensive structures belonging to wealthy business-people or corporations. They are now often rented for short-term vacations. This trend has changed who can enjoy coastal areas.
The photo below shows a typical elevated, storm surge-resistant house in Charleston, South Carolina. The first floor of the house is designed not for living, but instead for parking, storage, and building access. Special construction designs, like elevated slab and elevated crawlspaces, and use of non-water-sensitive materials, are also important. Eventually, all buildings in storm surge-prone locations of the United States will be replaced by similar surge-resistant designs.


The Complex Nature of Community Recovery
The Complex Nature of Community Recovery
There are many other aspects of recovery besides the reconstruction of infrastructure and buildings. Economic recovery is obviously vital because a strong local economy can help residents recover more quickly than a weak economy. At the same time, social and psychological recovery must be emphasized and not overlooked. Every aspect of peoples’ lives are disrupted by disaster, and many people suffer from psychological issues such as PTSD in post-disaster situations. The stress of the recovery process, including financial strain, separation of families, and other stressors can have very negative effects on a community.
Environmental recovery is also fundamental because the natural environment provides essential ecosystem services, so recovery cannot be complete without a healthy environment. Storm surge can cause severe environmental damage as many spills occur as a result, including overflows of sewerage treatment plants, oil and gas storage facilities, and wells, among others. After Katrina, whole neighborhoods near New Orleans were contaminated with petroleum from a refinery. These types of environmental impacts take a great deal of time to resolve. Additionally, agriculture and fisheries in an area impacted by a storm surge or tsunami can be devastated.
The combination of infrastructure, building, economic, environmental, and social recovery demands input from many stakeholders. For example, building recovery plans require input from local planning departments, homeowner associations, contractors, utility companies, and many others. As a result, it is important to adopt policies that identify stakeholders in building recovery – as well as in economic recovery, environmental recovery, and socio-psychological recovery – and ask them to join with government actors to participate in creating a post-disaster recovery plan during the mitigation phase of the emergency management cycle.
Expanding on these ideas about recovery, a hurricane-related disaster can have tremendous impacts on a local economy. For example, although Hurricane Charley in 2004 brought no significant storm surge, the storm’s category 4 winds severely affected the City of Punta Gorda, Florida. Many of the buildings in the downtown area were destroyed. The unemployment rate for the city rose 2.2 percent in the following month, and it took more than a year for the unemployment rate to return to pre-disaster levels. Thus, coastal disasters are huge drains on local economies and – if the scale of the disaster is big enough, as in the cases of Hurricane Katrina and Superstorm Sandy – on national economies, at least in the short- to medium-term (see case studies).
In the business sector, industries that are affected by a coastal disaster are often specific to the country and locality, but typically include at least some combination of tourism, health care, agriculture, fishing, and manufacturing. In 2020, Hurricane Laura ruined sugar cane and rice crops, killed hundreds of cattle, and sank fishing boats in southwest Louisiana. Farmers and fishermen have a long road to recovery after these types of impacts.
Tsunamis, hurricane storm surge, and other coastal hazards can destroy important tourist and health care infrastructure, including hotels, restaurants, and eldercare facilities. Recovery of the tourism and healthcare sectors is a priority for many coastal local governments. The health care sector is particularly important in many coastal communities of the southern United States, which have a high proportion of elderly residents that have retired from colder climates to warmer beach communities.
Environmental Recovery
Environmental Recovery
The environment provides many services to humans and wildlife, and our lives are intricately linked with our environment. So, when a major disturbance to the environment occurs, such as a tsunami or storm surge, the natural environment – the natural ecosystems - in the affected area can be severely impacted, and the ecosystem services may be destroyed or disrupted. For tsunami and especially hurricane protection, coastal ecosystems like mangroves, barrier islands, wetlands, and coral reefs can absorb and reduce wave energy and water height, thereby protecting the land from erosion, but at the same time, they can sustain heavy damage from the energy of the water. For these and many other reasons, environmental recovery and restoration are important elements of disaster recovery. Some of the examples of environmental restoration after tsunami and storm surge disasters include beach and sand dune restoration, wetland restoration, and water and soil protection, and recovery. Other environmental recovery activities include the restoration of urban forests, habitat recovery for wildlife, and debris recycling.

![By Michael L. Bak [Public domain], via Wikimedia Commons](http://commons.wikimedia.org/wiki/File:Fishing_boats_in_Banda_Aceh_after_2004_tsunami_DD-SD-06-07375.JPEG)
An example of the importance of coastal ecosystem services and the damage caused by hurricane storm surge can be found in Louisiana at the time of Hurricane Katrina. The US Geological Survey estimated that a loss of more than 200 square miles of coastal wetlands was attributed to Katrina’s storm surge in Louisiana, an area representing approximately eight times the annual land loss rate already taking place (remember a football field of land on the Mississippi delta disappears every 100 minutes, so this is a lot of land!). The protection and economic benefits afforded coastal communities in Louisiana by these fragile and rapidly declining ecosystems were already well documented and recognized by the state. Following Katrina’s devastation, the state stepped up its existing coastal restoration program, creating a new State Coastal Master Plan and a new state agency to oversee and monitor restoration activities. As a result of devoting a new level of human and monetary resources, today Louisiana is a world leader in the science and engineering of coastal restoration and protection.

Other forms of environmental damage that must be remediated after a disaster include spills and other kinds of pollution resulting from the destructive forces of tsunamis and storm surges. The article The Indian Ocean Tsunami and its Environmental Impacts [48] outlines environmental impacts from the 2004 tsunami.
Psychological and Social Recovery
Psychological and Social Recovery
Finally, recovery is not complete without psychological and social recovery. After a disaster, many people suffer from post-traumatic stress disorder or PTSD. Among other symptoms, people with disaster-related PTSD can relive the hazard event repeatedly, feel in danger constantly, have difficulty sleeping, and refuse to return to places associated with the disaster. Victims’ psychological well-being and social life can therefore be severely affected by PTSD. As a result, PTSD and other psychological conditions of victims must be addressed as part of recovery. Social recovery is critical, too. Loss of jobs can lead to migration away from a community, and deaths of key community figures can change social dynamics. Although there is little that responsible organizations can do to directly influence these outcomes, it is important to be aware of these impacts in recovery efforts. Cultural recovery efforts, such as the rebuilding of religious landmarks and institutions, also improve the overall recovery.
Summary: Recovery
Summary: Recovery
In conclusion, it is important to note that the recovery period provides governments and emergency managers with a special opportunity to develop a more disaster-resilient society. Many of the older buildings with dated building codes and outmoded infrastructure have been destroyed, and people have become more aware of the risks associated with natural hazards. Thus, policies that mitigate by updating building codes, replacing obsolete infrastructure, and developing hazard-conscious land-use plans in the recovery phase will face fewer obstacles. At the same time, families will be more willing to mitigate by purchasing insurance and engaging in household preparedness activities.
Learning Check Point
Learning Check Point
Please take a few minutes to think about what you just learned then answer the questions below.
Case Study: Sumatra and Thailand and the 2004 Tsunami
Case Study: Sumatra and Thailand and the 2004 Tsunami
The Importance of Tsunami Warning Systems and the challenges of warning communication.
Think back to the video you watched in Module 7 – which included scenes of the 2004 tsunami event in Indonesia. The beginning of the video focused on the Banda Aceh area of Sumatra, where fishing communities and small coastal cities were completely destroyed, and the end of the video featured the Phuket area, where more tourist beaches were affected.
Through your reading and watching the videos, you hopefully gained an idea of what it is like to be caught in a tsunami with no advanced warning, and how frantic the attempts to get out of the way must be. Imagine what it would be like to try to move small children, sick or elderly people out of the way of a tsunami with before the wave strikes and with no time to spare!
In Module 7, the events in Phuket, Thailand, are described, with tourists enjoying their vacation on the beach at Christmas 2004. Many are oblivious to the dangers of the approaching tsunami. What could have been done differently? If this were to happen again, would these communities be better informed and prepared?
In Module 7 we also mentioned that early warning systems are very tricky because of the challenges of getting the message out soon enough after the earthquake and before the tsunami waves arrive at a particular shoreline. For example, the towns on the west coast of Sumatra are so close to the Andaman fault that they had almost no time to react, so a warning may not have worked, regardless of how well it was transmitted. Banda Aceh, on the northern tip of Sumatra, was devastated in 2004 because people did not have time to react, while there is evidence that some small nearby island communities fared better where traditional knowledge of the natural warning signs such as the sudden receding of the tidal waters was employed, and residents were able to flee to higher ground. Meanwhile, the tourist destinations of Phuket and Phi Phi, and nearby locations in Thailand had 2 hours, but the warnings were lacking. Visitors lacked necessary knowledge of nature’s warning signs and how to react, and may not have felt the earthquake, so many lives were lost.
In response to the enormous loss of life in the 2004 Indian Ocean tsunami, the Global Tsunami Warning and Mitigation System was put in place. The Indian Ocean tsunami warning system now integrates the signals from seismographs and DART Buoys and transmits data to 26 national centers. Warnings at the local level are generated in the form of SMS messages, mosque loudspeakers, sirens, and other methods to warn citizens. How well the warnings translate into lives saved due to rapid response and appropriate behaviors by the citizens depends on each step working properly. The failure of one of the steps can lead to disaster. If the citizens do not have the knowledge needed to take effective action, then the process will not work, and lives will be lost.
In 2012 another earthquake occurred near Banda Aceh in the Indian Ocean, so the newly implemented warning systems were put to the test. In this case, no tsunami was generated by the earthquake, but unfortunately, the weaknesses in the system were revealed. Despite the efforts expended to increase levels of tsunami preparedness since 2004, including new tsunami evacuation shelters and education programs, chaos ensued. Hearing the tsunami warning, people panicked and tried to flee by car, resulting in gridlock on the roads. It was clear that better guidance from the local government was needed, including clear evacuation route signage and regular drills. For more detail on this topic, read the National Geographic article Will Indonesia Be Ready for the Next Tsunami? [6] Clearly, more work is still needed and ongoing to address these weaknesses.
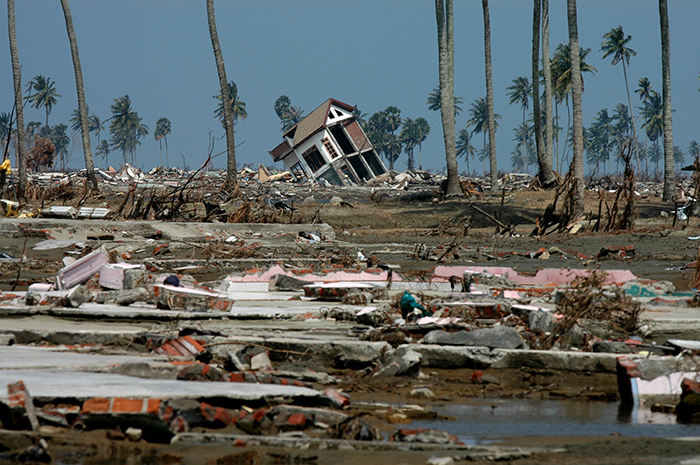

Learning Check Point
We will spend a few minutes also revisiting the accounts of historic tsunami events – in particular, the 1960 event and its effects in Chile and Hilo, Hawaii, and the important messages about how to survive a tsunami. Please re-read some of the accounts of survival during tsunami events in Heed Natural Warnings [51].
Case Study: Puerto Rico and Hurricane Maria
Case Study: Puerto Rico and Hurricane Maria
Differential response and recovery times across U.S. communities hit by 2017 storms
The 2017 Atlantic hurricane season went down in history as having the most named storms since 2005. In 2005 there were 28 named storms and 15 of them becoming hurricanes, while in 2017 there were 17 named storms and 10 of these became hurricanes. The three most notable out of these storms – Harvey (landfall on August 25 in Texas), Irma (Landfall September 10 in Florida) and Maria, (Landfall on September 20 in Puerto Rico) followed in close succession and broke records for their intensity in the places they impacted.
The U.S. federal government, represented by FEMA, responded by supplying funds, aid, supplies, and personnel following the storm impacts in each of these places, but there were many concerns raised about the disparity in response after Maria in Puerto Rico, a U.S. territory, compared to the mainland states impacted by Irma and Harvey. So, what really happened following Hurricane Maria in Puerto Rico? Were the Puerto Rican people, who are American citizens, neglected by the federal government following this major natural disaster? Let’s take a closer look at the impacts of and responses to Hurricane Maria in Puerto Rico.Maria achieved its peak intensity over the eastern Caribbean and made landfall in Yabucao, southeastern Puerto Rico as a strong category 4 storm, where winds of 175 mph (280 km/h) were recorded. It was the first Category 4 hurricane to directly impact the island in 85 years, and it caused widespread damage that was felt for months, if not years.
Prior to Maria’s landfall, hundreds of shelters were set up, and evacuation orders were given. An uptick in travel from the island just before the storm was indicative of the numbers of people fleeing to the U.S. mainland to stay with family.
Compounding the impacts of Maria on the island was the damage from Category 5 Hurricane Irma just 2 weeks prior, especially to the electrical grid, which was crippled by Maria, leaving all 3.4 million residents without electricity for an extended period. Six months after the storm, many were still without power and had not been able to repair their houses. In fact, the combined impacts of hurricanes Irma and Maria resulted in Puerto Rico Electrical Power Authority (PREPA) filing for bankruptcy. Imagine all the functions that are impossible without power, besides the misery of living in a tropical climate without any means to refrigerate food or enjoy air-conditioning. All means of modern communication are impossible because cell phone towers are one of the first things to be destroyed by the high winds of a major storm.
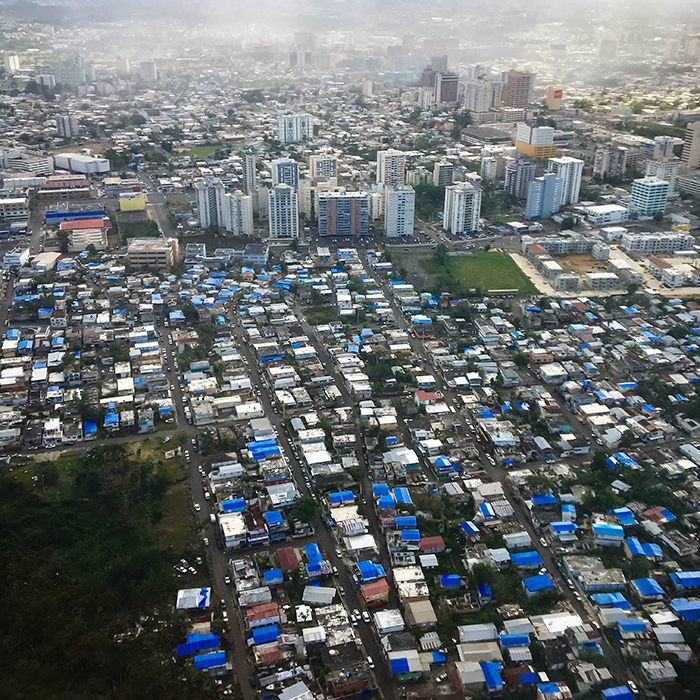
The number of people killed by Hurricane Maria proved challenging to count. An initial number of 65 deaths directly attributable to the storm was officially recorded by the federal government. This number did not account for those whose deaths were from indirect causes linked to the hurricane, due to deprivation caused by things like lack of power and medical services and a multitude of other causes during the response and recovery phases. Six months after Maria’s landfall, an estimate of 2,975 indirect deaths was made by examining the mortality rate for that time period compared to the same period during previous years. The sensitive populations – the elderly, the very young, and the sick - suffer the most in the immediate aftermath of a disaster like a hurricane, and it is among these groups that the most deaths occurred in Maria.
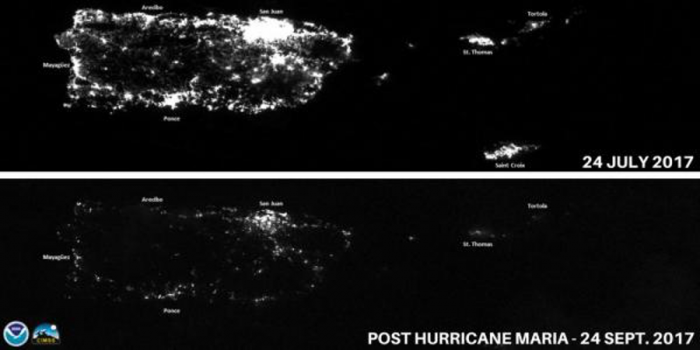
Residents of the U.S. territory were able to apply for aid through FEMA, but reports indicated that supplies moved slowly to destinations, hampering recovery. In November 2017, two months after the storm, 60% were still without power and perhaps 20% without water, so that many had to collect water from streams and rainwater. Many stories in the media at the six-month mark highlighted the misery of a slow recovery. There was a lack of adequate infrastructure repair, medical services, and the simple availability of supplies throughout this time, although many charity organizations supported the effort.
An objective study by BMJ Global Health: Quantifying inequities in US federal response to hurricane disaster in Texas and Florida compared with Puerto Rico [54], investigated the question of whether the federal response to Hurricane Maria in Puerto Rico was significantly smaller and slower than the responses to Hurricane Irma in Florida and Hurricane Harvey in Texas. Their conclusion was that the response to Maria was indeed lacking and did not align with the storm severity or the needs of the affected communities. They note that “Increases in mortality and adverse health outcomes due to differentiated disaster response and recovery efforts may promote inequity among populations that receive less aid.” In other words, Puerto Rico did not receive the same level of aid as Texas and Florida after Harvey and Irma respectively, and the people of Puerto Rico suffered as a result. They go on to suggest reasons for this in this way: “There may be many different reasons why the federal response varied in each case. Ability to access the affected area based on geography and distance, existing infrastructure aiding or acting as barriers to response efforts, disaster fatigue, as well as issues of racial bias and perceptions of differential citizenship all may have affected the appropriation and delivery of resources and funding to affected areas in each hurricane. Different mechanisms for the varied responses may be more or less justified. However, what cannot be contested is that the responses were in fact different across critical time points, and these differences have serious consequences for acute and long-term health outcomes and recovery efforts.”
The data in the report clearly show a disparity in the amount of aid received and the time taken for aid to be received. This article highlights the critical nature of getting aid to its target in a timely manner. Slow responses lead to serious negative outcomes, as Puerto Rican residents can attest. Be sure to read Echoes of Katrina: Post-Maria Public Health Threats and Trauma [3].
Case Study: New Orleans and Katrina
Case Study: New Orleans and Katrina
Katrina in New Orleans - Economic Recovery Case Study
Hurricane Katrina in 2005 was a precursor to many similar events to come, and has become a yardstick by which to measure other storms impacting the U.S. since then. Katrina was and still is the deadliest and costliest storm to make landfall in the United States in 100 years. Hurricanes Harvey and Maria follow closely behind in costs and loss of life. Katrina impacted coastal communities in five Gulf Coast states - Florida, Alabama, Mississippi, Louisiana, and Texas. The greatest impacts were felt in Louisiana and Mississippi, while the greatest media attention focused on New Orleans. Katrina’s death toll was approximately 1,500 in Louisiana alone. The economic impacts were complex and enormous. If measured by insurance claims alone, the disaster generated more than 1.7 million claims across six states, to a total of more than $40 billion. Estimates of the overall economic impact of the storm in the Gulf states put the damage at approximately $200 billion!
The New Orleans economy is based on three main sectors: tourism, port operations, and educational services (Monthly Labor Review, 2007). All these sectors were essentially shut down after the storm for several months, and up to years in some cases. Many operations did not fully recover until a full year after the storm. The University of New Orleans and all other schools were closed except for online learning for the fall semester or longer. The Port of New Orleans is essential to the nation, as the Port of South Louisiana (of which New Orleans port is a component) handles the most bulk tonnage of any port in the world. About 5,000 ships from nearly 60 countries dock at the Port of New Orleans each year (Monthly Labor Review, 2007). The tourism service industry, for which New Orleans is best known, is the major employer in the city and, of course, that was also shut down for many months after Katrina. So, as well as being displaced, many New Orleans residents lost their source of income until the city could recover sufficiently, which took years.
These examples do not tell the whole story of a complex natural disaster such as Hurricane Katrina. Some have described it as a man-made disaster because of the failure of the flood control system surrounding the city of New Orleans, much of which sits at below sea level elevations. Meanwhile, a short distance away, unprotected coastal communities on the Louisiana and Mississippi coasts were also devastated. Some areas were never rebuilt, but most have been rebuilt, and this rebuilding has been a complex process driven by economic resources. Insurance payments; federally funded programs such as the Road Home Program, as well as people, organizations, and companies willing to invest in rebuilding the city all contributed to the patchwork of means by which the region recovered, house by house, neighborhood by neighborhood.
View the following image: a summary of the changes in population in the Greater New Orleans area in the eight years following Hurricane Katrina from The Times-Picayune.
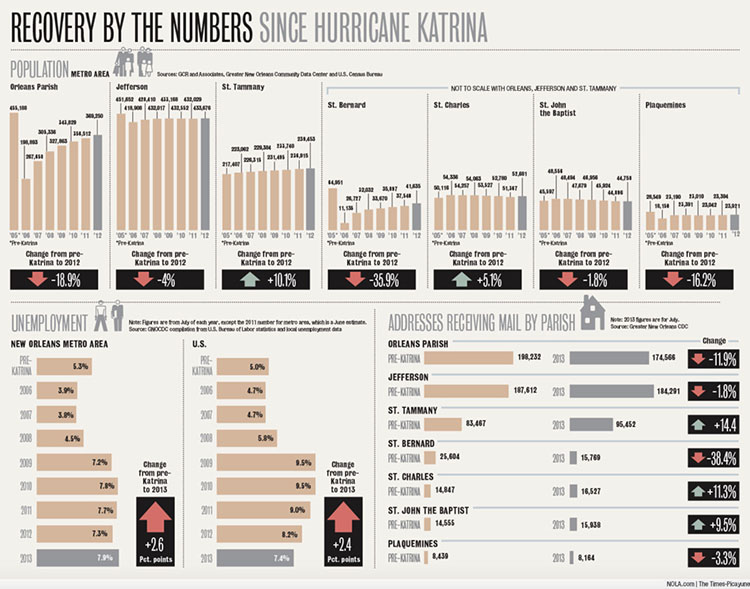
Longer-term Recovery and Mitigation Experiences for a Socially Vulnerable Community
Longer-term Recovery and Mitigation Experiences for a Socially Vulnerable Community
The response to Katrina was inadequate and in retrospect revealed a need for improvements to all levels of emergency planning – from evacuation to caring for the vulnerable, to providing for equitable recovery – and more. Today we look back on Katrina as an example of poor disaster planning and New Orleans as a city with very low adaptive capacity at the time. Why was the response so poor, and how have things changed since then? Is the Gulf Coast and New Orleans in particular, better prepared for a major storm, and has it increased its adaptive capacity? In other words, have each component of the emergency management cycle – mitigation, preparation, response, and recovery been addressed to ensure another "Katrina experience" does not happen?
Immediately after Katrina broke the flood defenses of the city, with 80% of the city underwater and a crippled infrastructure, New Orleans had to be completely evacuated. Those who could not or did not evacuate ahead of the storm were temporarily trapped in a hellish scenario for days before an organized response could evacuate everyone. People were gathered at the New Orleans Superdome, Convention Center, and New Orleans International Airport where conditions were deplorable. Triage and evacuation centers were set up in locations that were above water in the flooded city and those rescued from the flood were processed and transported out. It was a chaotic and sometimes violent situation. The temperatures were in the 90’s Fahrenheit and there was no power at all. There was a deep level of suffering and trauma as families were separated and individuals sent far away from home to places where they had no family or friends. Many older people who were in poor health succumbed to the heat, lack of food and water, and extremely poor sanitation. Many did not know the fate of their family members and communication was almost impossible with all cell towers having been toppled. It was obvious to even a casual observer that the majority of the stranded citizens were disadvantaged by poverty and most were African American.
The introductory video in Module 11 showed some of the immediate aftermath of Katrina.

Even though the flood itself affected 80% of the city in a way that crossed socio-economic boundaries and did not discriminate, some of the lowest-lying areas were also the areas where there was more poverty so that the disadvantaged residents of the city were significantly more likely to be displaced by the flooding than those with greater wealth.
A great deal of attention was given by the press to the poor, predominantly African American neighborhood of New Orleans, the Lower Ninth Ward. This area was flooded by a break in the floodwall of the Inner Harbor (Industrial) Canal, a shipping canal that cuts through the heart of the city and at that time (incredibly) was directly connected to the Gulf of Mexico via the Intracoastal Waterway and The Mississippi River Gulf Outlet and Lake Borgne. The flood wall was broken by the force of the water, and a loose barge pushed its way through. Water poured through the break, washing houses off their foundations, and drowning many residents. To this day, fifteen years after Katrina, many blocks of this neighborhood still sit vacant after houses had to be demolished and families were unable to return and rebuild. This is even with organizations such as Brad Pitt’s Make it Right Foundation pouring money into rebuilding and trying to “make it right” for the local residents. This can be considered a forced relocation by a natural disaster.
It was the aftermath of the flood and the recovery process that really shone a spotlight on the disparity of fortune. The suffering did not end when the floodwaters were finally pumped out of the saucer-shaped city, against the force of gravity - this “dewatering” took most of the month after the flood. Nobody could return until the infrastructure – power, water, sewage, etc. was functioning well enough to make it minimally livable, and as the city slowly reopened, people who could return found their houses completely wrecked and their neighborhoods almost unrecognizable. Those lacking financial resources, could not get back to the city for months or even more than a year. Families had to find ways of making a living wherever they had landed after the flood. People with stronger financial resources were able to return and take care of the myriad tasks of recovery much more easily than those in poverty. This and other factors and financial obstacles meant that it was the wealthier neighborhoods that were rebuilt more quickly than the poorer neighborhoods.
Please watch this 9.54 minute CBS Sunday Morning video: “New Orleans After Katrina: A Tale of Two Cities” that examines the inequity of the rebuilding process in which it is mentioned that black homeowners were more than 3 times more likely than white homeowners to have lost their home in the flooding and that the Road Home Program, the state’s policy for funding rebuilding through grants to homeowners, was found to be discriminatory. The flaw in the policy was that it used the home’s value before the storm to determine the amount the homeowner received. So, the homes of much lower value in poorer, predominantly black neighborhoods such as the Lower Ninth Ward, were eligible for significantly less funding for rebuilding, failing to meet rebuilding costs.
Video: New Orleans after Katrina: A tale of two cities (9:54)

Geographer Richard Campanella, in his book Geographies of New Orleans, addresses the question, were poor, black neighborhoods impacted by flooding more than more affluent white neighborhoods, due to the fact that the poor tend to occupy the lower, less desirable land areas? His analysis showed, through mapping the demographics and the levels of flooding together, that the answer is more complex than you may expect. He looked at the distribution of ethnic groups, distribution of flooded land, and the length of time an area remained flooded after Katrina. If only the city of New Orleans itself is considered (and not the suburbs), his data shows that the pre-Katrina population consisted of 67% African American and 28% white, while 76% of persistently flooded properties were of African American families, 20% were of white families. So African American neighborhoods did suffer greater persistent flooding. The maps below illustrate the complex nature of the distribution of social vulnerability in relation to the more intense flooding. The neighborhoods of Gentilly, New Orleans East, the Lower 9th ward, Chalmette, and Lakeview experienced the deepest floodwaters. The distribution of wealth and poverty in these communities is complex, with New Orleans East, the Lower 9th Ward, and Gentilly being predominantly black neighborhoods, while Lakeview is an affluent, mostly white part of the city. Chalmette is a mostly white suburb of mixed-income.


So, in summary, Hurricane Katrina negatively affected the poorer citizens of the city, who were represented heavily by the African American community, more than the affluent members of the community. The poor are the most vulnerable citizens due to their sensitivity. They are also the least resilient, having lower levels of adaptive capacity, due almost entirely to a lack of financial resources. Without the incredible generosity of non-profit and non-governmental organizations, faith-based groups, and volunteers, many people would never have been able to return home. In addition, insurance payments, various federally funded programs such as the Road Home Program, and the migration to the area of people and companies willing to invest in rebuilding all contributed to the recovery of New Orleans house by house, neighborhood by neighborhood.
Would New Orleans fare better if another “Katrina” hit the city? Many improvements have been made. Preparedness and response, including evacuation plans with transportation for those without a vehicle, and response plans are all greatly improved. The city’s overall adaptive capacity and resilience have made strides and the economy of the city has stabilized, but poverty is still a major problem for the city. The system of engineering structures, designed to protect the city from a surge from - up to category 3 level “100-year" (1% chance in a given year) storm, has been rebuilt and greatly improved. But projections indicate that this system will deteriorate over time and it is very expensive to maintain. New Orleans may be in a good position at this time if a category 3 hurricane were to hit the city. But there are too many variables to say for sure what the outcomes would be in terms of long-term recovery in the future or for a larger storm. For example, an event with precipitation of the magnitude of Hurricane Harvey would quite likely prove to be equally devastating to New Orleans as Katrina.
New Orleans - One Decade of Recovery: 2005 - 2015
New Orleans - One Decade of Recovery: 2005 - 2015
What has happened since Katrina?
The process of recovery from a major disaster such as the flooding of New Orleans by Hurricane Katrina is long and complex. Today, the city functions normally again, bearing scars in the form of hundreds of large empty lots, a smaller population, and many examples of increased resilience. Lessons can and should be learned and applied to other disasters, such as Houston's flooding in 2017 by Hurricane Harvey.
The article, Building Back the Big Easy: Lessons from New Orleans’ Recovery from Hurricane Katrina [58], provides an overview of the changes that have taken place in the city of New Orleans through the eyes of an outside observer with a background in urban resilience and disaster risk management. Artessa Saldivar-Sali is a Resilience Engineering Specialist, World Bank. The article outlines several aspects of the recovery process, including the rebuilding of neighborhoods worst hit by the flooding, and repairs to the vital infrastructure that drives the economy. It also points to the changes in disaster management and the improvements in the flood defenses surrounding the city, including a surge barrier that is the largest of its kind in the world, and raising of the 133 miles of levees that surround the entire city.
Shortly after Hurricane Katrina, there was much debate about the wisdom of rebuilding New Orleans and the vision of what New Orleans would look like ten or twenty years later was elusive. The article, New Orleans, Louisiana Population 2020 [59], from the World Population Review website, examines the demographic changes in the decade following Katrina. It outlines the steady growth in population since Hurricane Katrina literally emptied the city of every single resident and killed 1,500 in southern Louisiana. In 2006, the population was only 223,000, down from the 2000 census level of 484,000. In the decade following, the population steadily grew back to a level of 343,800 in 2010 and 391,495 in 2016.
When Hurricane Isaac approached New Orleans in 2012, the city’s residents were advised not to evacuate as the repairs to the hurricane protection system were complete. This was sound advice at that time and for that particular storm, which flooded communities on the outside of the levees. For those who know New Orleans now, with its rebuilt levees, rising housing prices, and seeming amnesia – reminders about the struggle to rebuild are important. It may also be helpful to keep an awareness of the continued vulnerability of the lowest-lying city in the U.S. and most of the world.

Learning Check Point
Houston, Harvey, and Flood Policy
Houston, Harvey, and Flood Policy
Houston’s topography and geography make it a very flood-prone city, as much of it sits in a sprawling floodplain. A glance at a map of Houston reveals a network of waterways – bayous - connected to the tidal water of Trinity and Galveston Bays. As the Washington Post video linked below explains, Houston is more at risk for rainfall and runoff flooding than storm surge flooding from the Gulf of Mexico, although the latter is not out of the question. The other factor that makes Houston vulnerable to flooding is its urban sprawl. The Houston Metropolitan area has more than 6 million residents, and its population is increasing. It has seen a six-fold increase in population since 1960. The lack of comprehensive planning and zoning during those decades has led to a loss of natural, permeable surfaces and a growing propensity for flooded neighborhoods. As the video mentions, the bayous can serve to conduct water away from built areas and help reduce flooding, but they can also back up and overflow when a storm like Harvey occurs. Hurricane Harvey hit the eastern Texas Gulf coast as a category 4 storm, devastating coastal communities such as Rockport, to the west of Galveston. However, the storm is much better known for the rainfall it dumped on the greater Houston area and southwestern Louisiana. Many communities, including Houston, received more than 40 inches of rain in four days (isolated locations received over 60 inches) and the damages amounted to $125 billion. Many lives were lost in the flooding, which displaced 30,000 people, flooded hundreds of thousands of homes, and closed Interstate 10, which is the main route for commerce across the southern United States.
Please watch the Washington Post video, Here's why Houston is flooding so badly [60] (3:19)
Houston has experienced three “500-year floods” between 2015 and 2017. A 500-year flood is NOT a flood that is expected to occur every 500 years, in spite of its misleading name. It is, in fact, a flood that has a one in 500 or 0.2% chance of occurring in any particular year. So, it is possible to experience a flood of this magnitude two years in a row. However, these types of floods have been occurring more frequently along the Gulf Coast in the past decade.


Prior to Harvey, Houston’s building codes required new construction and renovated buildings to be elevated above the “100-year” floodplain” – or the areas susceptible to floods that have a 1% chance of occurring in any given year (or 100-year floods).
After Harvey, the city of Houston and surrounding Harris County enacted new ordinances under which any building under construction or re-construction, must be raised two feet above the 500-year flood plain. This is an expensive undertaking, but the city and county leaders are taking a proactive approach in putting an improved policy in place that will avoid putting people and their property back in harm’s way after each flood. The Mayor of Houston, Sylvester Turner, notes that although some oppose the new rules due to the increased costs of construction, it is essential to the future prosperity of the city and will save lives. According to the FEMA website, many homes that flooded in Harvey met the minimum FEMA requirements and were not required to have flood insurance, but a Houston Public Works study shows that if the new rules had been in place at the time, 84% of the homes that were flooded by Harvey’s rainfall would have been covered.
The new rule is explained in the ABC News video Houston's New Building Codes [61].
If we look at Hurricane Harvey Recovery: A Progress Report [62], it is clear that the plan includes policy and legislation addressing mitigation and resilience so that going forward, disasters like the flooding following Harvey are not repeated. These planning documents offer a valuable guide for other cities facing recovery.
After Hurricane Harvey, homeowners could apply for rebuilding assistance through the city of Houston’s Harvey Homeowner Assistance Program. Other forms of assistance were found through non-governmental organizations such as the non-profit Saint Bernard Project, which was created to assist in rebuilding after Hurricane Katrina. Post-disaster recovery often involves a patchwork of government, non-government, and corporate partnerships, and a lot of community volunteers.
Harrison County residents (including the city of Houston) have access to a valuable interactive mapping tool for determining the flood potential for a neighborhood: Harris County Flood Education Mapping Tool [63] The map provides color-coded spatial information based on the 1% and 0.2% flood zones.
Learning Check Point
Module 12 Lab
Module 12 Lab
Objectives
-
Analyze FEMA Flood Insurance Rate Maps (FIRM) for a coastal area in Hanover County, NC., near Wilmington, to gain an understanding of the various coastal flood zones and their relationships to coastal hazard mitigation.
-
Use evidence to consider the future of flood mitigation and insurance measures in coastal areas such as New Hanover County.
Background
Please revisit The National Flood Insurance Policy (NFIP) page in Module 12, which provides general background on the National Flood Insurance Program (NFIP).
The National Flood Insurance Program (NFIP): Historically, the NFIP has provided affordable flood insurance policies to homeowners through government subsidies. As we discussed in Module 12, the NFIP in its current state is deeply in debt and unsustainable after the past two decades of extreme weather, including more frequent hurricanes and river floods. To try to address this problem, FEMA is in the process of updating the NFIP to make it more equitable (to assess properties based on their true flood risk) by rolling out the Risk Rating System 2.0. The goal is to “enable FEMA to deliver rates that are actuarily sound, equitable, easier to understand, and better reflect a property’s flood risk”. The overhaul in the process now is designed to help address some of the issues with the NFIP. Flood insurance premiums will increase for properties that are at high risk of flooding.
You can read about these changes at FEMA: Risk Rating 2.0 Equity in Action [64].
Flood Insurance Rate Maps are used to determine a property’s flood insurance. A potential homeowner can access these maps before deciding to purchase property in a flood zone. The maps are also designed to help residents of coastal communities plan for and mitigate the flood risk to their properties by delineating flood zones and identifying Base Flood Elevations.
The FIRM zones are based on elevation and proximity to water, as well as several other factors that determine a property’s risk of flooding. Visit this site to read about the flood zones shown on a Flood Insurance Rate Map (FIRM) [65]. For this lab, you will need to know about Zones AE, VE, and X. The information you will need is in this link.
Briefly, the BFE is the calculated height to which a location statistically has a 1% annual chance of being flooded. A 1% annual chance flood is sometimes called a 100-year flood, but this is misleading because a flood of this type could happen in any given year. A house must be built at or above the BFE to be eligible for flood insurance. Adding extra height further reduces the rate. The Flood Insurance Rate Maps (FIRM) show the Base Flood Elevation for each zone on the map.
To be covered by flood insurance under the NFIP a house must be built at an elevation at or above the BFE for the location. For example, if the FIRM indicates a BFE of 14ft, the first living floor must be at or above 14 ft above the base water level (as determined by FEMA) to receive affordable insurance. The insurance rate is calculated using this and other metrics. By employing additional mitigation measures such as elevating heating and cooling systems and other infrastructure, a homeowner can reduce their flood insurance premiums.
Instructions
- Go to FEMA Flood Map Service Center [66] [25]
- In the search bar, enter “New Hanover County, NC”. This will take you to the coastal area near Wilmington. Note the coded zones on the map and the legend below the map. Now click on the “Go to NFHL Viewer button”. We will zoom in on a couple of neighborhoods to analyze the flood zones. Enter the following address: 912 Tarpon Drive, Wilmington. Note the flood zone that the property is in. Now search 7101 Grouper Ct., Wilmington. Note which zone this property is in. What is the Base Flood Elevation (BFE) shown for each location?
- Open Google Earth Pro and use the search bar to find the same properties you just found on the flood map. Zoom in to less than 500 ft. eye altitude to make a note of the following measurements: The distance between the two properties; The elevation at the driveway of each of the properties. Note the amenities that these two properties have in terms of water access. Which property has direct water access? Which property has a higher flood risk? If you zoom out to at least 13,000 ft., can you identify any natural features that would protect these two properties in the event of a storm surge?
- Zoom to an eye altitude of less than 500 ft. Go to street view at each of the properties. What flood mitigation measures can you identify by looking at the two houses? Based on all of your observations using the FIRM and Google Earth, which property is likely to have a higher rate of insurance?
- Return to the Flood Map (FIRM) and look at the zone to the east of Grouper Court. This is a CBRS Area. Google this term. What does this mean?
- Now we will examine a nearby community and check out two more properties for comparison. On the NFHL Viewer search for 1203 Carolina Beach Ave N. Find its flood zone and BFE. Note: its elevation and other details of its construction.
- Compare this property with the one directly across the street (1202 Carolina Beach Ave. N.) Find its flood zone and BFE. Note its elevation and other details of its construction. What stands out regarding the differences between these two properties. Which is the newer property? Explain why the newer one is built differently.
- Use Google Earth Pro or Google Maps to analyze the elevation of the land where these properties sit. Is there any feature protecting them from a storm surge from the Atlantic Ocean?
- What factors would have been considered in the newer property’s design and construction – based on what you know about flood mitigation and insurance?
- Based on your knowledge of the NFIP and the changes currently in progress, if there was a major hurricane this year with a storm surge of 15 ft (or more), what would you expect to observe for these two properties? Which of these two properties is more likely to receive insurance funds to be rebuilt after the storm? Explain.
Lab Questions
- Match Flood Zone descriptions with flood zone designations: Zones AE, VE, and X.
- Areas along coasts are subject to inundation by the 1-percent-annual-chance flood event with additional hazards due to storm-induced velocity wave action. BFEs derived from detailed hydraulic coastal analyses are shown within these zones.
- Areas subject to inundation by the 1-percent-annual-chance flood event are determined by detailed methods. BFEs are shown within these zones.
- Minimal risk areas outside the 1-percent and .2-percent-annual-chance floodplains. No BFEs or base flood depths are shown within these zones.
- Currently, the NFIP is being modified. It is considered flawed in its original form because:
- It is too expensive.
- It has encouraged building in flood-prone areas because of its affordability
- It is in debt to the federal government and is unsustainable in its present form
- B and C are true.
- Of the possible outcomes of the NFIP changes, which one is NOT likely?
- It will increase flood insurance costs for most homeowners
- It will be based on a more accurate flood risk assessment and therefore more equitable
- It will fuel increased building in coastal hazard zones
- All of these are likely.
- Of the first two properties, you compared, which one is likely to have a higher flood insurance premium?
- Grouper Court because it is built at a significantly lower elevation than the Tarpon Drive property.
- Tarpon Drive because it is closer to the shoreline than the Grouper Court property.
- Grouper Court because it is in a higher risk flood zone than the Tarpon Drive property.
- There would be no difference in their flood insurance premiums.
- What is the purpose of a CBRS Area and in what way does this benefit the homeowners in the neighborhood we analyzed in question 4? (2 points)
____________________________________________
- Of 1203 and 1202 Carolina Beach Ave. N., which is the newer property? What evidence backs up your assertion? Explain why the newer one is built differently. What factors would have been considered in the newer property’s design and construction – based on what you know about flood mitigation and insurance? (5 points)
- Based on your knowledge of coastal geomorphology, the NFIP, and the changes currently in progress, if a major hurricane hit Carolina Beach this year with a storm surge of 15 ft, what would you expect to observe for 1202 and 1203 Carolina Beach Ave. N? Does any natural or man-made feature protect the properties? Which of these two properties is more likely to receive NFIP insurance funds for rebuilding after the storm? Provide evidence to back up your claim. (5 points)
Summary and Final Tasks
Summary and Final Tasks
Summary
In this module, you have learned about how policies in the four stages of the emergency management cycle can reduce coastal zone residents’ vulnerability to tsunamis and hurricane storm surge hazards. Tsunamis and hurricanes are short-term coastal hazards: that is, people learn of the occurrence of these two hazards only days, hours, or even minutes before impact, and they exist only for a short period. But coastal residents also face chronic, long-term hazards. Among these, sea level rise is one of the long-term coastal hazards that some governments and people are inadequately prepared to face. In the next module, you will learn about how policies can mitigate vulnerability to sea level rise.
Reminder - Complete all of the Module 12 tasks!
You have reached the end of Module 12! Double-check the to-do list in the Module 12 Roadmap to make sure you have completed all of the activities listed there before you begin Module 13.
References and Further Reading
- Center for American Progress, 2018, Echoes of Katrina: Post-Hurricane Maria Public Health Threats and Trauma [3]
- Willison CE, Singer PM, Creary MS, et al. Quantifying inequities in US federal response to hurricane disaster in Texas and Florida compared with Puerto Rico [54]. BMJ Global Health 2019;4:e001191. doi:10.1136/ bmjgh-2018-001191.
- The Heritage Foundation, 2013, After Hurricane Sandy: Time to Learn and Implement the Lessons in Preparedness, Response, and Resilience [67]
- Campanella, Richard, 2006, Geographies of New Orleans
- The City of Houston, TX, 2019, Hurricane Harvey: A Progress Report [68]