Module 5: Dam it All!
Module 5: Dam it All!
Introduction
In the preceding modules, we’ve discussed the uneven distribution of precipitation and water resources on Earth’s surface (Modules 1-2), and the dynamics of rivers and streams as the primary conduits for the return of water that falls over the continents to the oceans (Modules 3-4). One fundamental challenge to populations is that precipitation does not fall where we need it when we need it. This is amplified by the fact that many population centers are located in areas that are perennially dry, including those in the US Southwest.
How do we store water delivered by rivers to provide reliable and secure supply when we need it, where we need it, and tame the flow in abnormally wet conditions to mitigate flooding? The main solution is to dam rivers and fill the reservoirs behind them. This stores large volumes of water that ensure a stable supply, the reservoirs act as “capacitors” in the hydrologic system to absorb excess flow and thus prevent flooding downstream, and the dams simultaneously produce electric power as water is released in a steady, controlled discharge from the reservoir. However, dams and their reservoirs also profoundly impact the natural river system and can cause irreversible changes to the environment and to populations both near the dam and far up- and down-stream. In Module 5, we will explore the benefits and consequences of construction and removal of large dams, both in the US and globally, including a discussion of case studies along the Yangtze and Nile rivers.
Goals and Objectives
Goals and Objectives
Goals
- Describe the two-way relationship between water resources and human society
- Explain the distribution and dynamics of water at the surface and in the subsurface of the Earth
- Synthesize data and information from multiple reliable sources
- Identify strategies and best practices to decrease water stress and increase water quality
- Thoughtfully evaluate information and policy statements regarding the current and future predicted state of water resources
- Communicate scientific information in terms that can be understood by the general public
Learning Objectives
In completing this module, you will:
- Weigh the advantages and drawbacks of large dams, including economic, environmental, and cultural impacts
- Explain the reasons why dams are built, and the rationale for removing them
- Assess whether government agencies should be responsible for regulating new dam construction
- Debate whether a dam is the most appropriate solution to water needs and flood control in a particular location
Introduction to Dams
Introduction to Dams
Think about your impressions of dams and the reservoirs behind them that you have seen. Large concrete dams have grandeur, and the huge lakes that they contain are often sited in attractive canyon or valley settings and provide picnic, swimming, and boating facilities. If you had grown up in the arid southwestern U.S., you might have thought of these as oases—providing relief from summer heat and dryness; had you grown up in the eastern U.S., you may have appreciated the dam-impounded reservoirs as camping and fishing spots. It is likely that, when you were young, you did not appreciate the real purposes of these structures or the controversies that surrounded some of them as they were proposed and built.
Dams most importantly provide: 1) dependable water supplies in areas experiencing significant annual fluctuations in precipitation and runoff or lacking other water sources such as groundwater; 2) a flood control buffer for times of excessive precipitation and runoff; 3) hydraulic head for generating hydroelectric power; and 4) recreational opportunities including boating, fishing, and swimming. During the colonial settlement and expansion in eastern North America, dams provided direct hydropower primarily for mills. Later, during the settlement of the semiarid to arid west, small dams provided water storage for irrigation and watering livestock. These two contrasting uses of dams, one in a relatively water-rich region, and the other in arid lands led to different water laws, which have been outlined in Module 1. An estimated 75,000 dams (over 25 feet) have been constructed in the U.S. alone (Graf, 1999), providing water storage of about 4 acre-feet (5000 m3) per year per person. Please go to this video of U.S. dam building since the early 1800s to see the pace and geographic location of dam building.
Video: US dams (00:20) This video is not narrated.
If the video does not play, watch it on the CSDMS website [1].
Figure 1 illustrates the increase in water storage from 1900 to the present on a global basis. This compilation shows clearly the impact of the U.S. dam building era, beginning in the 1950s as well as the decrease in the rate of water storage beginning in the 1980s with reduced rates of dam construction and the onset of dam removal projects. With an estimated 22,000 large dams China's push to build more dams is creating controversy.
Reading
Please take some time to read about it China’s Great Dam Boom: A Major Assault on Its Rivers [2].

Activate Your Learning
1. Why are large dams constructed? List four reasons.
ANSWER: Flood prevention, water supply, power, recreation.
2. From inspection of Figure 1, during what time period was dam construction happening most rapidly?
ANSWER: Where the slope of the graph is steepest, reservoir capacity was increasing most rapidly; this is between around 1955-1990.
3. Globally, dam construction has tapered off since around 1990-1995. Can you think of any reasons why this would be the case?
ANSWER: There are probably several reasons. For the most part, the best and largest dam sites have already been developed. In addition, environmental impacts and concerns have become increasingly visible and led to more opposition and stricter regulation.
Dams are, at times, perceived as being environmentally benign, particularly because the generation of hydroelectric power involves no direct greenhouse gas emissions. But there are impacts of dams that are deleterious to the environment and human health. For example, one of the major impacts of having constructed large dams on active, high gradient river systems carrying large volumes of water and sediment is the buildup of sediment behind the dam(s) and the decrease in sediment supply to coastal regions. Many modern deltaic coasts, including the Mississippi Delta region and the Colorado River Delta in North America, have been receding rapidly as the result of a series of dams emplaced on the Missouri River and the Colorado River, respectively. There are also impacts of ponded waters on human health, particularly in tropical regions where diseases and parasites are harbored by the biota in warm, slowly circulated waters. In addition, dams commonly impede the upstream migration of anadromous fishes to spawn, including shad and herring on the east coast of the U.S. and steelhead and salmon in the west, thus limiting natural populations and reaches of these fishes. Controversy surrounds many older dams that impede fish migration. Dams also alter environmental conditions, including changing water temperatures, oxygen concentrations, and nutrient loads that can substantially alter the ecology of river systems, as can be seen in the case of the Colorado River below Glen Canyon Dam (see below).
Yet, dams do serve human needs and there is a rich history of dam building in the U.S. that has now diminished (Figure 1). Although dams are now rarely constructed in the U.S., other countries have continued to build dams to control floods and provide hydroelectric power. In the U.S. many hydroelectric dams require upgrades and recertification because of newer regulations. Such aging dams, many privately owned, face economic pressures in conforming to modern requirements that include studies of environmental impacts, possible additions of fish ladders that will allow fish to bypass dams, etc. These impacts are weighed against benefits (water storage, hydroelectric power generation) in recertification. Increasingly, dam owners assess costs and find it much less costly to remove a dam than to refit it to conform to requirements. A number of large dams have now been removed or are proposed for removal. Even though dam removal can be beneficial, there are also possible significant environmental issues to be confronted, including the amount and composition of sediment ponded behind the dam.
Ponding the Waters: Impacts of Dams
Ponding the Waters: Impacts of Dams
As we’ve covered in the first part of this module, the need for dams is largely driven by the uneven distribution of precipitation, resulting from river discharge, and thus water supply – in both time and space. Dams control river flows and provide capacitance in the river channel to satisfy demands for continuous water supply (i.e. for irrigation and domestic use, for flood control, and power generation). However, such large-scale alteration of the natural river has wide-ranging impacts both upstream and downstream, where the ecology, geology, hydrology, and human populations have evolved in tandem with undisturbed patterns of variable river discharge. Here we’ll briefly cover some of these impacts, and highlight using examples from well-known case studies including the Three Gorges and Aswan High Dams.
Nutrient Supply to Floodplains
Nutrient Supply to Floodplains
Flooding is a natural process that replenishes soil and nutrients to floodplains. Of course, floodplains are ideal sites for agriculture – they are flat, water is accessible, and – at least prior to modification of the system by levees or dams – the soils are among the most fertile on Earth due to recurring flooding that deposits nutrient-rich fine-grained sediments. Historically, these are the sites of major agricultural and population centers, including the “Fertile Crescent” along the Tigris-Euphrates floodplain (now largely barren due to long-term effects of irrigation-based agriculture and flood prevention), and the Nile Floodplain (see The Nile River and Aswan Dam below). Likewise, most major modern agricultural production is localized to floodplains - including the Central Valley of California, the Susquehanna River Valley, the upper Tigris-Euphrates basin, the Nile Valley, and the floodplains of the Mississippi and Missouri Rivers.
Prevention of flooding through the combination of dams (which control river discharge) and levees (which artificially channelize flow and shunt it downstream so that it cannot spill onto the floodplain) is a strategy to limit the loss of crops and property, and allow development in otherwise flood-prone areas. This approach, while generally effective in limiting short-term losses, affects soil fertility, groundwater systems, and the health of downstream waterways in the longer-term. For example, flood prevention eliminates a major source of recharge to aquifers in valley-fill sediments that lie below the floodplain. Recurring floods also serve to flush salts that accumulate naturally in soils due to evaporation and transpiration (i.e. water is transported to the atmosphere by these processes, but even small amounts of dissolved salts remain in the soil). Reduction or elimination of this flushing can lead to soil salinization, with negative effects on soil fertility.
Perhaps most notably, by eliminating or limiting the replenishment of nutrients to the floodplain, imported fertilizer is required to grow crops. Excess fertilizer application, in turn, leads to runoff enriched in Nitrogen and Phosphates that affects aquatic species and can cause eutrophication of lakes and estuaries downstream. This is a longstanding problem that leads to algal blooms at river mouths, consumption of Oxygen by organic matter (dead algae), and ultimately to “dead zones” in these regions that affect fisheries (Figure 2).

Learning Checkpoint
1. Why are floodplains historically ideal for agriculture? List three reasons.
ANSWER: Nutrient supply, soil replenishment, water supply, typically flat. Could also note that rivers provide transport pathway for produced goods.
2. What is the main negative effect of eliminating the replenishment of nutrients to floodplains on ecosystems and river health downstream?
ANSWER: It leads to the addition of fertilizers and nutrients to the land, which in turn runs off to the river and ultimately the ocean. This leads to algal blooms that extract dissolved oxygen from the water, and cause hypoxic, or “dead” zones that impact fisheries and ecosystem health.
The Nile River and Aswan Dam
The Nile River and Aswan Dam
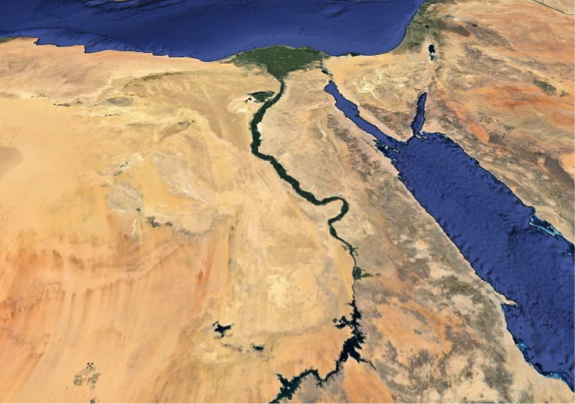
Large rivers are difficult to control. The Nile River, so important to Egypt's populace, is no exception. But since the late 1960s, the Nile River has been under the control of humans because of the construction of the Aswan High Dam. Part of the rationale for this dam was to manage the natural cycles of flood and drought to produce dependable water supplies for farming and other uses. The consequences of cyclic climate variations on a decadal scale were buffered by the large storage capacity of the Nile Valley behind the High Dam, which is nearly six trillion cubic feet (157 km3) of water! This is about four times the amount of water stored behind Hoover Dam (USA, Lake Mead) and Three Gorges Dam (China) (Chao et al., 2008). In addition, the Aswan High Dam initially produced a significant amount of electrical power (about 50%, now less than 15% of Egypt's needs) that allowed electrification of "rural" Egypt.
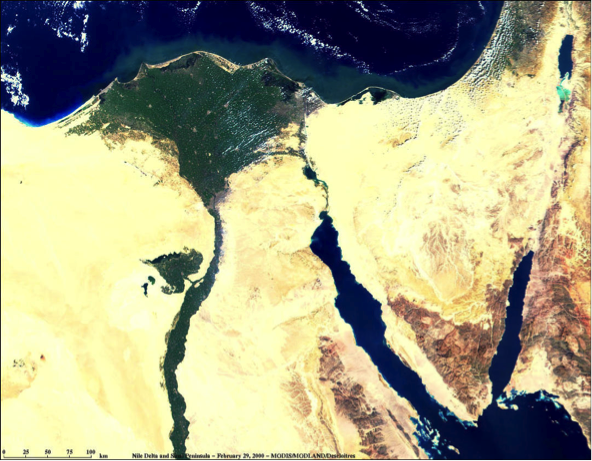
Figure 3 shows the narrow Nile River Valley slicing northward through the Egyptian desert. The narrow green band of the Nile River Valley represents farmland irrigated by waters of the Nile River. Prior to the completion of Aswan High Dam, the Nile River would flood its valley annually during the rainy season in its higher altitude headwaters (Ethiopia, Sudan, Kenya, Uganda), bringing nutrient-rich silt to fields and renewing fertility. In addition, a substantial volume of sediment was carried down the Nile River Channel to its large delta, building out the delta into the Mediterranean Sea, providing additional fertile land for farming. This no longer happens because the Aswan High Dam effectively (an unintended consequence) traps sediment carried from the highlands behind it. Now, the delta region, which subsides naturally as the result of compaction of sediment (newly deposited sediments have water contents of 70% or more that are reduced by compaction by overburden), is diminishing in size because rates of coastal erosion exceed supply of sediment. Currently, almost 1/3 of the Nile Delta’s land area sits within a meter of sea level. Subsidence rates vary across the delta, but in some areas, the land surface is sinking as fast as 1 cm/yr. Control of the Nile’s flow has also lead to water quality problems. Because once-regular floods no longer flush salts, sewage, fertilizers, and waste from the delta, surface waters are polluted and those living near the Mediterranean coast increasingly rely on groundwater to meet demand for drinking water and domestic use. Extraction of groundwater, coupled with land subsidence, has led to saltwater intrusion in the aquifer as far as 30 km inland.
There have been other unintended consequences of the Aswan High Dam including the spread of disease (Schistosomiasis), a decrease in water quality and increase in algal blooms resulting from fertilization of farm fields and irrigation runoff, flooding of historical sites, and displacement of people from the regions flooded by the reservoir.
Sediment Trapping
Sediment Trapping
Because large reservoirs behind major dams are areas where water flow velocity is slowed (also often called “slackwater”), sediments are deposited where rivers enter the water body (Figure 5). Sedimentation in reservoirs behind dams has several consequences. Sediment deposition reduces reservoir water storage capacity and therefore limits the useful lifetime of the dam for flood control, water supply, and hydropower generation. Recent detailed studies of storage capacity and sedimentation rates for reservoirs in the U.S. suggest that average annual storage losses range from less than 0.5% to more than 2% (see supplemental reading: Graf et al., 2010; “Sedimentation and sustainability of western American Reservoirs, Water Resources Research”). The highest rates of storage loss are occurring in the American West, and the lowest in the Northeast.
For example, almost 20 million tons of sediment are deposited annually in reservoirs along the Mississippi River (UNESCO, 2011). China’s Three Gorges Dam alone (one of several along the Yangtze River) traps 34 million tons of sediment per year, or 31% of the river’s sediment load (Hu et al., 2009). Globally, the amount of sediment trapped in dams is estimated to be 73 km3 (Syvitsky & Kettner, 2011) and storage loss to trapped sediment has reached 16% of initial storage capacity with an expected 26% loss by 2050 (Perera et al., 2023).This sediment accumulation slowly reduces reservoir capacity behind dams and is one factor that limits their useful life expectancy. Recent studies of sediment accumulation suggest that the life expectancy of Lake Powell is ~300-700 yr, and that of the Three Gorges Reservoir in China is ~150 yr.


The concomitant reduction in sediment delivery to downstream areas also has several consequences (Figures 5-6). Ultimately the decreased sediment supply to the river mouth translates to net erosion of beaches and loss of land in coastal regions, as natural coastal erosion by currents and subsidence caused by compaction of delta sediments is not offset by delivery of sediment. For example, prior to construction of the Aswan High Dam began in 1960, the annual sediment flux to the Nile Delta was ~100 million tons. This sediment supply was enough to offset erosion and natural subsidence.
Consequences of Concomitant Reduction
Consequences of Concomitant Reduction
The concomitant reduction in sediment delivery to downstream areas also has several consequences (Figures 7-9). Ultimately the decreased sediment supply to the river mouth translates to net erosion of beaches and loss of land in coastal regions, as natural coastal erosion by currents and subsidence caused by compaction of delta sediments is not offset by delivery of sediment. For example, prior to construction of the Aswan High Dam began in 1960, the annual sediment flux to the Nile Delta was ~100 million tons. This sediment supply was enough to offset erosion and natural subsidence.

Without continued sediment delivery, subsidence and coastal erosion lead to significant losses of land area (Three Gorges: A “Mega-Dam” and its Impacts), much of which is prized for agriculture or development. Currently, parts of the Nile Delta are subsiding at up to 1 cm/yr. This phenomenon is common to most of the world’s major river systems, including the Mississippi, Colorado, Yangtze, and Indus Rivers (Figure 7). For example, much of New Orleans is subsiding at over a half-centimeter per year, with some areas sinking more than 2.5 cm/yr (Figure 9). The combination of subsidence, coastal erosion, and sea-level rise has led to land loss from the Mississippi Delta of almost 1100 acres per year since the mid-1970s.
The same processes also place these areas at especially high risk for flooding in major storm events. Much of the inundation of the Gulf Coast caused by Hurricane Katrina in 2005 occurred in areas that lie below sea level due to subsidence. The effects of subsidence are compounded by the loss of barrier islands as their sediment supply is not replenished. Further, extraction of groundwater from the subsurface – and in some cases oil and gas - exacerbates land subsidence, and can also lead to saltwater intrusion in coastal aquifers.


Consequences of Release of Water
Consequences of Release of Water
Release of water from the downstream side of reservoirs at dams affects the ecology of the river downstream because there is little or no entrained sediment to replenish alluvial deposits along the river, and, in fact, the now sediment-starved river is more likely to erode existing bars, beaches, and riverbeds. In many cases, the clear water released from dams can erode fine-grained sediments (silts and clays) from river banks and bars, leaving behind the coarser sand and gravel deposits that would require higher flow velocities to mobilize (as we covered in Module 3…remember?). Increased scouring can also lead to destabilization and landsliding along the river banks.
Erosion of sandbars and beaches poses a threat to native fish species that depend on sheltered waters for spawning or their fry. For example, the population of the humpback chub, a fish species native to the Colorado River system, has decreased by an estimated 75% since 1982. The chub was uniquely adapted to thrive in the sediment-laden, low-visibility and naturally turbulent waters of the Colorado River. Since the construction of Glen Canyon Dam, the clear, colder, and more stable flow has favored non-native predatory species like brown and rainbow trout.
Deposition and storage of sediments behind dams also lead to the buildup of organic material and nutrients adsorbed to sediment grains or trapped in pore spaces that will be released if the dam is decommissioned. As discussed in the next part of this module (“Bringing Down the Dams”), if or when dams are decommissioned, many years’ worth of sediment, nutrients, and carbon must be managed. Release of the stored sediment can lead to:
- inundation of the river system with suspended sediment that increases water turbidity
- introduction of nutrients to the river mouth that can lead to eutrophication and dead zones
- the potential release of toxins, including metals and volatile organic compounds adsorbed to fine sediment, to downstream areas

Recent controlled water releases have been conducted to explore the possibility of delta and downstream habitat renewal. In 1996, a seven-day-long experimental release of 1290 m3/s (that’s about 20 million gallons per minute) from Glen Canyon Dam was conducted to evaluate the prospects for the restoration of stream habitat through the rebuilding of sandbars and beaches. The experiment yielded mixed results – most notably that sand was initially deposited on bars and beaches, but only during the first couple of days of the release. There was not enough sediment load in the released water to sustain deposition, partly because the experiment was not synchronized with the natural seasonal sediment flux from upstream tributaries; as a result, existing bars were eroded and remobilized in the late stages of the controlled flood. In March 2014, a “pulse flow” of 105,000 acre-feet (about 1% of the River’s annual discharge) lasting until mid-May was released from Morelos Dam to bring water to the Colorado River Delta through a joint US-Mexico initiative. You can listen to a brief news story about the experiment: Well, I'll be Un-Dammed: Colorado River (Briefly) Reached The Sea [6]. The pulse flow was designed to mimic natural spring floods that disperse seeds, nourish the delta, and provide habitat for waterfowl. These experiments suggest that partial restoration may be possible, but will likely require a better understanding of the dynamics of stream habitats and sediment delivery and transport processes.
Other Impacts
Other Impacts
In this section, we will consider other impacts of dams.
Pollution
Pollution
In addition to the increased nutrient concentrations from agricultural return flow downstream of dams, the reduction in flow velocity in slackwater behind dams leads to reduced flushing of pollutants that enter the river. In areas subject to high rates of municipal or industrial wastewater discharge, or to agricultural runoff, this can lead to significant impairment of water quality in the reservoir itself, and in upstream tributaries (for example, see Three Gorges: A “Mega-Dam” and its Impacts). High nutrient fluxes can also lead to eutrophication of the reservoir. Additionally, the increased surface area of reservoirs leads to large evaporative losses and subsequent increases in water salinity, especially in arid and semi-arid climates.
Fish Spawning and Migration
Fish Spawning and Migration
As noted previously, dams have wide-ranging effects on downstream habitat through changes they cause to water turbidity and sedimentation and erosion patterns. These changes threaten certain species that have evolved to thrive in the natural system – like the humpback chub – through a combination of decreased or degraded breeding habitat and increased predation by non-native species. Additionally, because water released from dams through intakes flows from the deep part of the reservoir, it is commonly colder than the natural river flow – and its temperature is less variable than in the river’s natural state. For example, prior to construction of the Glen Canyon Dam, water temperature in the Colorado River varied from ~0 to 27° C over the course of the year; water discharged from the dam now averages ~8°C and varies little seasonally. The changes in water temperature and its variability impact some fish species, which rely on temperature cues to trigger key lifecycle events. The lower oxygen levels in waters released from storage behind dams also impact fish downstream.
Finally, dams present physical barriers to catadromous and anadromous fish species (those that spawn in saltwater and live in freshwater, and vice-versa, respectively). These fish migrate either upriver from the ocean (anadromous), or downriver to the ocean (catadromous) to spawn. After hatching, the young fish migrate in the opposite direction. Of these, perhaps the best known is the salmon, which migrates up-river to spawn, commonly over hundreds or thousands of km – for example, although greatly reduced due to major dams along the Columbia and Snake Rivers, Chinook salmon runs commonly extend from the Pacific Ocean all the way to Idaho! Structures designed to allow fish to navigate dams, such as fish ladders, are one solution, but they still present a barrier that reduces the likelihood of safe passage, and thus fish numbers.
Diseases – A Tropical Malady
Diseases – A Tropical Malady
The large reservoirs impounded by dams provide breeding grounds for some water-borne diseases and parasites, especially in tropical climates. Among the most prevalent of these is schistosomiasis, a disease caused by parasitic worms. The parasite is spread by freshwater snails, and has come to be known as the “disease of hydroelectric dams”. It infects an estimated 200 million people per year (with 200,000 fatalities), primarily in Asia, Africa, and South America. Through the expansion of habitat for the disease vector by large slackwater reservoirs, the incidence of this and other diseases is greatly increased. For example, in the Yangtze River Basin, the incidence of schistosomiasis is near 5%, versus less than 1% in less or undeveloped areas.
Dams and major irrigation projects also provide expanded breeding habitat for insects (mosquitos) that serve as vectors of Dengue fever, malaria, and West Nile virus, among others. The World Health Organization (WHO) estimates that malaria cases in villages near the Bargi reservoir in India increased more than twofold following the dam’s construction, and up to four-fold in villages closest to the dam itself. Likewise, malaria incidence increased by seven times in proximal Ethiopian villages following the construction of small dams on the Tigray River. A similar increased incidence of West Nile virus has been documented as a result of increased mosquito breeding area in many parts of the world, including the Midwestern U.S., California, and Oregon.
Earthquakes and Structural Failures
Earthquakes and Structural Failures
Impoundment of water behind major dams changes the distribution of stress in the Earth’s crust, and in combination with downward percolation of impounded water, can trigger seismicity. For the most part, this phenomenon is restricted to increased numbers of small (magnitude <3.5) earthquakes triggered by the increased load of millions of m3 of water, associated warping – or flexure – of the crust, and diffusion of water pressure from the reservoir along fractures and fault lines (Figure 10). Although hotly debated, reservoir-induced seismicity has even been invoked as a possible mechanism for the devastating 2008 magnitude 7.9 Wenchuan earthquake that killed an estimated 80,000 people (see one news article discussing this issue here [7]). The reservoir impounded behind the 156 m-tall Zipingpu Dam lies above the Beichuan- Yinxiu fault, which extends to the Northeast to the earthquake hypocenter, located ~50 km away.
Although remote, there is also a potential risk of dam failure to life and property downstream. In some cases, the causes of such failures are not known with much certainty. For example, the collapse of the St. Francis Dam Northeast of Los Angeles in 1928 resulted in the catastrophic release of over 12 billion gallons of water. The flood wave, which was over 140 feet high, killed an estimated 600 people and scoured the valley below, transporting fragments of the dam as large as 10,000 tons for almost a mile downstream. In other cases, upstream flooding or inadequate ability to release water and relieve pressure on the dam are the culprit, as in the famous collapse of the South Fork dam and resulting 1889 Johnstown PA flood that killed over 2000 people and triggered changes to liability laws in the U.S. In 1986, a similar disaster at the Glen Canyon Dam was narrowly avoided.

Politics and Control of Flow Across Borders
Politics and Control of Flow Across Borders
Rivers are not restricted by state and national borders, whereas dams are rarely constructed or managed by collaboration between governments. As a result, alteration, interruption, and control of river discharge by dams naturally leads to political and legal conflict. In the case of the Colorado River, which we will cover in more detail in Module 8 (Cities in Peril), the allocation of water between states within the drainage basin is governed by the 1922 Colorado River Compact. Allocation of water between the U.S. and Mexico is governed by an international treaty established in 1944 and revised in 2012. Even though well established, the water allocation of the Colorado, and its fairness are widely debated. The compact is also the focus of lawsuits over water rights for Native American reservations, which were not explicitly included in the original agreement. Court battles have also arisen over other river flows in recent years (for example in Florida and Georgia, and along the San Joaquin and Sacramento Rivers) pitting access for communities or farmers against minimum limits on flow required to support endangered species.
Globally, other rivers and dams are the source of equal – or more – controversy. As one example, at the 1992 opening ceremonies for the Atatürk Dam on the Euphrates River in Turkey, the president of Turkey is reported to have said, "Neither Syria nor Iraq can lay claim to Turkey’s rivers any more than Ankara could claim their oil. This is a matter of sovereignty. We have a right to do anything we like. The water resources are Turkey’s, the oil resources are theirs. We don’t say we share their oil resources, and they can’t say they share our water resources." The conflict over waters of the Tigris-Euphrates continues (you can listen to a story about this dispute here [8]). Dams and control of river flows in the headwaters of the river system, and subsequent impacts on water access to supply populations with drinking water, to grow food, and support industry in the downstream nations of Iraq and Syria, are at the heart of the dispute. Similar tensions are now arising along the Mekong River between China (upstream) and downstream neighboring countries of Myanmar, Thailand, Laos, Cambodia, and Vietnam that rely on the river. Voice of America reported as of 2023, 11 dams along the Mekong in China are used as a primary water resource in the dry season and during droughts. This exasperates dry conditions downstream causing food insecurity to nearly 60 million people
Three Gorges: A “Mega-Dam” and Its Impacts
Three Gorges: A “Mega-Dam” and Its Impacts
The Yangtze River is the longest river in Asia and is the world’s 3rd longest (only the Nile and Amazon are longer). It flows for ~6300 km from its headwaters on the Tibetan Plateau to its delta at Shanghai, where it discharges to the East China Sea. The Yangtze watershed encompasses approximately 1/5 of China’s land area. The river serves the water demand of millions of people and the delta alone supports almost 20% of China’s GDP. However, the Yangtze is also notorious for its frequent and devastating floods. Floods in the twentieth century alone led to the loss of an estimated 300,000 lives, including 145,000 drowning deaths in a 1931 flood, and 30,000 deaths in 1954 from flooding and diseases that followed. In addition to loss of life, these floods inundated hundreds of thousands of acres of productive farmland and caused billions of dollars of damage.
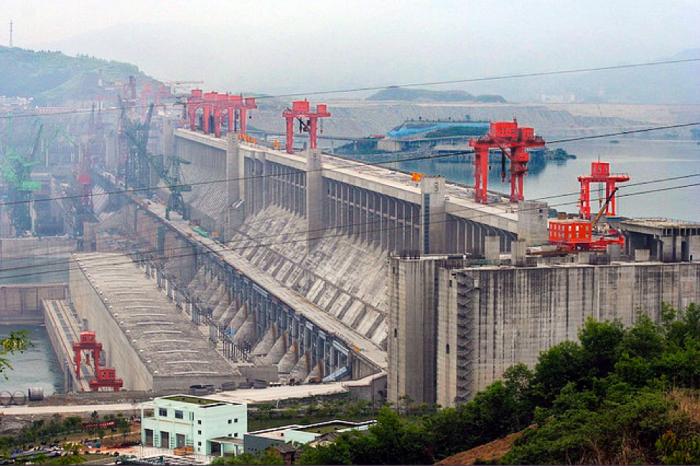
To protect over 15 million people in Shanghai and the lower Yangtze floodplains, and control flooding of almost 15,000 square km of land, construction of the Three Gorges Dam began in 1994. The dam, constructed at a cost of between ~$28-60 billion dollars (exact cost is not known because the project has been funded by a combination of government subsidy and private investment), is nearly 200 m high, spans more than 2 km across the river, and was engineered to withstand a magnitude 6.0 earthquake (Figure 11). The long, narrow Three Gorges Reservoir extends ~600 km upstream and has a capacity of almost 40 billion m3 of water (equivalent to about 32 million acre-feet) (Figure 12). At the time of construction, the dam was the largest hydroelectric power plant on Earth, with a generating capacity of over 20,000 megawatts - more than 20 times that of Hoover Dam, equivalent to 18 nuclear power plants, and enough to supply almost 10% of China’s power demand. According to the Chinese government, if this amount of electricity were generated using coal-fired power plants instead, 100 million tons of additional carbon dioxide would be released into the atmosphere. The dam also increases the navigability of the Yangtze, allowing large freighters to transport goods far into China’s interior.
Despite the obvious benefits of the dam for the economy and generation of renewable energy, the Three Gorges Dam has been mired in controversy since its inception. Concerns about the dam include an array of environmental impacts, the forced relocation of over a million residents, initiation of large landslides and earthquakes by the rising reservoir, and flooding of important historic and cultural sites in the gorge upstream of the dam. The chief environmental issues center on impacts to river ecology and already threatened species increased chances for waterborne diseases, and water quality degradation associated with the slowed flow of the river in the backwaters of the dam, in tributaries, and in downstream regions. Indeed, in the wake of pollution concerns, during construction, an additional $4.8 billion was budgeted for new treatment plants and garbage disposal sites along the river’s upstream reaches.

Bringing Down the Dams
There are clear cases for which the decision to remove a dam is virtually unquestioned except perhaps for its historical significance, said dam having outlived its usefulness. However, most proposals for dam removal are controversial because such decisions must evaluate benefits of retaining the dam against benefits of removing it. Certainly, these are complex decisions because of the conflict between ethical, economic, and legal aspects.
Enhancement of Populations of Anadromous Fishes
Enhancement of Populations of Anadromous Fishes
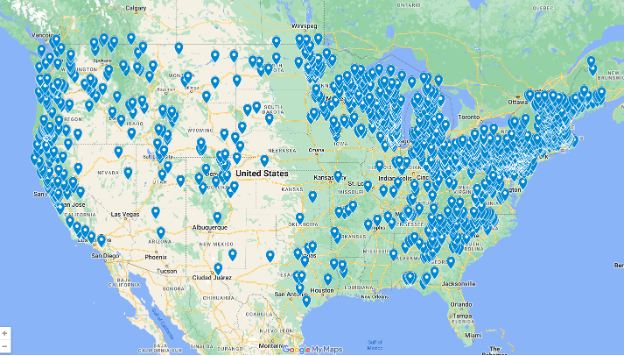
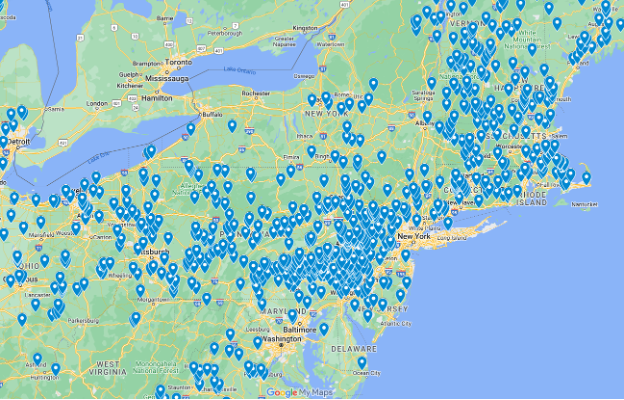
Dam removal has become increasingly popular, particularly as regards enhancement of populations of anadromous fishes--salmon and steelhead in the western U.S. and shad, herring and other species in the eastern U.S. Figure 13 illustrates the dams that have been removed in the lower 48 states (Figure 14 expands the eastern U.S.) from 1912 to 2023 on the basis of data tabulated by American Rivers [9]. These dams have been removed largely to improve the ecological conditions of river systems and to allow migratory fish to pass unimpeded for spawning in the upper reaches of rivers. Dam removal is commonly cited as a way of increasing stocks of imperiled fishes (Chesapeake Quarterly: Those Dammed Old Rivers [10]), allowing them to spawn in rivers that have been inaccessible to fish migration for as much as a century. Others argue that dam removal from coastal rivers is only part of the solution for fisheries improvements. Although numbers of anadromous fish may increase, the size of individual fish may not as long as fishing pressure remains the same (Oregon State University: Department of Fisheries and Wildlife [11]). This has been argued in the case of Elwha Dam removal in the Olympic National Park watershed (Crosscut: Elwha dams: Will bringing down NW dams really help salmon? [12]). In some cases, the benefits will accrue to native Americans who formerly depended on fishing for their nutrition and livelihood.
Esthetic Improvements
Esthetic Improvements
Arguments have also presented for esthetic improvements as the result of dam removal. An example of this approach is the argument for the removal of Hetch Hetchy (O'Shaughnessy) Dam on the Tuolomne River in the Sierra Nevada Mts. of California (Restore Hetch Hetchy [15]). This dam and its reservoir flooded a canyon much like Yosemite just to its south beginning in 1923, even though Hetch Hetchy was included in Yosemite National Park in 1890 by President W.H. Harrison. President Wilson, in 1913, signed the Raker Act that allowed San Francisco to dam the valley. Proponents of this dam removal argue for ecological improvements as well as access to once-spectacular scenery eliminated as the result of the water project. Hetch Hetchy provides some 20 percent of hydroelectric power generation to San Francisco as well as significant water supplies. Nonetheless, proponents of the dam removal argue that impacts on water or electrical power availability would be minor (Hetch Hetchy Today [16]).
Issues Accompanying Dam Removal
Issues Accompanying Dam Removal
One of the issues accompanying dam removal is the potential impact of the large volume of sediment that accumulated behind some dams over time. This so-called "legacy sediment" is commonly very fine-grained and contains stored nutrients and organic matter, among other possible pollutants. When dams are destroyed, efforts must be made to avoid a large flux of this sediment downstream as the newly released river cuts down to its natural base level. This requires careful engineering and significant funding. Merritts and Walter (2010) have suggested that most rivers and streams in eastern Pennsylvania and Maryland run through floodplains and levees of legacy sediment, not natural river valleys, created by the plethora of small dams built to impound water for hydropower in the past. And, even now, some large dams serve as a buffer against sediment transport that would create broad mudflats and high turbidity in coastal bays such as the Chesapeake Bay. Conowingo Dam in Maryland is one such structure that has reached its sediment capacity. During high flow events, sediments carrying nitrogen, phosphorus, and other pollutants enter the Chesapeake Bay. As of 2021, Maryland is working to implement a multi-million dollar strategy to reduce pollutants from entering the reservoir and reduce their flow downstream. For an example of the engineering and costs of removing a dam, check out the San Clemente Dam Removal & Carmel River Reroute Project [17] in central California.
Many dam removal projects are proposed, but await funding from federal sources—Congress must appropriate funds. Projects on the Snake River and the Klamath River in the west remain controversial, but at least in the case of the Klamath, the removal of four large dams has begun and it’s estimates that this will have lasting benefits on the river, community, and salmon populations. Figure 9 illustrates the consequences of waiting for funding of dam removal using the Olmstead Dam example.

In 1988, Congress authorized spending 775 million dollars for a 7-year project to build Olmsted Locks and Dam. But the cost has more than quadrupled to 3.1 billion dollars, and 25 years later, the project is barely half done.
| Year | Funds in millions |
|---|---|
| 1991 | 5 |
| 1993 | 60 |
| 1995 | 35 |
| 1997 | 70 |
| 1999 | 55 |
| 2001 | 60 |
| 2003 | 70 |
| 2005 | 75 |
| 2007 | 115 |
| 2009 | 115 + 5 in stimulus funds |
| 2011 | 140 |
| 2013 | 145 |
| 2014 | 163 |
The Future of Dams: Developing Nations
The Future of Dams: Developing Nations
As may be evident from a re-examination of Figure 1 above, the era of major dam building is winding down, at least in the U.S. This is primarily because the best sites for large dams are now already being used; and because the impacts are more widely understood and, as a result, proposed dam construction projects face major challenges from environmental groups. Construction of large dams (defined as those higher than four stories) in North America and Europe peaked in the 1970’s - and the average age of the worlds large dams is 35 years. Nonetheless, in parts of the world, mainly in developing nations in Africa, Asia, and South America, there is substantial untapped potential for hydroelectric power.
During the 1900s, in the so-called “golden age” of dam building, one large dam was commissioned somewhere on Earth every day (World Commission on Dams, 2000). On the one hand, dams are effective and powerful tools for water distribution and management, power generation, and flood control - and thus indirectly facilitate economic development, food production, and industrialization. Indeed, major dams are often viewed as symbols of modernization and progress - although a work of fiction, you may recall this quote from the movie “O Brother Where Art Thou”, as the protagonist, Ulysses Everett McGill, and his sidekicks are saved by the onset of a flood:
“Out with the old spiritual mumbo jumbo, the superstitions, and the backward ways. We're gonna see a brave new world where they run everybody a wire and hook us all up to a grid. Yes, sir, a veritable age of reason.”
Human Intervention in the Global Water Cycle
Human Intervention in the Global Water Cycle
On the other hand, as discussed above in Ponding the Waters: Impacts of Dams, the effects of large-scale alteration of river systems and the hydrologic cycle have become increasingly clear in the past few decades. The scale of human intervention in the global water cycle is also becoming apparent, including restriction of river flows such that they no longer reach the ocean in many years, associated two- or three-fold increases in the residence time of runoff, decreased sediment delivery to the oceans, and a long-term measurable effect on global sea level caused by the impoundment of thousands of cubic km of water (Vörösmarty et al., 2004). As a result, new large dam projects have been heavily scrutinized and faced political and environmental opposition. At the same time, the efficiency and economics of energy production, and the net offset of greenhouse gas emissions from increased hydropower generation have been increasingly questioned (World Commission on Dams, 2000). One way to minimize environmental impacts is to design “run of the river” systems, in which no reservoir is created and instead the natural flow of the river in its channel is harnessed to generate power. However, these systems have several drawbacks: they rely on natural flows, so the power generating capacity fluctuates dramatically as a function of seasonal rainfall patterns and climate change; and there are no added benefits of flood control or water supply.
Dams and Economic Development
Dams and Economic Development
Despite the controversy, in many developing nations, major dam projects remain important engines for economic development and hold substantial potential for renewable energy generation. As of 2020, hydroelectric power constituted as much as 17% of global electricity production (and 50% of estimated renewable energy production). Of this, ~23% is in China, ~12% in Brazil, ~10% in Canada, and ~7.5% in the United States; combined, these four nations generate over half of the world's hydropower!
Moreover, globally, estimates suggest that up to two-thirds of economically viable dam sites have yet to be exploited. Undeveloped sites are especially abundant in Latin and South America (79% of renewable water remains unused), Africa (96%), India and China (48% is unused in Asia) (UNEP, 2013). Rapidly growing energy demand in India, China, and the Amazon Basin have driven the construction of hundreds of large dams as of 2002 (Figures 10-11; Table 1). This development may be a harbinger of things to come on the African continent. Africa has the second-highest population (after Asia), and the fastest-growing (See Module 1.3); it also has the lowest per capita energy use (UNEP, 2013). Looking to the future as demand for energy, water, and food in developing nations continue to grow – both per capita and in total as populations swell - it seems inevitable that demand for large dams will persist well into the 21st century. Hydroelectric power provides 50% of electricity for 28 emerging and developing nations reaching over 800 million people.

| Region | Number of dams |
|---|---|
| China | 22000 |
| Asia | 9000 |
| North and Central America | 8000 |
| Western Europe | 4000 |
| Africa | 1000 |
| Eastern Europe | 1000 |
| South America | 800 |
| Austral-Asia | 500 |
| Country | Number of Dams | Purpose |
|---|---|---|
| India | 695-960 | Irrigation, multipurpose |
| China | 280 | Flood control, irrigation, power |
| Turkey | 209 | Water supply, hydropower |
| South Korea | 132 | Irrigation, hydropower, flood control |
| Japan | 90 | Flood control |
| Iran | 48 | Irrigation, multipurpose |
| Country | Number |
|---|---|
| China | 24,089 |
| United States | 10,158 |
| India | 4,540 |
| Japan | 3,135 |
| Canada | 1,440 |
| South Africa | 1,428 |
| Repbulic of Korea | 1,359 |
| Brazil | 1,280 |
| Mexico | 1,107 |
| Spain | 1,066 |
Data taken from CIG ICOLD [19]

Summative Assessment: Dam Debate
Instructions
We will build upon the online module content and written assignments for the Aswan High (Nile River), Three Gorges (Yangtze River), and Glen Canyon (Colorado River) Dams, and hold three in-class debates centered on the positive and negative impacts of each of three well known large dams. Students will break up to form small teams (2-3 members each) for each position (pro and con) for each of the three dams. At the end there should be 6 teams of 2-3 students, each taking the "pro" or "con" side on one of the dams. Each team will present their arguments in a format detailed below that allows for an exchange of views.
Thinking About Systems
Note that dammed rivers are complex systems, with many interlinked processes occurring up and down stream. When considering building a dam, all of these combined processes must be considered at once, making this a very tricky issue. Although you are trying to make a clear case for or against damming a river in the debate, resist the temptation to over-simplify the issue. Instead, force yourself to delve into the cascade of consequences building or not building a dam could have for a region - including agriculture, industry, energy, public health, etc.
Details
- Each team will have the opportunity to present their primary argument(s) [8 minutes].
- The arguments will be followed by a rebuttal [6 minutes].
- At the conclusion of each of the debates, the rest of the group will render their “opinions”.
- At the end of the class period, we will tally and discuss the outcomes.
We will consider a scenario in which the Three Gorges, Aswan High, and Glen Canyon Dams have yet to be built.
- Choose one of the three dams. Take a position for or against its construction, and develop the arguments to support your position. Draw upon the written assignments you completed as part of the online module.
- Your arguments and supporting material should reflect a clear understanding of the feedbacks between processes in the river system, and how dam construction would alter them. If your group is “against” dam construction, you’ll need to explain the negative aspects of disruption of the system. If your group is “for” dam construction, you’ll need to be ready to articulate and evaluate the effects of dams on inter-linked components of the river system, and construct arguments that weigh these against the benefits of dams.
- For whichever position you choose, articulate a plan to address the issues that you anticipate will arise if your course of action is adopted [i.e. be prepared to present a rebuttal of the opposing team’s arguments]. For example, if you argue against the Three Gorges Dam, how would you handle issues of flood control and potential loss of life and property? Would you attempt to offset the non-renewable energy generation that would replace hydroelectric power? If you argue for it, how would you address the range of environmental impacts?
- Prior to coming to class, prepare a one-page note sheet with factual information derived from the module and external reading (see References at the end of the Module) that you can use to support your argument. Be sure to include the source of each piece of information in case you are challenged!
- As an observer of other groups' debates, write a brief opinion (~1/2 page) with your “judgment” or “vote” on each of the debates you were not involved in. In each debate, which team convinced you of their position, and which arguments swayed you most? Do these apply to all large dam projects, or just those discussed in the debate?
Deliverables
1 page fact sheet (with references) supporting your argument
~1/2 page judgement or vote paper explaining which team made a stronger argument in each of the other two debates
Submitting Your Paper
Turn in your papers at the end of class.
Grading and Rubric
A scoring rubric will be provided by your instructor.