Lesson 1 - The Energy Industry – Overall Perspective
Lesson 1 Introduction
Overview
As the saying goes, “the only constant is change.” This statement can be used to describe the energy industry over the past few decades. “Booms” and “busts” have occurred numerous times as prices rose and then fell back again. Companies have come and gone. Enron shook the very foundation of energy trading. Investigations of supply and price manipulation have occurred, resulting in fines and imprisonment. The new exploration ("3-D & 4-D" seismic), drilling (directional & horizontal), and completion techniques (so-called “fracking”) have not only led to a substantial increase in the production of crude oil and natural gas, but have also led to great controversy and new regulation over the methods themselves. The abundance of natural gas is leading to the exportation of liquefied natural gas (LNG), making the US a major player in that global market.
The “how” and “why” these occurred will be presented throughout the course, and you will come to understand the ever-changing landscape that is the energy industry in the United States.
Despite the reference to alternative & renewables energy sources in the course description, we will spend very little time discussing them. This course focuses largely on the five fossil fuels that are traded both physically and financially in energy markets. These are natural gas, crude oil, unleaded gasoline, heating oil, and natural gas liquids (NGLs). The reason for this is that these energy commodities are heavily traded in financial futures markets. Understanding how these financial markets work is the primary goal of this course. These fuels, along with coal, comprise the “non-renewable” energy sources. They are so named since their supply is seen as finite over the long-term. Then we will extend our knowledge to the electricity market, its characteristics, and differences. We will also introduce the risk management methods.
Each of these products has a profound effect on the United States and global economies. Billions and billions of dollars of infrastructure and hundreds of thousands of jobs are involved in the exploration, production, transportation, and distribution of these forms of energy. And price volatility for these commodities has increased dramatically over the past several years going back to the historic run to $147 per barrel (Bbl) for oil in 2008. Since that time, crude oil has been recognized as a truly global commodity with a host of new factors influencing price. And, once again, in 2014, prices fell from $100 in June to less than $50 by December, caused largely by Saudi Arabia flooding the market with cheap crude. It was said they feared a loss of market share to the new shale oil in the US. One of the major players in the oil market is Organization of Petroleum Exporting Countries (OPEC), with about 40 percent market share of the world's crude oil production. OPEC decisions and members' agreement have a substantial effect on crude oil price. Following the oil price drop in late 2014 and 2015 to about $30/Bbl, OPEC members (and some other producers) came to an agreement to decrease their production, which caused the prices to increase in late 2016 and 2017. In March 2020, following the global pandemic, crude oil futures price dropped to about - $40/bbl for the first time in history.
However, before we proceed into the details of these fossil fuels, we need to understand how these fit into the overall profile of energy production and consumption in the United States. In order to do this, we must also include the various other forms of energy produced and consumed in the United States, known as “alternative” and “renewable” energy. This is the only lesson regarding alternative and renewables.
Learning Outcomes
At the successful completion of this lesson, students should be able to:
- describe the major sources of energy in the United States;
- outline the energy production/consumption environment;
- explain what is meant by “renewable” vs. “non-renewable” energy;
- evaluate the pros and cons of 5 different types of alternative fuels, including the cost to produce, emissions profile, feedstock, and likelihood of increased use;
- list the main fossil fuels;
- critically assess the pros and cons of each type.
What is due for Lesson 1?
This lesson will take us one week to complete. The following items will be due Sunday at 11:59 p.m. Eastern Time.
- Introduce Yourself discussion
- Lesson 1 activities as assigned in Canvas
Questions?
If you have any questions, please post them to our General Course Questions discussion forum (not email), located under Modules in Canvas. The TA and I will check that discussion forum daily to respond. While you are there, feel free to post your own responses if you, too, are able to help out a classmate.
Reading Assignment: Lesson 1
Optional Readings
Lesson 1 doesn't have any reading assignments. However, the following readings are optional and recommended.
- Wind Power [1]
- Hydropower [2]
- Solar Energy [3]
- Geothermal Energy [4]
- Biomass [5]
Major Sources of Energy in the United States
“Non-renewable” energy sources (such as Oil and Petroleum Products [6], Natural Gas [7], Natural Gas Liquid [8], Coal [9], and Nuclear [10]), as well as “renewable” energy and “alternative fuels” (such as Hydro [2], Solar [3], Wind [1], Geothermal [4], Biomass [5], and Biofuels [11]), help to satisfy the nation’s energy needs. Fossil fuels and nuclear power are considered non-renewable sources of energy. Coal and natural gas play large roles in the generation of electricity as well as in industrial processes such as the manufacturing of steel. Hydro, solar, wind, biomass, biofuels, and geothermal are all considered “renewable” forms of energy and comprise varying levels of supply in this country. They are classified as renewables since their source is considered to be virtually unlimited. Of these, solar, wind, biomass, biodiesel, and geothermal are all considered “alternative” energy sources since they are not the “traditional” kind (fossil fuels, nuclear, and hydro).
The following chart is from EIA reported data [12] and shows major energy sources and percent shares of U.S. electricity generation at utility-scale facilities in 2021. Please note that in 2021 natural gas has the largest share (38%) in U.S. electricity generation, coal is in the second place (22%), and nuclear has the third place (19%). As shown in Figure 1, renewable energy sources contribute to about 20% of the U.S. electricity production at utility-scale facilities as of 2021, with about 9.2% wind power and 6.3% hydro. Please note that 2019 was the first year that wind power surpass the hydro. Other renewable sources such as solar, biomass and geothermal have a minor share.

Figure 2 below shows the break-out of fuel sources used in the generation of electricity. As you can see, the single largest fuel has been coal in the past decades, although this is changing as historically low natural gas prices during 2010-2020 caused some “fuel switching.” This was followed by natural gas, nuclear, and renewable energy sources. This final category is composed of energy sources such as wind, solar, hydroelectric, biomass, and geothermal.
Figure 3, below, displays the renewable energy sources that contribute to power generation. As you can see, there has been a rapid increase in wind and solar power generation. However, it will take decades for alternative fuels to make a substantial contribution to the energy portfolio in the United States. Thus, there is a need to continue to use fossil fuels and nuclear power to “bridge” the gap. How the former (fossil fuels and nuclear power) are delivered to market and how they are priced is the main focus of this course.

- Geothermal: Geothermal generation was relatively stable, and very low, from 1990 - 2020.
- Biomass: Biomass generation has remained steady at about 50 - 60 billion kWh from 1990 - 2020.
- Hydroelectric: Hydroelectric generation widely between about 220 billion kWh and 350 billion kWh from 1990 - 2021.
- Solar: Utility-scale and end-use solar generated almost zero kWh before 2010. It rose from almost zero to about 115 billion kWh by 2021.
- Wind: Wind power generated almost no power until 2004. From 2004 until 2021 it rose to about 378 billion kWh, more than 25 times of 2004 generation level.
Now that we have clarified the difference between renewable and non-renewable sources of energy, let’s take a look at the production and consumption of energy in the United States on a macro level.
Energy Production and Consumption in the United States
The United States is the world’s largest consumer of energy in general and of oil and refined products in particular. However, our current and forecasted energy production and consumption balance is improving towards a position of declining imports and more efficient use of all energy sources. The vast new supplies of oil and natural gas coming from domestic shale are radically altering our outlook for eventual self-sustainability. And the continuing development of “renewable” and “alternate” energy sources will decrease our reliance on traditional “fossil” fuels. We will now take a look at the current state of energy production and consumption in the US, followed by a brief examination of the renewable and alternative energy sources.
The following pie chart (Figure 4) shows the United States' energy consumption by source in 2021. As shown in the chart, petroleum that is mainly used for the purpose of transportation has the biggest share of 36%. Natural gas is in second place with 32% share of energy consumption.
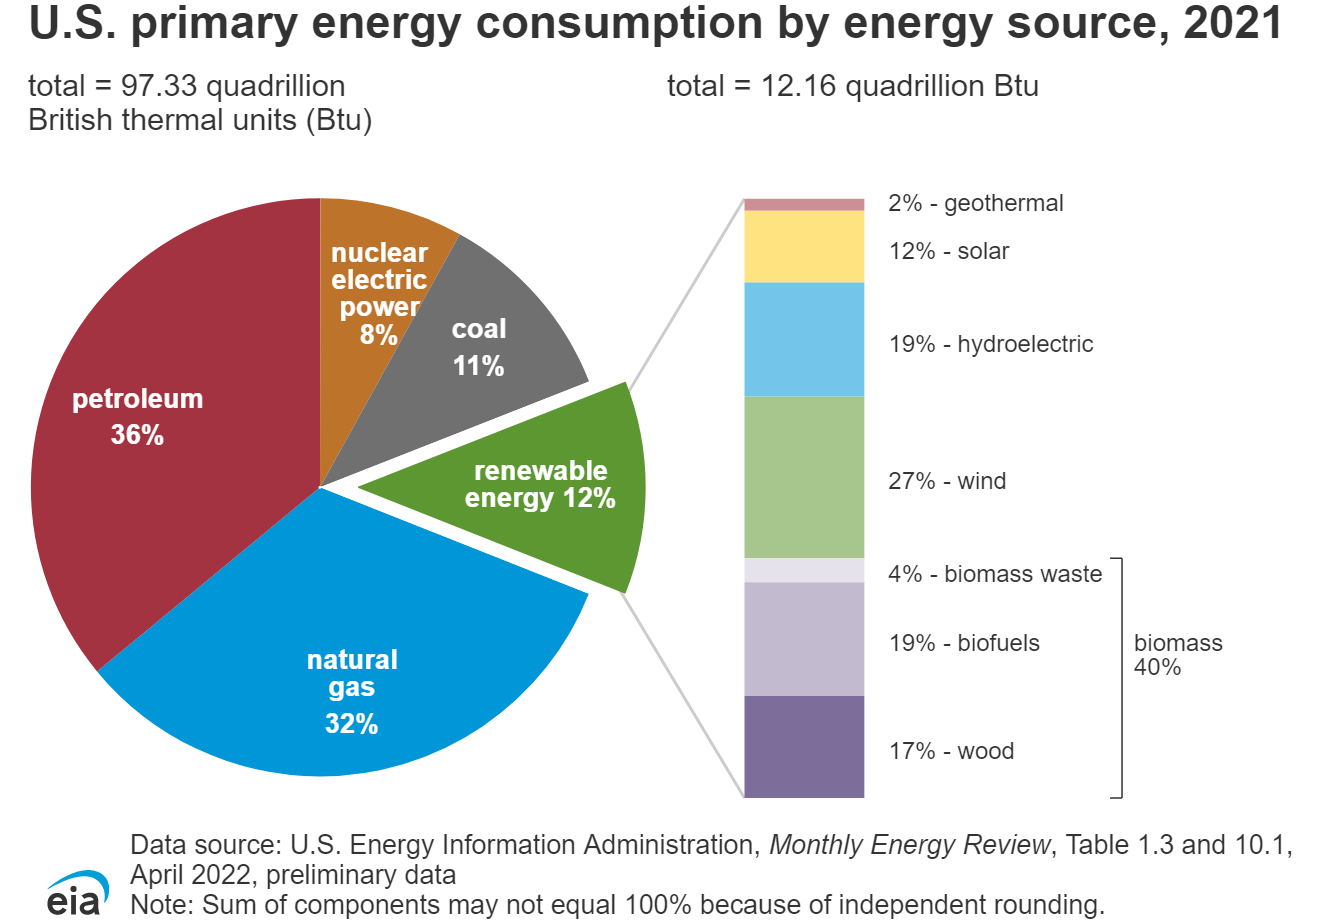
Figure 5, below, illustrates the historical energy consumption in the United States by source. Notice the decline in the use of coal, while natural gas and renewables consumption are increasing. The increase in natural gas consumption has much to do with the following: the current historically low prices resulting from the huge amount of new shale gas being produced, and new tighter emissions standards being imposed on coal-fired power plants. If you are interested to see the historical trend by the source, individually, click on the following link, it is a graph showing the history of energy consumption in the United States from 1750 to 2015 [15].
Alternative energy sources will continue to grow as long as economically feasible, and especially if government subsidies are available to support their production (e.g., – ethanol). Note that EIA publishes annual reports for the US Energy Outlook, which include future projections. If you are interested in the projected energy outlook in the United States, click on the EIA Annual Energy Outlook [17]. You may notice EIA (Energy Information Administration) is projecting a significant increase in production and consumption from renewables by 2050. While, nuclear production is shown as being stable, and with the negligible emissions they produce.
In addition, as far as natural gas goes, an increase is indicated. The residential use of heating oil and propane is steadily declining as conversions to natural gas steadily continue. (50% of US homes use natural gas for space heating and hot water.) Add to that the retirement of coal plants, or the outright switching from coal to natural gas, and growth in the consumption of natural gas will naturally occur.
The future consumption of oil and “other liquids” will be interesting to observe as well. With automobile efficiency improving and electric cars gaining in popularity, this segment should decline. Also, there are decades-old power plants, mostly in the Northeastern US, that use fuel oil. These, too, will become obsolete or convert to natural gas. (The Northeast US is also the world’s largest consumer of heating oil.)
There should also be a more dramatic decline in the use of coal than what is shown above, as emissions restrictions and lower natural gas prices make coal less economic to use.
The fuels we will study in-depth, natural gas and “oil and other liquids,” comprise more than half of the projected total US energy consumption profile, thus making it crucial to understand the logistics and “value chain” of these fuel sources.
The following chart illustrates the various types of energy in the US and the corresponding consumption types.

In Figure 6, above, we see the energy sources matched-up with their respective categories of consumption. Both petroleum and natural gas are used in each sector of consumption, while coal is utilized in only industrial, residential (this would have to be a very small amount), and power generation. Nuclear energy is strictly used for electric power generation, and renewables can be consumed in all categories but contribute very little to each on a percentage basis.
The sources and uses of energy are important for the overall understanding of the impact of supply, demand, and pricing on the macroeconomic environment. Everything depends on energy, and understanding these interrelationships can help us manage our supply needs and price exposure.
Global energy use and trade
So far, we have examined the energy portfolio of the United States, and next, we will take a look at the global energy production and consumption as well as the energy profiles of several major countries.
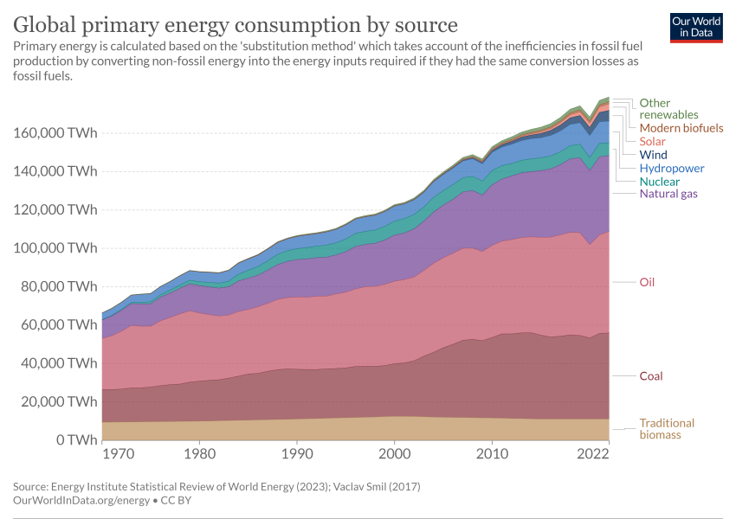
Figure 7 shows the total energy consumption of the world by sources over two centuries. Until the mid-19th century, traditional biomass, like the burning of wood, crop waste, or charcoal, was the dominant source. With the Industrial Revolution, coal replaced traditional biomass as the dominant one, and then was replaced by oil in the 1960s. Natural gas, nuclear, and hydropower were added to the mix around the same period. Solar and wind came much later in the late 1980s. A fast expansion of natural gas and renewables has been ongoing since the 21st century. Compared to the energy portfolio of the U.S., the worldwide reliance on fossil fuels is much greater, where more than 77% of energy demand is met by oil, natural gas, and coal. It is also worth noting that traditional biomass is still one of the major sources for many developing regions.
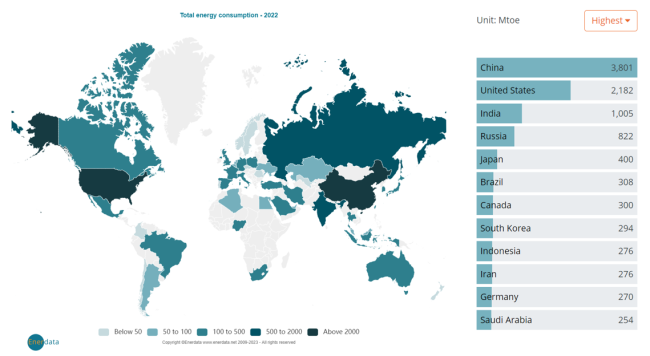
Figure 8 shows the 2021 energy consumption by country. Here we briefly introduce energy portfolios and energy import/export of several major counties/regions.
- China is the top energy consumer in the world, due to its 1.4 billion population and economic growth in recent decades. Coal is the major energy source for China, mainly for electricity generation, steel and cement manufacturing, and residential heating. It is the second-largest crude oil consumer (after the U.S.) and third in natural gas. Due to limited domestic supply, it is the top importer of both crude oil and natural gas. Renewables are developing fast in China, helping its target of reaching CO2 emissions peak before 2030 and achieving carbon neutrality by 2060.
- India is the third energy consumer, with a similar size of population as China. Coal is its largest source, but not as large as China. Traditional biomass is still contributing to a substantial but falling portion of energy, while renewables are supplying a very minor portion of energy. India is the third in crude oil consumption and import, while not in the top 10 in terms of natural gas consumption and import.
- Japan, with 126 million population, ranks fifth in energy consumption. Nuclear was one of its major sources, providing up to 13% of total consumption, but has fallen to 3% after the earthquake and tsunami near Fukushima. The share of nuclear was replaced by natural gas, oil, and renewables. Currently, petroleum is its major energy source, providing 40% of energy consumption. As an island country, Japan heavily relies on imports for its fossil fuel supply. It is the fifth in crude oil import and the second in natural gas import.
- European Union (EU) is another region that heavily depends on energy imports to meet its demand. It is worth noting that energy profiles vary across different countries. For example, renewables account for over 35% energy supply in Finland, Denmark, and Sweden while nuclear is the major source (40%) in France. Overall petroleum is the major source for the EU (34.5%) and natural gas comes after (23.7%) as of 2020. A substantial amount of energy products was imported from Russia, but now EU is exploring other sources like the U.S.
- Russia is the fourth in energy consumption, and contrary to previous energy net import countries and regions, it is the second-largest country in crude oil export (after Saudi Arabia) and the largest in natural gas export as of 2021. Russia has the largest proven natural gas reserves in the world and natural gas is also its major source of energy (51% of consumption).
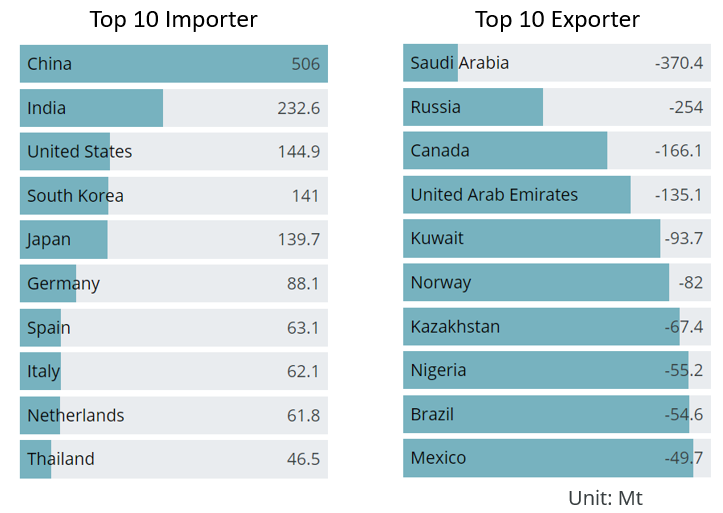
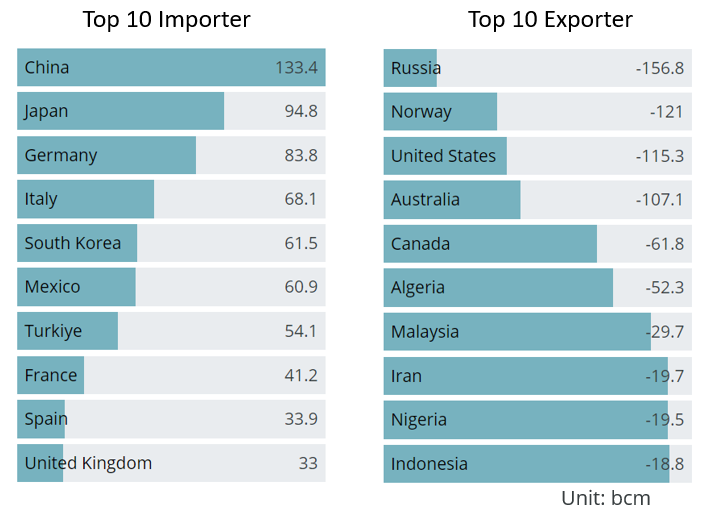
Figures 9 & 10 shows the top 10 importer and exporter countries of crude oil and natural gas. Top importers are major economies while exporters come from all over the world. As we will see in the following lessons, these countries will have significant impacts on the demand and supply in the world energy commodity market.
Mini-Lecture: Alternate and Renewables
So, what are the “renewables and alternate” sources of energy? As previously mentioned, “renewable [20]” energy sources are those which can be replenished over and over again, such as solar [3], hydro [2], wind [1], biomass [5], biofuels [11], and geothermal [4]. “Alternate” energy sources are those which are not the traditional fossil fuels or nuclear power. These include the renewables: hydro, wind, solar, biomass, biofuels, and geothermal.
As stated previously, it will take a long time for renewable and alternate energy sources to make a significant dent in the US reliance on fossil fuels. In the interim, the fuels we will study in depth, primarily natural gas and crude oil, will continue to be produced and consumed in substantial quantities. Natural gas, as the cleanest burning of the fossil fuels, represents the “bridge” fuel until renewable and alternate energy can be produced in sufficient quantities to wean us of our dependence on fossil fuels.
The following 8:57 minute "mini-Lecture" will cover Alternate and Renewable energy sources in more detail. Mini-Lectures such as this will be provided in most Lessons and will supplement the textual lesson or be the lesson itself. The slides can be found in the Modules under Lesson 1: The Energy Industry - Overall Perspective in Canvas.
Click for a transcript.
Summary and Final Tasks
Key Learning Points: Lesson 1
Energy consumption in the United States takes many forms. The traditional “fossil fuels,” such as coal, oil, natural gas, gasoline, and other refined products and, natural gas liquids, do not have a limitless supply.
Renewables, however, such as hydro, wind, solar, biomass, biodiesel and geothermal, are self-replenishing.
Alternative fuels comprise the non-traditional energy sources and include nuclear and fossil fuels. Alternative fuels represent the smallest amount of energy consumed in the US and are not expected to expand greatly over the next 20-25 years. And, for many alternative fuels, government subsidies are essential for them to be produced economically.
In the interim, fossil fuels such as natural gas and crude oil will continue to grow in usage and importance. Their supply, demand, and pricing will have a great impact on the US economy for decades to come.
Now that we have examined production and consumption in the United States as well as the energy “mix,” we will focus on the fuel sources that comprise over 57% of the energy used in this country. Crude oil, with refined products, and natural gas and related natural gas liquids (NGLs), make-up this large sector. The factors that influence their supply and demand are varied and ever-changing. Besides the obvious impact of weather, the economy, the US dollar, and the global geopolitical conditions can all influence energy commodities and affect their prices.
Reminder - Complete all of the Lesson 1 tasks!
You have reached the end of Lesson 1. Double-check the list of requirements on the first page of this lesson to make sure you have completed all of the activities listed there before beginning the next lesson. (To access the next lesson, use the link in the "Lessons" menu.)


