Bar Plots: Multiple Variables
Bar Plots: Multiple Variables
 Read It: Bar Plots with Multiple Variables
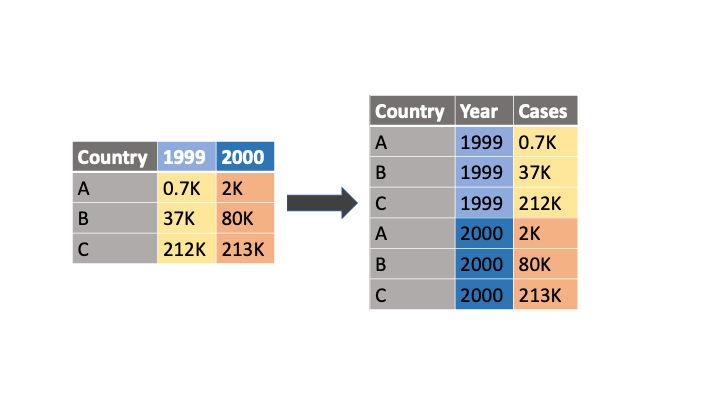
In this lesson, we are going to demonstrate how to create bar plots using ggplot/Plotnine. First, however, we will need to prepare the dataset for plotting. This will involve importing the data and melting the data to get it into "long" form. In other words, the melt command will convert the column names of select variables into their own categorical variable. For example, the code below will convert the data as shown in the figure.
1 | df.melt(id_vars='Country', value_vars=['1999', '2000'], var_name='Year', value_name='Cases') |
Below, we will demonstrate this command with the Emissions Scenarios dataset.
 Watch It: Video - Importing and Cleaning the Data for Visualization (5:14 minutes)
Below, we will use the melted dataframe to create a bar plot with three variables.
Watch It: Video - Bar Plots with Multiple Variables (4:54 minutes)
 Try It: Apply Your Coding Skills in Google Colab
- Click the Google Colab file used in the video is linked here [2].
- Go to the Colab file and click "File" then "Save a copy in Drive", this will create a new Colab file that you can edit in your own Google Drive account.
- Once you have it saved in your Drive, use the partial code below to create a multiple variable bar plot using plotnine/ggplot.
Note: You must be logged into your PSU Google Workspace in order to access the file.
1 2 3 4 5 | from plotnine import * # import the library # fill in the blank (...) to plot a bar plot with 'Category' on the y-axis, 'Emissions' on the x-axis, and 'Source' as the fill variableggplot(emsc_melt) + ... |
Once you have implemented this code on your own, come back to this page to test your knowledge.
 Assess It: Check Your Knowledge