Lesson 10 - National and Global Markets for Petroleum and Natural Gas
Lesson 10 Overview
Lesson 10 Overview
This lesson will introduce you to the global markets for the petroleum commodities (crude oil, refined products, and natural gas). These commodities, along with coal, are commonly called fossil fuels. The inherent value of these fuels comes from their relative ease of transportation, their energy density, and their ability to be inventoried and dispatched as needed to meet demand. These characteristics should always be kept in mind when trying to understand the challenges associated with a transition away from fossil fuels.
There is a great deal of complexity in the world of petroleum markets. There are entire 3- and 6-credit courses offered on the subject. We will cover a lot of ground in this single module. There is also supplementary material from the previous iteration of EME 801 (written and developed by Dr. Seth Blumsack) which is attached as an appendix. You are strongly encouraged to read this material and digest it, as further background on energy markets provides great insight to inform decisions that each of you will be called on to make.
Learning Outcomes
By the end of this lesson, you should be able to:
- Discuss topics related to national and global markets for petroleum and natural gas
- Use the NYMEX (CME Group) website to construct a forward curve for crude oil, refined products and natural gas
- Identify the role that the “Henry Hub” plays in North American natural gas pricing
- Define “wellhead” and “citygate” prices for natural gas, and explain why these prices are usually different
- Calculate correlations between natural gas prices in different regions of the United States, using data from the Energy Information Administration
- Develop the Fossil Fuel Market Sensitivities section of your project
Reading Materials
Aside from the online materials, you will need to access the websites of the EIA and NYMEX (CME Group).
- S. van Vactor, Flipping the Switch: The Transformation of Energy Markets [1]. Note: Chapter 5 of this reading has a nicely detailed discussion of the development and structure of markets in both the US and Europe.
- Hall and Day, Revisiting the Limits to Growth Under Peak Oil [2]
- Episodes 1, 2, and 3 of the podcast Planet Money Buys Oil [3]
- U.S. Energy Administration (2022), Natual Gas Explained [4]
- The Heart of the Matter: Everything You Need to Know about the Cushing Oil Hub [5]
- RBN Energy (2015), Henry the Hub, I am, I am [6] - Evolution of the Natural Gas Benchmark
- RBN Energy (2022), The Way She Moves [7]- A Deep Dive into the Process, Quirks and Idiosyncrasies of U.S. Natural Gas Pricing
What is due for Lesson 10?
This lesson will take us one week to complete. Please refer to the Course Calendar for specific due dates. See the specific directions for the assignments below.
- Complete all of the Lesson 10 readings and viewings, including the lesson content
- Participate in the Zoom discussion
- Project work: Fossil Fuel Market Sensitivities
Questions?
If you have any questions, please post them to our Questions? discussion forum (not email). I will not be reviewing these. I encourage you to work as a cohort in that space. If you do require assistance, please reach out to me directly after you have worked with your cohort --- I am always happy to get on a one-on-one call, or even better, with a group of you.
Introduction to Global Markets for Crude Oil
Introduction to Global Markets for Crude Oil
Crude oil is one of the most economically mature commodity markets in the world. Even though most crude oil is produced by a relatively small number of companies, and often in remote locations that are very far from the point of consumption, trade in crude oil is robust and global in nature. Nearly 80% of international crude oil transactions involve delivery via waterway in supertankers. Oil traders are able to quickly redirect transactions towards markets where prices are higher.
Global supply and demand determines prices for fossil fuels. Events around the world can affect our prices at home for oil-based energy such as gasoline, heating oil and natural gas. Political unrest in some oil-producing nations also contributes to high prices - basically, there is a fear that political instability could shut down oil production in these countries. OPEC, the large oil-producing cartel, does have some ability to influence world prices, but OPEC's influence in the world oil market is shrinking rapidly as new supplies in non-OPEC countries are discovered and developed.
Our discussion of the world market for crude oil will be broken into a few sections. We will first focus on what's called the "spot" and "forward" market for crude oil. The term "spot market" generally refers to a short-term commodity transaction where the physical commodity changes hands very soon after the seller receives payment. Most retail consumer purchases are examples of spot transactions. When I buy a newspaper at the convenience store or a slice of pizza at the pizza shop, I get the product right after I pay for it. Forward markets refer to contracts where buyers and sellers agree up-front on a price for a commodity that will be delivered at some point in the future. When I subscribe to the newspaper and have it delivered to my house every day, I am signing a type of forward contract with the newspaper company. When I call the pizza shop and ask them to deliver a pizza to my house one hour or one day from now, then I am also engaging in a type of forward contract.
We will also discuss "futures" markets for crude oil. The difference between futures and forward markets can be confusing at times. The primary difference is that a futures contract is a highly standardized commodity sold through a financial exchange, rather than a highly customizable contract bought and sold through one-on-one transactions. Futures markets do have the advantage that they have been able to attract many more buyers and sellers than forward markets.
Finally, we will spend time in this lesson learning where to find data on global oil markets and discussing the issue of "peak oil" - whether world oil reserves are dwindling or whether there is actually enough to support rising oil consumption over the coming decades. There is more data on the web than you might think, but the difficulty is in knowing where to find exactly what you are looking for.
Beginnings of a Market to 1970
Beginnings of a Market to 1970
Through much of the first half of the 20th Century, the United States was the dominant world oil producer and was, in fact, a net exporter. By the early 1900s, a bilateral "world" market for oil had developed, but the world price was simply the U.S. price plus the cost of freight. Russia's production did not lag far behind U.S. production during this time, but their relatively closed economy precluded much trade with the rest of the world. Table 10.1 shows the leading crude oil producers up to 1970.
| Year | U.S. | Mexico | Venezuela | Russia | Indonesia | Middle East |
|---|---|---|---|---|---|---|
| 1910 | 575 | 10 | 0 | 170 | 30 | 0 |
| 1920 | 1,214 | 430 | 1 | 70 | 48 | 31 |
| 1930 | 2,460 | 408 | 374 | 344 | 114 | 126 |
| 1940 | 3,707 | 12 | 508 | 599 | 170 | 280 |
| 1950 | 5,407 | 198 | 1,498 | 729 | 133 | 1,755 |
| 1960 | 7,055 | 271 | 2,854 | 2,957 | 419 | 5,255 |
| 1970 | 9,637 | 487 | 3,708 | 6,985 | 854 | 13,957 |
Unlike OPEC, the market for crude oil in the U.S. was generally competitive since mineral rights did not belong to the state but to the landholder. If it was under your property, you owned it. Since oil (and gas) reservoirs often crossed property boundaries, "rights" were hard to specify and enforce. If an oil reservoir was split between my property and yours, the money would flow to whoever could suck all the oil out first. Overdrilling was the result, as was the birth of "wildcatters," individuals who would dig oil wells on unproven land, hoping to strike it rich.
During the period up to 1970 (and even beyond), the "market" for crude oil was characterized largely by within-company exchanges. Most oil companies were "vertically integrated," meaning that the company operated all the way down the value chain - crude oil would go from the field to the refiner to the marketer (and then to the retailer, like a gas station) while staying within company borders. There was a small number of market transactions at what were referred to as "posted prices." Posted prices are essentially fixed offer prices posted by companies in advance of transactions. Posted prices were originally painted on wooden signs and hung on posts (hence the name), each remaining in effect until it was replaced by a new one. Now, posted prices take the form of electronic bulletins issued by major oil producers. (The spot market for crude oil is still not very large, so posted prices are not always representative of market conditions.) An example of a posted price bulletin is shown in Figure 10.1.
OPEC Seizes Control: The Energy Crisis and the Arab Oil Embargoes of 1973 and 1979
OPEC Seizes Control: The Energy Crisis and the Arab Oil Embargoes of 1973 and 1979
OPEC was formed in 1960, largely as a way for governments of oil-producing nations to capture oil revenues that, at the time, were going to foreign-producing firms. The motivation for founding OPEC was not market power, but rather a tax dispute. Oil was originally taxed as income. Thus, as prices fell with increased competition, the tax collected by the oil-producing nations also fell. The members of OPEC decreed that oil taxes would now come in the form of excise taxes, levied on a per-barrel basis. In other words, they succeeded in separating tax revenue from the value of the taxable commodity. The rise in oil prices around this time (see Table 10.1 on the previous page) reflects the fact that spot prices reflected taxes collected by OPEC governments, rather than market transactions since excise taxes act as a floor on prices. As a cartel attempting to coordinate actions among its members, OPEC has had only mixed success, as we will discuss below. Two incidents, one in 1973 and one in 1979, however, did impact the world oil market substantially, as shown in the middle section of Table 10.1, and cemented OPEC's reputation into place for the following decades.
In 1971 and 1972, fears began to grow in the developed world that if we were not already running out of energy supplies, we would soon, as additional nations adopted Western industrial structures. Then-president Richard Nixon appeared particularly concerned that Arab nations might impose a selective embargo on the United States for its pro-Israel policy. Such a selective embargo could not have worked; the world crude-oil market was too large, and replacement oil could have been found in too many places. The energy crisis was largely hysteria - production was increasing with no end in sight, and imports, particularly from Saudi Arabia, were rising.
It is important to separate the energy crisis from the Arab oil embargo of 1973. The two are separate but related events. The Arab oil embargo was successful only because of the price controls and rationing that occurred as a result of the energy crisis. It is possible (but perhaps a stretch) that the high prices and lines at the gas pumps may have happened even without cutbacks in supply from the Arab oil producers. The oil embargo officially started in October 1973, when a group of Middle East countries announced a 5% production cut per month as a reaction to the Yom Kippur War between Egypt and Israel (or, more precisely, Israel's victory in that war, aided by nations such as the United States). The embargoing nations said that the cuts would be restored once Israel withdrew from Palestine and Jerusalem.
The oil embargo of 1979 was not really much of an embargo at all, at least not in the sense of the 1973 embargo. The output cuts in 1979, however, were much larger, and the overall effect was more lasting than its predecessor six years earlier. The primary player in the 1979 embargo was Saudi Arabia, which cut production following a strike by Iranian oil workers. The production cuts were an attempt to raise prices. This they did, but they also reawakened fears of an energy crisis, with politicians muttering I-told-you-sos about how the world was in for a severe energy shortage. The cutbacks by Saudi Arabia only lasted three months, but the damage was done, and Saudi Arabia was recognized as the only single player that had the capability to move the world oil market. The following year, the Saudis found themselves in the enviable position of being able to raise prices without lowering output.
Current World Oil Market
Current World Oil Market
The current market for crude oil is truly global in reach. Oil cargoes move with relative ease between countries and across oceans. While most U.S. oil imports come from a relatively small group of countries, it is misleading to think that only those countries have an impact on oil prices in the United States. Because oil can and does move so freely from one area to another across the globe, it is better to think of the oil market as a global pool, rather than as a network of suppliers and buyers. If one supplier shrinks the overall depth of the pool by withholding supply (or floods the pool by producing a lot of oil), then the impact will be felt uniformly throughout the pool.
At this point, you are encouraged to listen to episodes 1, 2, and 3 of the Planet Money Buys Oil podcast [3]. This podcast is very entertaining and will give you a sense of what the "physical" market for crude oil is like. The physical market is what we've been talking about so far in this lesson - the part of the oil market where buyers and sellers exchange money for crude oil. In the next part of the lesson, we'll move into the "futures market" for crude oil, which is where all sorts of different market players hedge and speculate on the physical price of crude oil. Episode 3 gets into the refining area which we are also covering here.
The pricing of oil is determined largely by a mix of fundamental supply and demand factors, as well as expectations. How much of any given oil-price movement is due to each of these three factors is an eternal mystery that keeps a small army of editorial columnists and television talking heads in business. The supply-demand balance is perhaps the easiest piece to explain - when demand is high (for example, during the wintertime when heating oil demands are high or during the summer when people tend to drive more often and further distances), consumers are willing to pay more for refined petroleum products, and higher-cost oil supplies must be brought online. Thus, the price goes up. Similarly, when accidents, political strife, or war keep supplies offline, higher-cost replacements must be found, and the price goes up. Expectations can play a large role in pricing outcomes in the oil (as well as gas and refined products) markets. The role of people’s expectations can be traced back to OPEC's successes in the 1970s in increasing world oil prices, even for brief periods. Believing that OPEC had the power to do pretty much whatever it wanted, market participants began engaging in a series of self-fulfilling prophecy games. They worked something like this. First, one or more market participants would believe that OPEC would act to increase prices or reduce supply. Afraid of getting caught short or unable to fulfill contracts, stockpiling commenced, pushing up spot prices. Thus, all OPEC needed to do was cause panic in the markets by spreading rumors of policy changes. The gains were nearly always short-lived as the high cost of inventories would result in sell-offs, bringing oil prices down to pre-panic levels. Nowadays, broader geopolitical concerns, particularly in the Middle East, Africa, and Russia/Ukraine, have replaced the grumblings of OPEC as the source for expectations-induced spikes in fossil fuel prices including natural gas.
OPEC was mentioned earlier as an entity that has been able to exert substantial influence on global markets for crude oil. OPEC operates as a cartel - a group of producing countries that attempt to coordinate supply decisions in order to exert some influence on prices. OPEC does not try to set prices directly, as is often believed. What OPEC countries try to do is to expand or contract oil production in order to keep the world price within some band that the countries collectively deem desirable.
OPEC's actual ability to manipulate oil prices is not all that clear, and its influence has dwindled as more "unconventional" petroleum resources have been developed, including the oil sands in Canada and shale oil in the United States. Most cartels are difficult to sustain since each member of the cartel has the incentive to cheat - in OPEC's case, this means that countries have often produced more oil than they were supposed to under the quota system, as shown in Figure 10.2 (the most consistent cheater seems to have been the country of Algeria). Even during the 1973 embargo, none of the OPEC nations approached the formal 5% production cut mentioned in the embargo. Saudi Arabia's production decreased by 0.8%. Iraq and Oman saw the biggest percentage cuts in production at 1%. Prices did indeed go up, but largely as a result of fear and higher taxes rather than actual supply shortages. The actual production cuts lasted only three weeks; the embargo fell apart in December when Saudi Arabia raised production.
NOTES:
- Roll your mouse over the name of a country to highlight the plotted line for that country.
- Roll your mouse over the plotted lines to reveal data values.
- Click on country names to hide or reveal the data from the graph.
While OPEC has been viewed historically as a cartel that keeps oil prices high, its members have, more recently, probably been at least partially responsible for the rapid decline in oil prices. The Economist has a nice and recent article [10] describing the factors that have been contributing to the slide in oil prices. This has been partly due to sluggish economies in developing countries, energy efficiency in rich countries, the boom in shale-oil production in the United States (which we will come back to in a few weeks), and a strategic decision by Saudi Arabia to maintain high oil production levels even in the face of low prices (this is perhaps an attempt to inflict economic pain on the shale-oil business in the U.S.).
Earlier, it was discussed that when demand increases, higher-cost supplies must be brought online to meet that higher demand. Prices for oil have certainly been on a roller-coaster ride over the past few years. Does this mean that a few years ago, we thought all of the cheap oil in the world was gone, but we have now discovered new supplies of cheap oil? And if not, then what explains the price movements that we have seen in the oil market in recent years?
The answer depends on some understanding of the cost of supplying crude oil. Figure 10.3 provides a rough idea of the cost of extracting different types of oil resources. The low-cost resources are conventional oil fields that have been operating for decades. The higher-cost resources are so-called "unconventional" sources of oil, including deepwater or Arctic drilling; the oil sands of Alberta, Canada; and extraction of oil from shale formations (one of the best-known examples is the Bakken shale in North Dakota, whose extraction costs are somewhere in the lower end of the range shown - perhaps around $50 to $60 per barrel). If the producers of conventional oil were to flood the market, then the price would drop so low that unconventional players would be forced to shut down. This would be good for consumers right now, but bad for the producers of conventional oil (and eventually for consumers), since there would be less oil to sell later on. Thus, conventional oil producers hold some output back, leaving the unconventional producers to serve the leftover or "marginal" demand. This is good for conventional oil producers in both the short and long term (because they earn larger profits), but is bad for consumers in the short term. (In the long term, this strategy keeps prices from rising to even higher levels in the future.)

Part of the reason that crude-oil prices have been so high for so long is the increased role that unconventional oil is playing in world oil supply. This is due in some part to the natural decline in output that is expected from conventional oil fields as they mature (more on this later when we talk about "peak oil"). The growth in unconventional oil supplies has been so rapid that countries with large reserves of unconventional oil, such as the United States, have become large oil producers in a very short period of time.
Future Markets for Crude Oil
Future Markets for Crude Oil
Not much has been made here of long-term contracts for oil. This is because up until the early 1980s there were not very many. Production continued as long as the extracted oil could find a home in the spot market. The oil-producing countries, recognizing their market power, either implicitly or explicitly avoided long-term contracts in pursuit of volatile and largely lucrative spot prices.
We have already explained the difference between spot markets and forward markets. Both are "physical" markets, in that their main purpose is to exchange commodities between willing buyers and sellers. A spot or forward transaction typically involves the exchange of money for a physical commodity. Within the past few decades, entities with sufficiently large exposure in the physical market (i.e., the need to buy or sell lots of physical barrels of crude oil) have developed financial instruments that can help them "hedge" or control price volatility. By far the most important of these financial instruments is the "futures" contract.
Futures contracts differ from forward contracts in three important ways. First, futures contracts are highly standardized and non-customizable. The NYMEX futures contract is very tightly defined, in terms of the quantity and quality of oil that makes up a single contract, the delivery location and the prescribed date of delivery. Forward contracts are crafted between a willing buyer and seller and can include whatever terms are mutually agreeable. Second, futures contracts are traded through financial exchanges instead of in one-on-one or "bilateral" transactions. A futures contract for crude oil can be purchased on the NYMEX exchange and nowhere else. Third, futures contracts are typically "financial" in that the contract is settled in cash instead of through delivery of the commodity.
A simple example will illustrate the difference. Suppose I sign a forward contract for crude oil with my neighbor, where she agrees to deliver 100 barrels of crude oil to me in one month, for 50 dollars per barrel. A month from now arrives and my neighbor parks a big truck in my front yard, unloads the barrels, and collects 5000 dollars from me. This is a "physical" transaction. If I were to sign a futures contract with my neighbor, then in one month instead of dropping off 100 barrels of crude oil in front of my house, she pays me the value of that crude oil according to the contract (this is called "settlement" rather than "delivery"). So, I would receive 5000 dollars. I could then go and buy 100 barrels of crude oil on the spot market. If the price of crude oil on the spot market was less than $50 per barrel, then in the end I would have made money. If it was more than 50 dollars per barrel, then in the end I would have lost money, but not as much as if I had not signed the futures contract.
This simple example illustrates the primary usefulness of futures contracts, which is hedging against future fluctuations in the spot price. A hedge can be thought of as an insurance policy that partially protects against large swings in the crude oil price.
NYMEX (now called the "CME Group") provides a platform for buying and selling crude oil contracts from one month in advance up to eight and a half years forward. The time series of futures prices on a given date is called the "forward curve," and represents the best expectations of the market (on a specific date) as to where the market will go. The value of these expectations, naturally, depends on the number of market participants or "liquidity." For example, on a typical day, there are many thousands of crude oil futures contracts traded for delivery or settlement one month in advance. On the other hand, there may be only a few (if any) futures contracts traded for delivery or settlement eight years in advance.
The NYMEX crude oil futures contract involves the buying and selling of oil at a specific location in the North American oil pipeline network. This location, in Cushing Oklahoma, was chosen very specifically because of the amount of oil storage capacity located there and the interconnections to pipelines serving virtually all of the United States.
There is a wealth of data out there on crude oil markets. The following video will help orient you toward a website where you can find information on crude oil prices, demand, shipments and other data. Although this is a U.S. website, there is a good amount of data on global markets.
Video: Crude Oil Futures (4:01)

If you look at Figure 10.4, you might notice that the price of crude oil generally declines as you move farther out into the future. This is called "backwardation." The opposite, in which the price of crude oil increases as you move farther out into the future, is called "contango." In general, we expect the crude oil market to be in backwardation most of the time; that is, we expect the future price to be lower than the current (spot) price. This can be true even if we expect demand for crude oil to increase in the future. Why would this be the case? If demand is expected to rise in the future, shouldn't that bring the market into contango?
Sometimes this does happen. Most often, the crude oil market is in backwardation because storing crude oil generally involves low costs and has some inherent value. Suppose you had a barrel of crude oil. You could sell it now, or store it to sell later (maybe the price will be higher). The benefit to storing the barrel of oil is the option to sell it at some future date, or to keep on holding on to the barrel. This benefit is known as the "convenience yield." Now, suppose that hundreds of thousands of people were storing barrels of oil to sell one year from now. When one year comes, all those barrels of oil will flood the market, lowering the price (a barrel in the future is also worth less than a barrel today; a process called discounting that we will discuss in a later lesson). Thus, because inventories of crude oil are high, the market expects the price to fall in the future.
The ability to store oil implies that future events can impact spot prices. A known future supply disruption (such as the shuttering of an oil refinery for maintenance) will certainly impact the futures price for oil, but should also impact the spot price as inventories are built up or drawn down ahead of the refinery outage.
Are We Running Out of Oil?
Are We Running Out of Oil?
Our transportation systems are highly dependent on petroleum. High and volatile prices for oil (and at the pump) naturally give rise to suggestions that oil production has peaked, or that we are running out of oil. Concern over oil supplies is not new. Looking back over the past hundred years, there have been five or six projections [12] from governments, researchers and other groups suggesting that the world was about to run out of oil, precious metals or other valuable commodities.
In the 1950s, a geologist named M. King Hubbert looked at oil production data from all of the major oil-producing countries in the world (at that time). Based on his statistical analysis of the data, he projected that U.S. oil production would peak in the 1970s and that world oil production would peak during the first decade of the 21st century. These projections came to be known as "Hubbert's Peak." And it turns out that Hubbert's projections were highly accurate - U.S. oil production did peak in the 1970s, and the collection of oil-producing countries that Hubbert originally studied did see their collective oil production peak in the early 2000s. So, maybe Hubbert had a point, and maybe there is something to the "peak oil" paranoia.
The reality of the "amount of oil" is more complex. When Hubbert made his predictions in the 1950s, the oil industry was still in its technical infancy. Most oil production came from so-called "elephant" oil fields, tremendously large reservoirs of easily-accessible oil. To imagine what these "elephant" fields were like, think about the theme song to the Beverly Hillbillies [13], when Jed Clampett shoots a hole in the ground and oil comes spouting up. The elephant oil fields that represented most oil production during Hubbert's time were basically like "Jed Clampett oil." What Hubbert was predicting was really the decline in Jed Clampett oil.
While Hubbert was right about Jed Clampett oil, his analysis did not consider the advances in technology that would make extraction of oil possible from less-accessible reservoirs. Nor did he consider that a rise in the price of oil would make oil extraction from so-called "unconventional" reservoirs profitable enough to undertake. Deepwater drilling (like in the Gulf of Mexico), the Canadian oil sands, and even extraction of oil from shales via hydraulic fracturing in North Dakota are all examples of unconventional oil production.
In fact, most geologists now believe that the amount of unconventional oil is much larger than all of the Jed Clampett oil fields put together. A recent study from University of California at Berkeley ("Risks of the Oil Transition" by Alex Farrell and Adam Brandt, Environmental Research Letters (2006)) estimated that the world has used up only about 5% of known technically recoverable oil reserves. A future supply curve for liquid hydrocarbons (crude oil and usable synthetic liquid fuels), as shown in Figure 10.5 and adapted from the Brandt/Farrell paper, demonstrates this shift from "conventional" resources (i.e., Jed Clampett oil) to unconventional resources. These unconventional resources include the oil sands for which Alberta is now well known; bitumen-laden "heavy oils" (for which Venezuela is also known); enhanced oil recovery from conventional wells (EOR); synthetic fuels manufactured using natural gas or coal as a feedstock; and oil shales, which includes both naturally occurring deposits of oil in low-porosity shale formations (typically requiring hydraulic fracturing to extract) and hydrocarbon-rich shales that are used to produce a synthetic crude oil.

The reality is not that we are "running out of oil," but rather that we are transitioning from a period of easily-accessible oil at low prices to an era of increasingly unconventional production, which has higher costs. Companies will not try to develop these unconventional resources unless consumers are willing to pay the price (economic and environmental) or governments heavily subsidize oil production or consumption. So far, the world has found a way to consume plenty of $100-per-barrel oil. At some point, unconventional oil exploration will get so expensive that consumers will look to lower-cost alternatives. Oil will price itself out of the market before the world truly runs out. The increasing popularity of hybrid vehicles, electric vehicles, bicycle transportation in urban areas and even natural gas vehicles are examples of such a shift, even if government policies are required to affect the decisions that consumers make.
Sheik Ahmed Zahi Yamani, the longtime Saudi oil minister and a key founder of OPEC, has perhaps summed up the world oil market the most nicely. He said, "The Stone Age came to an end, not for lack of stones, and the oil age will end, but not for lack of oil."
The Process of Crude Oil Refining
The process of crude oil refining
Despite all of the attention that it gets, no one actually wants crude oil – what people want are the various products that are derived from crude oil. These products include not only gasoline, heating oil, and so forth (which will be the focus of our discussions) but everyday consumer items like plastics, long underwear, and crayons. In this lesson, we’ll discuss markets for energy commodities that are refined from petroleum. While conditions in the crude oil market are highly influential in determining the prices of these products, in some sense each petroleum product market has a life of its own.
Once crude oil is extracted from the ground, it must be transported and refined into petroleum products that have any value. Those products must then be transported to end-use consumers or retailers (like gasoline stations or the company that delivers heating oil to your house, if you have an oil furnace). The overall well-to-consumer supply chain for petroleum products is often described as being segmented into three components (shown graphically in Figure 10.6).
- Upstream activities involve exploring for crude oil deposits and the production of crude oil. Examples of firms that would belong in the upstream segment of the industry include companies that own rights to drill for oil (e.g., ExxonMobil) and companies that provide support services to the drilling segment of the industry (e.g. Halliburton).
- Midstream activities involve the distribution of crude oil to refiners; the refining of crude oil into saleable products; and the distribution of products to wholesalers and retailers. Examples of firms that would belong in the midstream segment of the industry include companies that transport oil by pipeline, truck or barge (e.g., Magellan Pipeline); and companies that refine crude oil (e.g., Tesoro).
- Downstream activities involve the retail sale of petroleum products. Gasoline stations are perhaps the most visible downstream companies, but companies that deliver heating oil or propane would also fall into this category.

Some companies in the petroleum industry have activities that would fall into upstream, midstream and downstream segments. ExxonMobil is one example of such a firm. Others have activities that fall primarily into only one segment. The KinderMorgan pipeline company is an example of a specialized petroleum firm, in this case belonging to the midstream segment. Many regions have local gas station brands that would specialize in the downstream segment of the industry. One of the best-known regional examples is the WaWa chain of gas stations and convenience stores in eastern Pennsylvania, but large grocery stores and retailers like Costco and Wal-Mart are increasingly involved in downstream sales of petroleum products.
Petroleum refineries are large-scale industrial complexes that produce saleable petroleum products from crude oil (and sometimes other feedstocks like biomass). The details of refinery operations differ from location to location, but virtually all refineries share two basic processes for separating crude oil into the various product components. Actual refinery operations are very complicated, but the basic functions of the refinery can be broken down into three categories of chemical processes:
- Distillation involves the separation of materials based on differences in their volatility. This is the first and most basic step in the refining process, and is the precursor to cracking and reforming.
- Cracking involves breaking up heavy molecules into lighter (and more valuable) hydrocarbons.
- Reforming involves changing the chemical nature of hydrocarbons to achieve desired physical properties (and also to increase the market value of those chemicals).
The link below will take you to a 10-minute video that provides more details on the various refining processes.
Video: Petroleum Refining Basics (10:00)
The first process is known as distillation. In this process, crude oil is heated and fed into a distillation column. A schematic of the distillation column is shown in Figure 10.7. As the temperature of the crude oil in the distillation column rises, the crude oil separates itself into different components, called “fractions.” The fractions are then captured separately. Each fraction corresponds to a different type of petroleum product, depending on the temperature at which that fraction boils off the crude oil mixture.

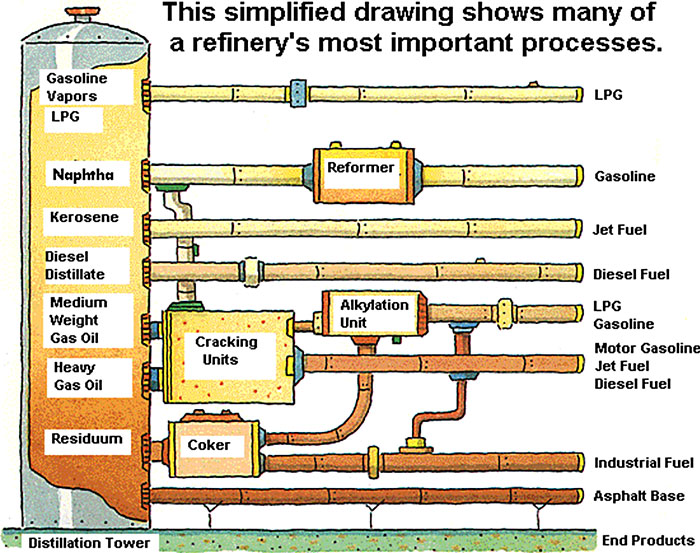
The second and third processes are known as cracking and reforming. Figure 10.8 provides a simplified view of how these processes are used on the various fractions produced through distillation. The heaviest fractions, including the gas oils and residual oils, are lower in value than some of the lighter fractions, so refiners go through a process called “cracking” to break apart the molecules in these fractions. This process can produce some higher-value products from heavier fractions. Cracking is most often utilized to produce gasoline and jet fuel from heavy gas oils. Reforming is typically utilized on lower-value light fractions, again to produce more gasoline. The reforming process involves inducing chemical reactions under pressure to change the composition of the hydrocarbon chain.
The production of final petroleum products differs from refinery to refinery, but in general, the oil refineries in the U.S. are engineered to produce as much gasoline as possible, owing to high demand from the transportation sector. Figure 10.9 shows the composition of output from a typical U.S. refinery.

Nearly half of every barrel of crude oil that goes into a typical U.S. refinery will emerge on the other end as gasoline. Diesel fuel, another transportation fuel, is generally the second-most-produced product from a refinery, representing about one-quarter of each barrel of oil.
Futures Contracts for Refined Petroleum Products
Futures Contracts for Refined Petroleum Products
Gasoline, diesel fuel, and heating oil are volatile commodities – prices fluctuate up and down, sometimes dramatically, as shown in Figure 10.10 which compares spot prices for crude oil with retail prices (i.e., what you would pay at the pump) for gasoline and diesel fuel. Focusing on gasoline and diesel fuel, you will notice that there is some pattern to all of the noisiness in the graphic – prices for both fuels tend to rise starting in the spring and tend to decline in the late summer and fall. This reflects the increased demand for transportation (primarily driving) during the summer months.

Why are prices for petroleum products so volatile? The easy (but not that satisfying) answer is that the price of crude oil can be volatile. In the United States, about 65 cents of every dollar we pay for diesel fuel or gasoline represents the cost of crude oil. The rest represents taxes assessed at the state and federal level. (In European countries, taxes are a much bigger component of gasoline costs.) You can see the volatility visually through the use of the crude oil price graphing tool [18] from the U.S. Energy Information Administration. It allows you to plot the price of West Texas Intermediate (the benchmark crude oil price in the U.S.) on a daily, monthly, and annual basis (depending on how much variability you want to see).
Starting in early 2008, prices climbed very rapidly, reaching nearly $150 per barrel in early July. But by December of that year, the price had dropped by almost 75%! Meanwhile, more recently, the price has dropped to $40 per barrel or even lower! What on earth is going on?
That supply and demand forces were at work is the primary reason, but the nature of the supply and demand forces are worth some time discussing. Suppose that the demand for crude oil or a refined petroleum product were to increase by some amount. How would that demand be met? There are basically two options: existing idle capacity (oil wells or petroleum refineries, for example) could be restarted, or that demand could be met by drawing down crude oil or petroleum product storage. If additional capacity could be restarted, the increase in demand would lead to an increase in the market price due to the higher costs of the capacity brought back online.
But what is the cost of releasing additional supply from storage? Here, we have a tricky economics problem – the actual cost (in accounting terms) of releasing additional supply is probably pretty small. But if you are the owner of some crude oil or petroleum products in storage, if you release supply from storage now, then you can’t release those same barrels again at some point in the future unless you replenish your storage facility (which requires buying oil or petroleum products on the open market and then putting them in storage). So, by releasing from storage now, you are giving up the opportunity for some future profit. This is referred to as “opportunity cost.” (Another term used in the finance field is the “convenience yield.”) Whether the opportunity cost is high or low depends on your expectations about the future price in the crude oil or petroleum products market. If you think demand is going to continue to be high tomorrow, then you face a high opportunity cost by releasing supply from your storage today. If you think that the increase in demand is transient, then that opportunity cost is low (because you think that demand is going to go back down tomorrow).

As it turns out, the opportunity cost of releasing supply from storage is related to the amount of spare production capacity, as shown in Figure 10.11. Generally, as the demand for oil or refined petroleum products rises, more expensive capacity (whether it’s oil wells or refineries) must be brought online, so the market price rises as demand goes up. As you get close to the total capacity constraint (the dashed vertical line in the figure), there is literally no more capacity to be brought online, so the price must rise rapidly in order for one of three things to happen: (i) additional supply is released from storage; (ii) new capacity can be constructed, which of course is expensive; or (iii) demand can go down because the price is too high. This transition from a slow and steady price increase to a regime of substantial volatility is endemic to the market for nearly every energy commodity, and the kink in the supply curve shown in Figure 10.11 is appropriately known as the “devil’s elbow” in the energy commodity business.

Bringing on new capacity will eventually lead to lower prices if demand stays constant – all it does is to shift the capacity constraint and the devil’s elbow in Figure 10.11 further to the right (this is shown in Figure 10.12). But this may have a self-reinforcing effect of keeping new capacity out of the market. Since new capacity in the refining business is generally built in large chunks (so-called “lumpy” investment – no one is going to build a refinery that processes a few marginal barrels of oil per day), if a new refinery is built without an increase in demand for petroleum products, the net effect may be to reduce the price for petroleum products so much that the new refinery is not profitable. Because of the devil’s elbow and the lumpy nature of bringing new sources online, energy commodity markets generally do not have a stable equilibrium like you might find in economics textbooks.
NYMEX (now called the "CME Group") offers futures contracts for several refined petroleum products - the most frequently-traded are heating oil and gasoline. The video below shows you where to find these prices on the CME Group website.
Video: Refined Product Futures (2:34)
Characteristics of Natural Gas
Characteristics of Natural Gas
There's an old joke from the oil industry that goes something like this:
An oil company executive walks into a bar and sees a wildcatter slouched over the bar, staring into his drink.
"What's the matter?" says the oil company executive. "Another dry hole?"
"Worse," says the wildcatter, "we found gas!"
For many decades, natural gas was the poor cousin to crude oil. Often found alongside crude oil in reservoirs, natural gas was considered to be a low-value waste product that was often flared or vented into the atmosphere in very large quantities (enough to supply several European countries for an entire year), in order to more easily access the high-value crude. Natural gas is extremely important in the North American energy market for two distinct but interrelated reasons. First, natural gas has become the fuel of choice for dispatchable electricity generation. This means that all alternative forms of generation are compared on a cost basis with the constriction and operation of a gas-fired power plant. Second, natural gas is the major source of heating for the built environment throughout North America. It represents a very important source of energy storage that can be dispatched upon very little notice. Particularly with the rapid emergence of unconventional natural gas resources (these are often grouped into a catch-all category of “shale gas” but include natural gas found in sandstone formations, coal beds, and other types of geologic formations other than shales), there are lots of perceived opportunities in natural gas. We will discuss shale gas in the next lesson, but first, we will walk through an introduction to natural gas as a commodity and the functioning of North American markets for natural gas.
Like crude oil, natural gas is an energy source based on hydrocarbon chains, but the composition of natural gas is generally different than the composition of crude oil. Natural gas is primarily composed of methane, though some natural gas deposits also contain substantial fractions of other hydrocarbon gases or liquids such as ethane and propane (these are longer hydrocarbon chains that have substantial value as chemical feedstocks). Most gas deposits also contain impurities such as sulfur or other carbon compounds that must be separated prior to the gas being injected into transmission or distribution pipelines. Gas deposits that consist primarily of methane are known as “dry” gas deposits, while those with larger fractions of other hydrocarbons are known as “wet” or “rich” gas deposits.

Unlike oil, natural gas is essentially wedded to its transportation system – without pipelines (and liquefied natural gas tankers, which we’ll discuss later), there is no economical way to get large quantities of gas to market. Moreover, natural gas pipelines generally need to be dedicated assets. Using oil or petroleum product pipelines to move natural gas is not really possible, and moving other products in natural gas pipelines is not possible without completely repurposing the pipeline (and the injection/withdrawal infrastructure on either end). This asset specificity and complementarity between natural gas and the pipeline transportation infrastructure has been a significant factor in the development of the natural gas market. Each has little use without the other.
Basic Drivers of Natural Gas Demand
Basic Drivers of Natural Gas Demand
Natural gas is used in industrial, commercial, residential, and electric power applications. Natural gas demand in the United States has remained virtually flat for the better part of a decade, although, as shown in Figure 10.14, there has been a shift in the composition of that demand, away from industrial utilization and towards the electric power sector. Expectations are that the emergence of low-priced gas supplies from unconventional sources will change the drivers of natural gas in two ways – first, demand among both the industrial and electric power sector is anticipated to increase. Second, surplus natural gas supplies may open up an entirely new export sector for North American natural gas.

Each demand sector has its own intra-annual pattern of natural gas demand. Residential demand, for example, tends to be highest in the winter (because of demand for space heating), while demand in the electric power sector tends to be highest in the summer, due to higher demand for electricity (for air conditioning). Overall, natural gas demand in the United States peaks in the wintertime, with a lesser peak during the summer. A typical set of annual demand profiles is shown in Figure 10.15. There are some shifts occurring here as well, particularly as demand from the electric power sector continues to climb.

Beginning in the mid to late 1990s, the U.S. electric power sector started undergoing a transformation away from building new coal-fired power plants and towards building new natural gas plants. This shift took place for a variety of reasons, including increasingly stringent environmental requirements for power plants and a shift in the market for electricity induced by deregulation and restructuring. This shift towards more gas-fired power generation was associated with a pronounced increase in both the average spot price of natural gas and the volatility of natural gas prices, as shown in Figure 10.16. This association seems to have broken down since 2009 – there has been additional investment in, and utilization of, gas-fired power generation but a pronounced decline in natural gas prices. This trend reflects the influence of additional gas supplies from unconventional deposits (primarily shales and tight sandstone formations) coming online. Referencing our discussion of capacity constraints in the lesson on petroleum refining, the price and utilization trends in Figure 10.16 reflect textbook energy economics – the build-out in natural gas generation represented increased demand without a corresponding increase in natural gas supply, pushing the global demand curve towards the capacity constraint and rapidly increasing prices (some price spikes such as those observed in 2000, 2005, and 2008 are associated with extreme weather events like hurricanes or interruptions to gas pipeline networks, such as an explosion in the Western U.S. in 2000).

Evolution and Structure of Natural Gas Markets
Evolution and Structure of Natural Gas Markets
Please read Chapter 5 of the van Vactor reading (Flipping the Switch: The Transformation of Energy Markets [1]), along with the two RBN Energy articles (Henry the Hub, I am I am [6] and The Way She Moves [7]), before you proceed with the written material here. Sections 5.3 to 5.5 of the van Vactor reading are particularly important.
The North American natural gas market is structured based on what has been called the “hub” model of gas pricing. In markets with hub pricing, the interaction of supply and demand sets prices at a small number of specific locations. These locations are the "hubs." (In the van Vactor reading and in one of the assignment questions for this week, there is some discussion about the properties of a good "hub" trading point.) The "local" price at any other location or points of consumption in the commodity network is thus the hub price plus the cost of transportation from the hub. Price differences between any two points in the gas pipeline network represent just the cost of transportation between those two points.
We can also describe this using some terminology from the natural gas industry (this terminology is also commonplace in the oil industry). If the hub represents some point where it is easy to obtain natural gas without much transportation, this would be referred to as the wellhead price. The point where the natural gas enters the distribution system for local delivery (see Figure 5.1 from the van Vactor reading) is known as the citygate. The citygate price should generally be higher than the wellhead price because of the transportation cost associated with moving the gas from the wellhead to the citygate. The wellhead price simply represents the market equilibrium for the natural gas commodity, not including any transportation costs.
One implication of the hub pricing model is that the entire gas market should roughly obey the law of one price, which says that if the gas market is working efficiently, then price differences should reflect transportation costs. A change in the wellhead price of natural gas would be reflected everywhere else in the network.

Here is a simple illustration of the law of one price, using the small network shown in Figure 10.17. In this example, p represents the price at a given location and c represents the transportation cost to get from the supply point (wellhead) to a specific location. Gas fields A and B are connected via pipeline to market centers (you can think of these as citygates) 1 and 2. A and B can deliver to both markets, but the transportation cost c is higher to get to market 2 than market 1. Thus, c1 < c2 and in equilibrium, p1 < p2. Thus, gas at Market 1 will be cheaper than gas at Market 2.
Further, in equilibrium p2 = p1 + (c2 – c1), which in words says that the price at Market 2 would be equal to the price at Market 1 plus the transportation cost to Market 2 from Market 1 (the transportation cost to Market 1 from the wellhead is already reflected in the price at Market 1). Using number, suppose that the price of natural gas at the wellhead (either field A or B) was $5 per million BTU ($/MMBTU). The transportation cost to market 1 is $1/MMBTU and the transportation cost to market 2 is $3/MMBTU. If this gas market obeyed the law of one price, then the citygate price at market 1 would be $5/MMBTU + $1/MMBTU = $6/MMBTU. The citygate price at market 2 would thus be $6/MMBTU + ($3/MMBTU - $1/MMBTU) = $8/MMBTU.
One implication of the law of one price is that changes in supply or demand at one location can affect pricing at all locations in the network. Here is another example, again using the same network (see Figure 10.18). Suppose that demand in market 2 were to increase. Suppliers in both fields would increase their offer prices so that p2 > p1 + (c2 – c1). Assuming that there are no constraints on the size of the pipeline, that increased demand at market 2 would bid up the price for all market points in the network, since all suppliers would try to move their gas to market 2. (Of course, there is some limit to this redirection of supply, since demand in market 2 is finite.) Supply to market 1 would decrease, raising prices in market 1 to restore equilibrium (where the price difference between markets is equal to the difference in transport costs).

It is possible for markets connected by pipelines to depart from the law of one price. The simplest example of how this might happen is if there is a constraint or an interruption on a pipeline. For example, suppose that the pipeline between markets 1 and 2 were to be removed from service, isolating market 2. What would happen to prices at market 1? Market 2? In the assignment for this lesson, you will get some practice looking at the law of one price in the North American natural gas market using data from the U.S. Energy Information Administration.
Every natural gas field within some geographic area has the potential to be a hub pricing point. Locations that are close to producing areas and are also connected to a large number of gas transmission pipelines also have the potential to be good hub pricing points. In general, hub pricing points need to be highly connected to the rest of the network – it should be easy to move gas from the hub point to any other location in the network.
The major hub pricing point in North America is the “Henry Hub,” which is a physical location in Louisiana, indicated in Figure 10.19. Henry Hub is well-connected to the rest of the North American market (as indicated by the flows of gas through North America as shown graphically in Figure 10.20).
The Henry Hub is also the point at which the NYMEX futures contracts for natural gas are priced. The following video shows how to access natural gas pricing data from EIA and NYMEX.
Video: Natural Gas Futures (1:55)


Lesson 10 Summary and Final Tasks
Lesson 10 Summary and Final Tasks
This lesson introduced you to the global markets for the petroleum commodities (crude oil, refined products, and natural gas). These commodities, along with coal, are commonly called fossil fuels. The inherent value of these fuels comes from their relative ease of transportation, their energy density, and their ability to be inventoried and dispatched as needed to meet demand. These characteristics should always be kept in mind when trying to understand the challenges associated with a transition away from fossil fuels.
There is a great deal of complexity in the world petroleum markets. There are entire 3- and 6-credit courses offered on the subject. We covered a lot of ground in this single module. There is also supplementary material from the previous iteration of EME 801 (written and developed by Dr. Seth Blumsack) which is attached as an appendix. You are strongly encouraged to read this material and digest it as further background on energy markets provides great insight to inform decisions that each of you will be called on to make.
Reminder - Complete all of the Lesson 10 tasks!
You have reached the end of Lesson 10! Double-check the What is Due for Lesson 10? list on the first page of this lesson to make sure you have completed all of the activities listed there before you begin Lesson 11.
Lesson 10 Appendix
Three Phases of the World Oil Market
Three Phases of the World Oil Market

As shown in Figure 10A.1, the development of our current globalized oil market can be broken down into a few different stages. The first phase was marked largely by intra-company transactions, with occasional inter-company "spot" sales. The second was defined by the emergence of OPEC and its attempts to influence an increasingly global oil trade for political ends. The third is defined by the commoditization of oil markets, with regional prices linked by inter-regional trade and the development of sophisticated financial instruments such as futures and option contracts, which we'll discuss in more detail below.
Regional Pricing of Crude Oil
Regional Pricing of Crude Oil
While the market for oil is global in reach, trade has clustered itself into several primary regions. This has happened despite shipping costs that are generally low (only a few dollars per barrel) and the ease with which oil cargoes can be directed and redirected towards the highest-priced buyers (in financial terms, oil is "fungible"). Nevertheless, prices in these regions tend to move in tandem.
One reason for regional pricing of crude oil is that it is a heterogeneous commodity - not all crude oils are alike. Some oil can be extracted at a cost of a few dollars per barrel, and flows like water (it would look like Coca-Cola coming out of the ground). Other oil requires sophisticated equipment, techniques and processing to extract, and is thick as tar, requiring special methods to transport it to the refinery (and to refine into saleable petroleum products). In general, oil with a low viscosity is referred to as "light," while thicker, higher-viscosity crude oils are referred to as "heavy." Light oils are generally valued higher than heavy oils. The viscosity of crude oil is measured on a scale known as the API gravity (API stands for "American Petroleum Institute"). The API gravity scale measures how heavy or light a crude oil is, relative to water (thus the terms heavy and light oil). The API gravity of a crude oil is measured by taking its specific gravity (density relative to water), and calculating:
Sulfur content is another important determinant of value; the lower the sulfur content the better. So-called "sweet" oils are low in sulfur, while "sour" oils have a higher sulfur content. There are some differences in crude oil quality among the major trading regions. Pricing of heterogeneous commodities often involves establishing a benchmark or "marker" price that is used to track general price movements. Pricing in any particular transaction is based on the marker price, with adjustments for location and quality. Below are some brief descriptions of some of the major global benchmark oil streams, and the Energy Information Administration has a very nice article on the most important global marker prices [19]. The first two, West Texas Intermediate (WTI) and Brent, are the most important benchmark oil prices in the world.
- West Texas Intermediate (WTI) is a light crude oil that is primarily representative of the U.S. market. It is a "light sweet" oil, meaning that it has low density (high API gravity of around 40) and a low sulfur content.
- Brent is a blend of light sweet crude oils from the North Sea, off the coast of the United Kingdom. Its API gravity is around 38 and it has a somewhat higher sulfur content than WTI. Still, in terms of quality, WTI and Brent are largely comparable.
- Fateh is a crude oil stream from the emirate of Dubai (which is why it is sometimes simply called "Dubai Crude"). Fateh has an API gravity of around 31, making it a denser crude oil than either WTI or Brent. Fateh is also classified as a "sour" oil for having a higher sulfur content than WTI or Brent. The importance of Fateh as a benchmark oil price is that it is representative of crude oil shipments from the Middle East to Asia.
- Bonny Light is a light sweet crude oil stream from Nigeria. It serves as a benchmark for African crude oils because its low density and sulfur content make it comparable to WTI and Brent (and, indeed, the major source of demand for Bonny Light has historically been refineries in Europe and the U.S.).
- Urals is a heavy (low API gravity) and sour crude oil blend from Russia. It serves as a benchmark for oil exports from Russia.
A Market Squeeze
A Market Squeeze
A very interesting and entertaining thing happened in the crude oil market in April 2020, when the price of oil on the futures market went negative, trading at -$37.63 per barrel. This means that if you were a potential buyer of crude oil, someone would have paid you $37.63 for every barrel of oil you agreed to buy. I don't know about you, but no one has ever paid me to fill my car's gas tank. It usually works the other way around. What on earth happened here? This short blog post from RBN Energy [20] has a good explanation. The reason for this price craziness has to do a little bit with panic in the oil market because of the coronavirus pandemic and a little bit with how futures markets work. Basically, what happened was that there were a bunch of crude oil traders who had contracts to buy crude oil for delivery in May 2020. Those traders either had to take physical delivery of a bunch of barrels of crude oil in May, or find someone else to assume their contract (this is called "closing one's position" in commodity market parlance). Well, since the pandemic had hit and crude oil demand had collapsed, there was no one in the market who really wanted to buy crude oil from these traders. And, there was no place for these traders to physically put the crude oil that they were obligated to take in May 2020. So these traders got caught in a market squeeze and had to pay others to close their positions. It's crazy, and hasn't happened in the crude oil market before...but it makes perfect sense when you realize how this market actually works!
Regional Analysis of Petroleum Product Movements: Petroleum Administration for Defense Districts
Regional Analysis of Petroleum Product Movements: Petroleum Administration for Defense Districts
Please read this short but informative background on the PADD system [21] from the Energy Information Administration:
Originally created during World War II for the purposes of regional rationing of gasoline supplies, the Petroleum Administration for Defense Districts (PADDs) are still utilized today to track regional movements of crude oil and (particularly) petroleum products in the United States. While the PADD system might seem a bit archaic, studying the movements of petroleum products between the PADD regions is useful for understanding how these markets are segmented in the United States. Figure 10A.2 shows a map of the PADDs with the locations of oil refineries. Note that the figure shows operable refinery locations and capacity volumes as of January 1, 2012 (a long time ago!). This is because the last full year for which data was published was 2010.

The Petroleum Administration for Defense Districts (PADDs) are geographic aggregations of the 50 States and the District of Columbia into five districts: PADD 1 is the East Coast, PADD 2 the Midwest, PADD 3 the Gulf Coast, PADD 4 the Rocky Mountain Region, and PADD 5 the West Coast. Due to its large population, PADD 1 is further divided into sub-PADDs, with PADD 1A as New England, PADD 1B the Central Atlantic States, and PADD 1C comprising the Lower Atlantic States. There are two additional PADDs (PADDs VI and VII) that encompass U.S. Territories (these are not pictured on the map).

The description of the PADD system from the EIA includes some data on inter-PADD shipments of petroleum products (remember that most of these will be gasoline and the “distillates” – diesel fuel and heating oil). Figure 10A.3 shows this data in visual form, again using the PADD designation map from the EIA. The figure indicates that there is substantial inter-PADD trade between the eastern states, the Gulf Coast and the Midwest. The Rocky Mountain states and the U.S. West Coast, on the other hand, are largely isolated from the rest of the United States and even from one another. Because of a lack of refinery capacity and pipeline capacity, the U.S. West Coast, in particular, has a gasoline and diesel market that is largely separate from the rest of the country. (This is also due in part to California’s gasoline standards, which are more stringent than in the rest of the U.S.)
Petroleum product pipeline maps are not available in the public domain, but you can view an image online at the following websites.
- United States Pipelines map [23]
- United States Pipelines map information [24] (for an explanation of what you will see on the map)
Refinery Economics
Refinery Economics
Oil refineries produce value-added petroleum products from crude oil. Profitability is thus determined by several different variables:
- Feedstock costs (primarily crude oil)
- Fuel costs and other operational costs for the refinery itself
- Costs of complying with emissions regulations (particularly NOx)
- Market prices for the products produced.
Determining profitability for a specific refinery is very difficult, since data on operational and environmental compliance costs are generally not available. A rough measure could be obtained by calculating the cost of crude-oil feedstock (though to do this with precision would require knowledge of the crude blends used in a specific refinery) and comparing that cost with the market value of the suite of products produced at the refinery. This still requires more information than might be publicly available for a typical refinery, and is subject to market conditions for the various products produced.
A useful but simplified measure of refinery profitability is the “crack spread.” The crack spread is the difference in the sales price of the refined product (gasoline and fuel oil distillates) and the price of crude oil. An average refinery would follow what is known as the 3-2-1 crack spread, meaning for every three barrels of oil, the refinery produces an equivalent of two barrels of gasoline and one barrel of distillate fuels (diesel and heating oil). This ratio of refined product output closely mirrors the composition in Figure 2.4, but remember that the crack spread is only a first-order approximation of how profitable a refinery would be at the margin! The higher the crack spread, the more money the refinery will make, so it will be utilizing as much capacity it has available. Inversely, at some lower crack spread prices, it actually may be in the refinery’s best interest, due to costs for the plant, to scale back the amount of capacity utilized. Please see the appendix for an example and further elucidation of the crack spread.
Calculating the 3-2-1 Crack Spread
Calculating the 3-2-1 Crack Spread
Calculating the 3-2-1 crack spread typically uses published prices for crude oil, gasoline and distillates. These prices are typically taken from the New York Mercantile Exchange. The NYMEX has traded contracts for crude oil and gasoline, but no contract for diesel fuel (the most-produced of the distillate fuel oils). In calculating the 3-2-1 crack spread, prices for heating oil futures are typically used instead. Below is an example of how to calculate the crack spread, using data from 2012.
- Oil Price: $84.54/barrel
- Gasoline Price: $2.57/gallon
- Heating Oil Price: $2.79/gallon
- (remember that 42 gallons = 1 barrel)
- (2 barrels * 42 gallons/barrel * $2.57/gal of gas) +
(1 barrel * 42 gallons/barrel * $2.79/gal of heating oil) -
(3 barrels * $84.54/barrel of oil) =
$79.44 profit / 3 barrels of oil. - The crack spread would thus be $79.44 / 3 = $26.48/barrel of oil
The crack spread, of course, is not a perfect measure of refinery profitability. What it really measures is whether the refinery will make money at the margin – i.e., whether an additional barrel of crude oil purchased upstream will yield sufficient revenues from saleable products downstream. In reality, existing refineries must consider their refining costs in addition to just the cost of crude oil. These costs include labor (though that is generally a small part of refinery operations); chemical catalysts; utilities; and any short-term financial costs such as borrowing money to maintain refinery operations. These variable costs of refining may amount to perhaps $20 per barrel (depending on conditions in utility pricing and financial markets). In the example above, the true margin on refining would be $6.58 per barrel of crude oil – much lower than the simple crack spread would suggest.
The crack spread tends to be sensitive to the slate of products produced from the refinery. In the example above, we used gasoline and distillate fuel oil (heating oil) because those are two typically high-valued products, and U.S. refineries are generally engineered to maximize production of gasoline and fuel oil.
The crack spread is also sensitive to the selection of the oil price used. In the example above, we used the NYMEX futures price for crude oil, which recall is based on the West Texas Intermediate blend - a fairly light crude oil. Many U.S. refineries, however, are engineered to accept heavier crude oils as feedstocks. If there are systematic differences in the prices of heavy crude oils versus West Texas Intermediate, then the crack spread calculation (while illustrative) may not be sensible for a particular refinery.
The Energy Information Administration recently published a couple of good articles describing how the U.S. refinery fleet has been adjusting to changes in U.S. crude oil production. Not only has the quantity of crude oil produced in the U.S. been increasing rapidly, but the oil coming out of the large shale plays (like the Bakken in North Dakota) is much lighter than the crude oils typically accepted by U.S. refineries.
The first article, Regional Refinery Trends Continue to Evolve [25], published on 7 January 2015
The second article, Regional Refinery Trends Evolve to Accommodate Increased Domestic Crude Oil Production [26], published on 15 January 2015
Links
[1] https://www.e-education.psu.edu/eme801/sites/www.e-education.psu.edu.eme801/files/PDFs/vanvactor.pdf
[2] https://www.e-education.psu.edu/eme801/sites/www.e-education.psu.edu.eme801/files/PDFs/Hall_and_Day.pdf
[3] https://www.npr.org/sections/money/2016/08/26/491342091/planet-money-buys-oil#:~:text=Planet%20Money%20Buys%20Oil%20%3A%20Planet%20Money%20%3A%20NPR&text=Planet%20Money%20Buys%20Oil%20%3A%20Planet%20Money%20We%20bought%20100%20barrels,and%20into%20someone's%20gas%20tank.
[4] https://www.eia.gov/energyexplained/natural-gas/
[5] https://www.e-education.psu.edu/eme801/sites/www.e-education.psu.edu.eme801/files/PDFs/Cushing%20The%20Heart%20of%20the%20Matter.pdf
[6] https://www.e-education.psu.edu/eme801/sites/www.e-education.psu.edu.eme801/files/PDFs/Henry%20the%20Hub%2C%20I%20Am%20I%20Am%20%E2%80%93%20Understanding%20Henry%20Hub_%20How%20Changing%20Natural%20Gas%20Flows%20Will%20Impact%20the%20Benchmark%20_%20RBN%20Energy%20Network.pdf
[7] https://www.e-education.psu.edu/eme801/sites/www.e-education.psu.edu.eme801/files/PDFs/The%20Way%20She%20Moves%20-%20A%20Deep%20Dive%20into%20the%20Process%2C%20Quirks%20and%20Idiosyncrasies%20of%20U.S.%20Natural%20Gas%20Pricing%20_%20RBN%20Energy.pdf
[8] http://crudemarketing.chevron.com/posted_pricing_daily.asp
[9] https://creativecommons.org/licenses/by-nc-sa/4.0/
[10] http://www.economist.com/news/finance-and-economics/21688446-why-oil-price-has-plunged-20-new-40
[11] https://www.andrewnikiforuk.com/Dirty_Oil_PDFs/FarrellRisksof%20theOil%20TransitionTable.pdf
[12] http://image.guardian.co.uk/sys-files/Guardian/documents/2001/08/14/resources-biodiversity.pdf
[13] https://www.youtube.com/watch?v=NwzaxUF0k18
[14] http://dx.doi.org/10.1088/1748-9326/1/1/014004
[15] https://en.wikipedia.org/wiki/Petroleum_refining_processes
[16] https://commons.wikimedia.org/wiki/File:Country_Fair_gas_station.jpg
[17] https://www.energy.gov/eere/vehicles/fact-676-may-23-2011-us-refiners-produce-about-19-gallons-gasoline-barrel-oil
[18] http://www.eia.gov/dnav/pet/pet_pri_spt_s1_d.htm
[19] http://www.eia.gov/todayinenergy/detail.cfm?id=18571
[20] https://rbnenergy.com/one-way-out-yesterdays-crude-price-meltdown-super-futures-contract-expiration-and-crude-storage
[21] http://www.eia.gov/todayinenergy/detail.cfm?id=4890
[22] https://www.eia.gov
[23] https://www.theodora.com/pipelines/united_states_pipelines.html
[24] http://www.theodora.com/pipelines/united_states_pipelines.html
[25] http://www.eia.gov/petroleum/weekly/archive/2015/150107/includes/analysis_print.cfm
[26] http://www.eia.gov/todayinenergy/detail.cfm?id=19591