Lesson 4: Separation Processes 1
Lesson 4 Overview
Overview
Video: FSC 432 Lesson 4 (2:23)
Overview
As introduced in Lesson 3, distillation is a key separation process that fractionates crude oil into a number of streams with specific boiling point ranges, or distillation cuts. Removing salt from crude oil usually precedes the distillation process to protect the downstream units from corrosion caused by Cl¯. Desalting process could also remove metals (e.g., Fe, Ni, V) and other inorganic solids and sediments that may deactivate catalysts used in conversion and finishing units. Depending on the specific gravity and the amount of salt present in a crude oil, refineries conduct from one up to three stages of desalting [1]. Heavy and crudes may require three stages of desalting, using processes such as gravity settling, electrostatic coalescence, and packed column separation [2]. Figure 4.1 shows a simple desalting process that uses gravity settling to separate brine (NaCl +H2O) from crude oil after diluting the crude with water and adding de-emulsifiers (chemical additives) to facilitate phase separation.
Learning Outcomes
By the end of this lesson, you should be able to:
- compare and evaluate different distillation methods;
- define boiling point ranges (TBP) of distillation fractions of crude oil;
- identify and exemplify distillation terminology, including cut points and product yields in distillation ranges;
- illustrate the crude fractionation in Atmospheric Distillation and calculate the extent of separation between the distillation fractions;
- illustrate Vacuum Distillation and assess the application of Watson Characterization Factor to select the temperature in Vacuum Distillation Tower.
What is due for Lesson 4?
This lesson will take us one week to complete. Please refer to the Course Syllabus for specific time frames and due dates. Specific directions for the assignment below can be found on the Assignments page within this lesson.
| Reading | J. H. Gary, G. E. Handwerk, Mark J. Kaiser, Chapter 4 (Crude Distillation) |
|---|---|
| Assignments | Exercise 3: Appraisal of the degree of separation between distillation fractions Quiz 2: Will cover the material in Lessons 3-4. |
Questions?
If you have any questions, please post them to our Help Discussion (not email), located in Canvas. I will check that discussion forum daily to respond. While you are there, feel free to post your own responses if you, too, are able to help out a classmate.
Atmospheric and Vacuum Distillation Units
Atmospheric and Vacuum Distillation Units
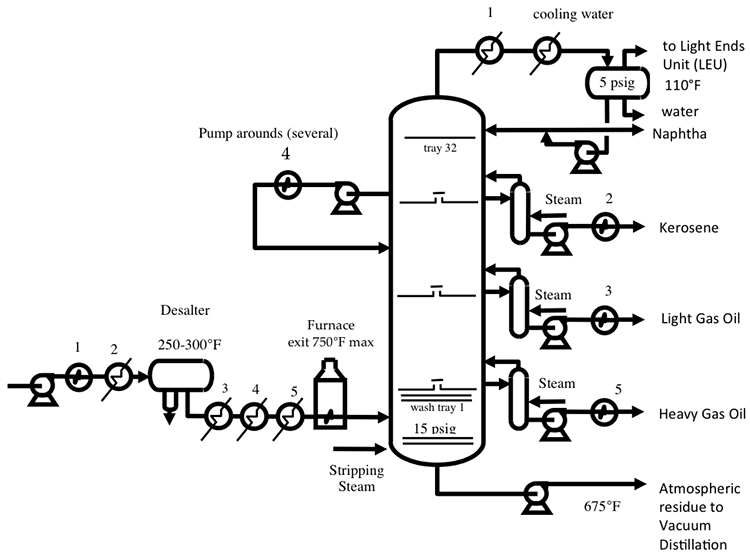
Distillation of crude oil is carried out in two units, first in an Atmospheric Distillation Unit (also known as Crude Distillation Unit, CDU), with further processing of the residue from atmospheric distillation in the Vacuum Distillation Unit (VDU), as illustrated in Figure 4.2. For sake of simplicity, Figure 4.2 does not include the network of heat exchangers and pump around loops to pre-heat the desalted crude before it is fed into the fired furnace. In the furnace, the crude is heated to the desired temperatures (700-750° F) such that all the distillate fraction and roughly 10-20% of the bottom product are evaporated, depending on the volatility of crude oil. The two-phase mixture is then introduced into the CDU flash zone for separation of vapor and liquid streams, where the vapor fraction rises toward the top of the column and the liquid fraction is subjected to stripping with steam to recover the low-boiling distillate components dissolved in heavier liquid before sending the bottom product (i.e., atmospheric distillation residue) to the vacuum distillation unit.

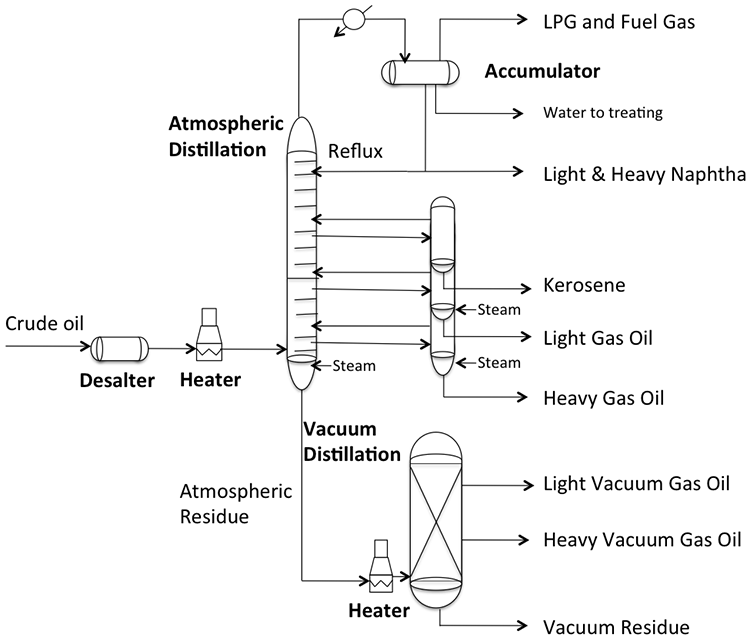
A temperature gradient is established in the column by removing heat from the overhead vapor. The column condenses the naphtha fraction and sends a portion of the liquid naphtha, as reflux, to the column to achieve a good separation of the distillate products drawn from the side of the distillation column, such as kerosene, LGO, and HGO, as seen in the diagram. Steam strippers on the side of the column also provide reflux to the main column to help with clean separation of the distillate products. Additional reflux is provided to the main column by pump around loops associated with heat exchangers (see Figure 4.3, below, and Figure 4.8 in the textbook) for preheating the crude. Counter-current flow of vapor and liquid streams through the contact stages (e.g., trays) in the main column, enabling good separation of the distillate fractions. The temperature at the bottom of CDU is limited to 700-750° F to prevent cracking – breaking of the chemical bonds between carbon atoms in the aliphatic hydrocarbons constituting the crude oil. Cracking would cause coking (accumulation of carbonaceous solids) on the metal surfaces in the column and interferes with fractionation in distillation. Vacuum distillation is necessary to fractionate the heavy distillates because further increase in temperature would cause thermal cracking of the feed components. In HYSYS Project 1 assignment, you will learn how to introduce crude assay data to a distillation simulator and calculate the yields of naphtha, kerosene, diesel, atmospheric gas oil, and residue for different crudes.
As shown in Figure 4.4, below (and in Figure 4.10 in the textbook), the atmospheric residue is reheated in a fired furnace to 730-850° F before introduction into the vacuum distillation unit (VDU). The furnace outlet temperature is selected depending on the thermal reactivity (or coking propensity of crude oil, as will be discussed further) and the desired level of separation in the column. Steam ejectors, or, more recently, vacuum pumps, are used to create a vacuum for evaporation of the light vacuum gas oil and heavy vacuum gas oil fractions. The temperature and pressure in VDU also depend on whether steam is introduced, or the separation is carried out without the steam addition in “dry” towers, varying between 10 to 30 mmHg at the bottom of the tower. Lower pressures and higher temperatures are used in dry towers. To minimize the pressure difference between the bottom and top of the column, some special packing materials are used (see, for example, Figure 4.5) instead of trays for providing contact between liquid and vapor streams to improve fractionation.
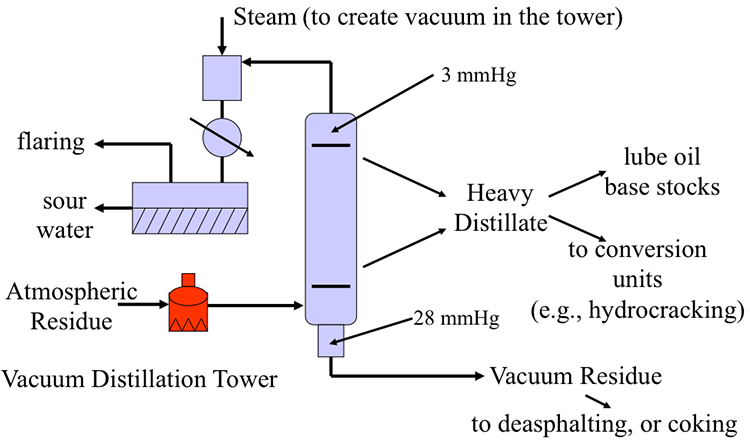

The heavy distillates (light vacuum gas oil and heavy vacuum gas oil) separated in VDU are further processed in downstream separation and conversion units to produce lubricating oil base stocks, or as feedstock for hydrocracking to produce light and middle distillates. The residue from vacuum distillation (VDR) can be upgraded into marketable products and fuels using processes such as visbreaking, deasphalting, and coking, as will be discussed in later sections.
Selecting the Right Temperature
Selecting the Right Temperature
Selecting the right temperature in the vacuum distillation column is critical to control the risk of coking in the column. The Watson Characterization Factor (Kw) [4] may be used to estimate the upper temperature limit for vacuum distillation to avoid coking. Figure 4.6 shows an empirical correlation between Kw and the temperatures above which significant thermal decomposition could take place. This region is labeled as the decomposition zone in Figure 4.6. Because of the complex variability in crude oil composition as it relates to coking propensity, one could draw a band of temperatures below which coking risk is negligible, and the area within the band represents uncertainty in terms of the probability of coking. To be on the safe side, the temperature in the column should be lower than the lower temperature line of the band. Figure 4.6 also shows that crudes with high Kw (paraffinic) should be heated to lower temperatures in the column than crudes with lower Kw (less paraffinic). Hydrocarbon composition is closely related to thermal reactivity, since paraffins could be more readily cracked than naphthenes, whereas aromatic compounds are the most stable hydrocarbons. To sum up, vacuum distillation temperatures should be selected with particular care for paraffinic crudes because of the relative ease of cracking of paraffins that leads to the formation of coke on surfaces.

Severe cases of coking can plug the flow paths in the distillation column and require shutting down the unit. Shutting down a distillation unit would be catastrophic, as it would require shutting down the whole refinery that must run around the clock except for the scheduled maintenance period.
Knowledge Check
Check your knowledge!
Question 1: Why would shutting down a refinery be a catastrophic event?
Distillation Methods
Distillation Methods
Three different distillation methods are commonly used to generate laboratory data on crude oil:
- True Boiling Point Distillation (TBP)
- ASTM Distillation (ASTM)
- Equilibrium Flash Vaporization (EFV)
The degree of separation between the distillation fractions obtained in these methods decreases significantly as one moves down the list from TBP through ASTM to EFV. Each method and the associated distillation data have different applications in the refinery practice.
True Boiling Point Distillation (TBP)
True Boiling Point Distillation (TBP)
This method, described in Figure 4.7a and b, uses a batch distillation operation that incorporates more than 100 theoretical plates and a high reflux ratio (R/P) of 100, as described in Figure 4.7a. This is an idealized method to achieve the best possible separation in distillation, made possible by a large number of theoretical plates (stages) for liquid vapor contact in the column and an extremely high reflux ratio. As an example, consider distillation of a binary mixture of compounds A (70% by volume) and B (30% by volume), with boiling points Ta and Tb, respectively. Figure 4.7b illustrates the distillation curve that would be obtained if this mixture were distilled using the TBP method, with perfect separation of A and B as pure compounds. Because of the TBP distillation conditions, first the lower boiling component A is distilled off without any contamination with B, and following the complete vaporization of A, B is distilled off as a pure compound. Note that because a large number of plates and a high reflux ratio in the column, temperature remains constant during evaporation of A until all of this compound is boiled off, as would be seen in the distillation of a pure compound.


ASTM Distillation (ASTM)
ASTM Distillation (ASTM)
ASTM distillation also uses a batch operation, but in contrast to TBP, it operates without the presence of a contact plate and a reflux ratio (R/P, or RR) of zero, as shown in Figure 4.8a. There may be a slight unintentional reflux because of the condensation of the vapor on the tube that connects the flask to the condenser.


Equilibrium Flash Vaporization (EFV)
Equilibrium Flash Vaporization (EFV)
Equilibrium flash vaporization involves heating a flowing feed and the separation of the liquid and vapor in a flash drum. A distillation curve may be obtained by conducting this distillation at varying heater outlet temperatures. Figure 4.9 shows the diagram of an EFV set up and compares the distillation curves from the three methods, TBP, ASTM, and EFV. From the comparison of the curves and the relationship between IBP and EP obtained in each case, one concludes that EFV gives the lowest degree of separation between A and B, even lower than that given by the ASTM distillation.

TBP, ASTM, and EFV Compared
TBP, ASTM, and EFV Compared
The TBP, ASTM, and EFV distillation methods achieve different levels of separation for a given sample, as related to the different techniques used in these analyses. Figure 4.10 shows TBP, ASTM, and EFV curves for a middle distillate fraction crude oil, showing significant differences in IBP and EP of the three curves [6]. Note that three curves converge near 50% volume distilled. TBP distillation achieves a higher degree of separation than ASTM and ASTM achieves better separation than EFV, as can be seen in the curves in Figure 4.10. Empirical correlations have been developed to convert one set of distillation data to another [7].

Each distillation method discussed in this section has an application in petroleum refining. TBP distillation is used to characterize crude oils and constitute a significant component of crude essay. ASTM methods are usually used for refinery products and property calculations and correlations for distillate fractions. EFV provides useful data for flashing operations in the refinery.
There are no standard methods for TBP distillation, but ASTM D-2892 method is used to approximate the TBP distillation. This method is also referred to as 15-5 distillation, because of 15 theoretical plates and a reflux ratio of 5 used in the distillation. A simulated distillation method described in ASTM D2887 may also be used to obtain TBP data for crude oils.
ASTM D86 (atmospheric distillation) and ASTM D1160 (vacuum distillation) are used for low-boiling, and high-boiling fractions, respectively.
[6] Refining Overview - Petroleum, Products and Processes, AIChE, 2000.
[7] Riazi, M.R., “Characterization and Properties of Petroleum Fractions,” MNL5, ASTM International, West Conshohocken, PA, 2005.
Distillation Terminology
Distillation Terminology
It is important to use the correct terms to clearly represent the fractionation of crude oil by distillation. The distillation temperatures, or cut points, are used to delineate the distiilate fractions and define commercial fuels and solvents.
Cut Points
Cut Points
Using a crude TBP curve, cut points are defined as the temperatures that represent the limits of a distillate fraction, as illustrated in Figure 4.11. For example, for kerosene, fraction Ta represents the lower cut point, and Tb represents the upper cut point in Figure 4.11.

Boiling ranges between the cut points represent distillate products, such as naphtha, kerosene, light gas oil, etc. The difference between the cumulative volume percent at upper and lower cut points is reported as the yield (in volume %) for the particular distillate fraction. For example, for the crude represented in Figure 4.11, the kerosene yield can be calculated as 40%(at Tb) -20% (Ta) = 20% by volume. Table 4.1 shows the TBP cut points for crude oil distillate fractions.
| Distillate Product | Boiling Range |
|---|---|
| Butanes and Lighter | |
| Light SR Naphtha | 90 - 190o F (32-88o C) |
| Heavy Naphtha | 190 - 380o F (88 - 193o C) |
| Kerosene | 380 - 520o F (193 - 271o C) |
| Light Gas Oil | 520 - 610o F (271 - 321o C) |
| Heavy Gas Oil | 610 - 800o F (321 - 425o C) |
| Light Vacuum Gas Oil | 800 - 950o F (425 - 510o C) |
| Heavy Vacuum Gas Oil | 950 - 1050o F (510 - 564o C) |
| Vacuum Residue | > 1050o F (>565o C) |
Separation in Fractional Distillation
Separation in Fractional Distillation
The quality of separation in fractional distillation can be calculated using the designated cut points (at 5%vol and 95%vol) for the two adjacent fractions, termed as light and heavy. As shown below, the difference in temperature (ΔT) between 5% vol temperature of the heavy fraction and 95%vol temperature of the light fraction is used to define the quality of separation. A positive value of ΔT(termed ASTM gap) indicates good separation, while a negative value of ΔT (termed ASTM overlap) points to a bad separation.
ASTM distillation temperatures and separation in a distillation process
Fractionation
What defines a good separation?
The relationship between the ASTM distillation temperatures at 95% vol and 5% vol of two adjacent fractions, light and heavy, respectively.
ASTM 5% volT (heavy fraction) - 95% volT (light fraction) = ∆T
(e.g., LGO) (e.g., kerosene)
if ∆T >0, called ASTM gap (good separation)
if ∆T<0, called ASTM overlap (bad separation)
Assignments
Assignment Reminder
Each week, you will be required to do a number of assignments. This week, in addition to the reading assignments listed on the overview page, you are also required to complete the exercise questions and take a quiz which will cover the material in Lessons 3 and 4.
Exercise 3
Instructions for Exercise 3
Submit your answers by creating and uploading your pdf to the Exercise 3 Assignment in the Lesson 4 Module. Please Note: Scans of handwritten pages are not acceptable unless showing something on the graphs provided.

- Two crude oils A (Naphthenes: 20%, Aromatics: 10%) and B (Paraffins: 14% , Aromatics: 40%) are blended in A/B = 2/5 to make C. What is the paraffin content of C? 20 pts
- Consider the ASTM distillation curves given in Figure 4.12 for kerosene and diesel cuts obtained from distillation. Determine whether the separation in the column was good or bad. 40 pts
- Figure 4.13 shows an empirical plot that correlates an F factor which is defined as the product of the number of plates between the two adjacent side draws and the reflux ratio. The solid lines in the plot represents cases where no stripping steam is used in the side column, dashed lines represent the maximum amount of stripping steam used in the separation. The numbers shown at the bottom of the solid and dashed lines are given as the difference in °F of the TBP 50% distillation points between the light and heavy products.

Using the correlations in Figure 4.13, calculate how many plates will be needed between kerosene and light gas oil (LGO) draw-off trays to obtain a 10°F ASTM gap between kerosene products. The TPB 50% temperatures are 300° F and 550° F for kerosene and diesel products, respectively. The reflux ratio is given as 0.5. Consider a) no steam for stripping, b) maximum steam for stripping. Comment on the results. 40 pts
Instructions for Submitting your Answers:
Once you have a solution to the exercises, you will submit your answers as a PDF to be graded. Please follow the instructions below.
- Find the Exercise 3 assignment in the Lesson 4 Module by either clicking Next until you find it, or by clicking Assignments and scrolling down until you find it.
- Make sure that your name is in the document title before uploading it to the correct assignment (i.e. Lesson4_Exercise3_Tom Smith).
Quiz 2
All quizzes are located in the Quizzes folder in Canvas. Quiz 2 will cover the topics in Lessons 3 and 4.
Self-Check Questions
Take a few minutes to answer the questions below to check your knowledge before taking the quiz or submitting your exercises.
Summary and Final Tasks
Summary
Distillation, a key separation process in petroleum refining, is considered as a gateway to all refinery processes. Fractionation of crude oil by distillation into a number of streams generates feedstocks for all the subsequent separation, conversion, and finishing processes that lead to the refinery
products. Prior to distillation, crude oil is subjected to desalting to remove in particular the Cl¯ion to prevent corrosion in downstream processes. Both atmospheric and vacuum distillation processes are used to separate the desired fractions from crude oil which has a boiling range of over a 1000° F. Three different distillation methods used in the laboratory include True Boiling Point distillation, used for characterization of crude oils, ASTM distillation for product characterization, and Equilibrium Flash Vaporization for conducting efficient flash operations in the refinery. The performance of an atmospheric distillation column can be monitored through using the ASTM distillation data obtained for the distillate products. The three parameters that control the performance of a distillation column in terms of the quality of separation achieved in the process are a number of plates, reflux ratio, and the amount of steam used in the operations. Empirical correlation relates these three factors to control the quality of separation in an operating distillation column or help design a new distillation column.
Learning Outcomes
You should now be able to:
- compare and evaluate different distillation methods;
- define boiling point ranges (TBP) of distillation fractions of crude oil;
- identify and exemplify distillation terminology, including cut points and product yields in distillation ranges;
- illustrate the crude fractionation in Atmospheric Distillation and calculate the extent of separation between the distillation fractions;
- analyze the vapor-liquid equilibrium and evaluate the application of Fenske Equation to distillation in Light Ends Unit;
- illustrate Vacuum Distillation and assess the application of Watson Characterization Factor to select the temperature in Vacuum Distillation Tower.
Reminder - Complete all of the Lesson 4 tasks!
You have reached the end of Lesson 4! Double-check the to-do list below to make sure you have completed all of the activities listed there before you begin Lesson 5. Please refer to the Course Syllabus for specific time frames and due dates. Specific directions for the assignments below can be found within this lesson.
| Reading | J. H. Gary and G. E. Handwerk, Chapter 4 (Crude Distillation) |
|---|---|
| Assignments | Exercise 3: Submit your answers to the Exercise 3 assignment in the Lesson 4 Module. Quiz 2: Will cover the material in Lessons 3 and 4. |
Questions?
If you have any questions, please post them to our Help Discussion (not email), located in Canvas. I will check that discussion forum daily to respond. While you are there, feel free to post your own responses if you, too, are able to help out a classmate.