Lessons
Lesson 1: Introduction to Cloud and Server GIS
Overview
It is an exciting time for Cloud GIS. There has been a huge upswing in interest in geospatial data, and the computing infrastructure to support the visualization and analysis of this data has been developed as well. While the infrastructure to support cloud GIS is now accessible to everyone, the exact forms it will actually take is still unknown.
The purpose of this course is twofold: first, to give you practice with using a variety of cloud GIS services, and second, to give you an understanding of what cloud computing is more broadly, and how it should and should not be applied in various GIS problem contexts.
You will be creating a variety of cloud GIS services during this course. Most of these will fall under the heading of server GIS. The platforms for this will include GIS infrastructure as a service, GIS platforms as a service, and GIS software as a service. These platforms will be defined in subsequent lessons, along with the five essential aspects of cloud computing.
By the time this course is over, you should feel comfortable setting up and using server GIS using cloud computing, and you should have an understanding of how cloud computing can help solve GIS problems.

Lesson Overview
The first lesson begins with a discussion of the definition of cloud computing followed by the use of the Amazon Web Services (EC2) to create your own cloud by starting and stopping a virtual machine. Finally, we have our first cloud computing discussion, on the overall topic of Cloud GIS.
Lesson Objectives
At the successful completion of this lesson you should be able to:
- set up your Amazon account;
- create an Amazon instance from an Amazon Machine Image. Start, stop, and log in to that instance.
Deliverables
- Complete: L01: Assignment
- Participate: L01 Discussion: Cloud Computing
What is Cloud Computing?
Cloud computing is a concept and a phrase that has become increasingly popular. However, there are a number of competing definitions for what "cloud computing" entails. One very effective definition of cloud computing, which consists of five essential characteristics, three service models, and four deployment models, comes from the National Institute of Standards and Technology (NIST). The final version of this definition [1] was published in October of 2011, and is available from NIST. During this course, we will explore how the essential characteristics and service models in particular can be used in a GIS context. Let's consider them now in turn.
Essential Characteristics
The five essential characteristics can be hard to recall at times. During one sleepless night, I came up with the mnemonic NO-REM as a way to remember them.
N stands for Network access. Cloud computing services can be accessed from a variety of networked devices, such as workstations, mobile phones, and other servers. A GIS example is a geospatial information service that allows access from browsers and from other servers.
O stands for On-demand self-service. Cloud computing services should be accessible at will, without having to consult and get permission from a human being. A GIS example is the ability to start multiple map servers by using a browser interface.
R stands for Resource pooling. Cloud computing resources such as processing power, storage, and input-output (to use the Von Neumann architecture [2]) are provisioned for different clients from a common set of physical assets. Clients need not know (and often cannot know) exactly where the physical assets are. A GIS example is sharing computers owned and administered by Esri, Amazon, or Microsoft, without knowing or caring how these computers are being provisioned (as long as they stay up!)
E stands for Elasticity. Cloud computing services can be scaled up and down to meet demand and decrease waste. A GIS example is processing a large spatial data set quickly using many cloud computers, which are then discarded when the task is done.
M stands for Measured service. Cloud computing services are paid for by resources used (such as processing power, storage capacity, or number of user accounts). A GIS example is paying for a map server only for the hours it is up and the bandwidth it uses, rather than a whole computer.
All of the GIS examples of the essential characteristics are ones that you will experience during this course.
Service Models
The three service models have a definite order to them. Infrastructure as a service (IaaS) is the more fundamental layer, followed by Platform as a service (PaaS) and Software as a Service (SaaS). I was quite impressed with the diagram explaining IaaS, PaaS, and SaaS [3] at venturebeat.com, so I slightly changed it and re-made it below:

As you can see, in the traditional, computer-under-your-desk model, you manage everything. Moving to a Cloud Infrastructure as a Service (IaaS) means that the von Neumann troika of IO, storage, and processors, are managed by the provider, and you bring everything else. In a GIS context, this would mean that you rent computing power from a cloud provider, and use it to solve GIS problems. We'll use the Amazon Elastic Compute Cloud (EC2) running ArcGIS Server to study IaaS.
A Cloud Platform as a Service means that the vendor provides the physical layer, the operating system, and the runtime. You are still able to add your own data and write software that runs on the cloud platform. Facebook, from a developer's perspective, offers a PaaS because APIs (programming tools) are available to write programs that run in Facebook. Google App Engine is another example: Google gives you the computing power and you write the apps.
Software as a Service (SaaS) is a bit easier to understand. You just use it without having to install anything or write any code. Online email is a very good example of SaaS. So is Google Maps. Many GIS and mapping companies are offering mapping and spatial data processing through a SaaS model.
Next, we will get started on the leading IaaS: Amazon's EC2.
Introduction to Amazon EC2
The Amazon Elastic Compute Cloud (EC2) is an infrastructure as a service (IaaS) cloud. This means that it provides computing power and resources that you can use for a fee. You take care of running the software; Amazon EC2 provides the hardware.
To understand Amazon EC2, it’s important to understand the concept of virtualization. When you use your computer at home, it’s very likely that you have one physical “box” sitting on or below your desk, with a power button, disk drives, a video card, and so on. The relationship between the physical machine and the machine you log into is 1 to 1. Virtualization, however, is the idea of hosting multiple “virtual machines” on a single physical box. These virtual machines share some hardware resources, but they appear to the end user as distinct machines that can be logged into and administered separately.
You may have used virtual machines at your place of employment; many companies are using them in the workplace because they are more flexible and cost efficient. Most often, an IT administrator will purchase or choose a powerful machine and configure it to be a “virtual server”, which is a physical machine that hosts multiple virtual machines. Obviously, it takes a powerful computer to act as a virtual server, and it takes a fair amount of IT administration skill to set one up.
Enter Amazon EC2. When you work with Amazon EC2, you create and run virtual machines in Amazon’s data centers. You don’t have to know too much about the details of the virtual servers (nor does Amazon want to reveal this). The idea is that you can focus on the software on your server and let Amazon take care of the hardware needs.
Of course, there is a cost for using these resources. You are charged hourly fees for the computing power used, and for the amount of data that you store on Amazon EC2. Most of the things you can do or use on Amazon EC2 have some sort of fee associated with them, but unless you are running a high-traffic site with many gigabytes of data, computing power and disk space are the two biggest cost concerns.
Advantages of Amazon EC2
The benefits of Amazon EC2 can be enormous in some situations. Here are a few of the immediate advantages:
- You don’t have to purchase or set up a virtual server; instead, you use Amazon’s hardware infrastructure. This is especially useful if you don’t have an IT person on staff, or if you don’t have the money to purchase a virtual server. As you will see later in this lesson, it’s relatively painless to set up your own virtual machine on Amazon EC2.
- You can easily obtain a machine to prototype or test a new application. If your organization is in a financial crunch, all of your machines may be in use or out of date, making it difficult to try new things. With Amazon EC2 you can obtain a machine for a few days or weeks for a relatively low cost, in order to test or learn new software and applications. In essence, this is what you’ll do in this course, as you use Amazon EC2 for just a few weeks so you can learn ArcGIS Server.
- You can easily obtain a server that is public-facing (in other words, that can be accessed by anyone on the Internet). In some organizations it takes a fair amount of paperwork, official approval, and coordination with IT staff to get a public-facing server. This is for good reason, since any time you open up a server to the world, there are a lot more security risks that come into play. Setting up a public-facing server on Amazon EC2 carries somewhat less risk because the machine is not running on your organization’s hardware and can be completely isolated from your network if you choose.
- You can add “auto scaling” rules that add or remove machines depending on how busy your site is at any given time. This is how Amazon EC2 gains the “Elastic” part of its name. This elasticity can be incredibly cost-efficient for certain types of sites, such as those responding to natural disasters. Suppose that you administer a weather site, and one afternoon a string of serious tornados hits. Your site will see a lot more traffic that day, especially if your site gets linked to by other sites. If you were hosting your site on premises, you might run out of hardware, or it might take some time to add new machines. If you were hosting your site on Amazon EC2 with auto scaling rules, your site could temporarily expand to use whatever amount of hardware was needed.
EC2 instances and AMIs
Before going forward, there are two important vocabulary terms that you should understand regarding Amazon EC2:
- EC2 instance – An EC2 instance is a virtual machine running on Amazon EC2.
- AMI – An Amazon Machine Image (AMI, sometimes pronounced “ah-mee” or "Amy") determines the files, settings, and software that are applied when you create a new EC2 instance. You can think of an AMI as a blueprint for creating an EC2 instance. Also, when you work with an EC2 instance, you can save a “snapshot” of your work at any time by creating an AMI. This way, if something ever happens to your instance, you can create a new instance and continue where you left off.
How do you get software like ArcGIS Server running on Amazon EC2?
Esri has created an AMI that has ArcGIS Server installed and configured. You will use these AMIs to create EC2 instances, thereby getting the server software running on Amazon EC2. Once you get the instance running, you can log into it using an application called Windows Remote Desktop. This is the same way that you would remotely log in to any other computer in your network, except this time the machine is outside your network, running on Amazon EC2.
You can perform all of these steps on your own home computer as long as it has an Internet connection. In fact, it's recommended that you use your home computer because some workplace IT departments have placed restrictions on accessing computers outside the firewall (like Amazon EC2 instances) using Remote Desktop. Please note that you cannot use a personal hotspot through a mobile phone to log in to your EC2 instances.
Introduction to Cloud and Server Security
Security is one of the biggest issues that causes organizations to hesitate when they consider cloud computing. It is a natural reaction, after all for most modern organizations, their data is their lifeblood. How could we entrust that to people we don't know and have little control over?
It may surprise you to know that in the eyes of many security experts, using cloud computing can make your data more secure, not less secure, as long as the correct procedures are followed. Which makes sense when you think about it, it's another aspect of the benefits of scale. I have a lot of confidence in the computer security folks here at Penn State; they are excellent. I'm also pretty confident that Amazon and Google employ even better computer security experts. However, no experts can protect you from yourself; if you start up a server, expose it to the world, and fail to patch it, it will get hacked. Therefore, the key is to follow the correct procedures.
This page describes how to safely complete this course and gives some general guidance and pointers to further information on how to safely administer a server in production.
Security in this course
In this course, we will be learning about and experimenting with a variety of cloud computing technologies. The most important method you should follow to use them safely is simply to follow the directions in the course in their entirety. Don't skip steps. Further general guidelines for security in this course can be divided into two parts. We will first use Infrastructure as a Service, by starting server instances on Amazon's compute cloud. Later in the course, we will use Platform as a Service and Software as a Service services like ArcGIS Online, Carto, and Mapbox. Good security practices for the second part of the course (platform and software as services) are easily described; use a strong, unique password for each service. If managing multiple strong passwords is an issue for you (I think it is for most humans), consider using software like 1Password [4]. The rest of this section gives some guidelines for safe usage of Amazon server instances for the Infrastructure as a Service portion of the course.
- Stop your instances when not in use. As a general guideline, you should stop your Amazon cloud server instances while you are not using them. A good workflow while using cloud computer instances is to start them when you want to begin a work session, and then stop them when you are done. After all, a computer that is turned off is one that cannot be remotely hacked. Do not terminate an instance that you care about; it will be irretrievably deleted.
- Understand the basics of public-key cryptography. Amazon relies on public-key cryptography to give you safe access to your instances. You are given a key pair file that you use to retrieve the initial administrator password for your EC2 instances. Keep your key pair file in a safe place where you can find it and make sure it is not exposed through any web-facing folder.
- Don't surf the Internet from your servers. Please do not use the browsers installed on your cloud computing instances to go to any website that you do not 1.trust, and 2.need to access to complete your work. There are a lot of security vulnerabilities in JavaScript, Flash, and other entertaining and productive technologies. We accept these vulnerabilities in daily life because we want to use Internet services and because the consequences of a security breach while using a computer as a regular user are not too severe. However, while you are logged into a server as an administrator, you must not go surfing around the web. Only visit websites you must visit and that you trust. Should you visit CNN.com? No. Should you visit our course website to download a file for an assignment? Yes.
- This last one is somewhat advanced and doesn't apply to exercises in this course, but it's worth sharing anyway. Be careful when making and sharing images based on EBS volumes (Amazon EC2's version of "hard drives"). Also, be very careful with whom you share access to the "hard drive" EBS volume that the instances uses. You should never make a public copy of such an EBS volume. Even files you have deleted may still be accessible to anyone you give access to. Amazon EC2 guru Eric Hammond ran a little contest to illustrate the dangers. He made a text file on an EBS volume that contained a gift card number, and then deleted it. He then made a public copy of the EBS volume and invited the readers of his blog to try to retrieve the "deleted" file and claim the prize. Soon there were posts from multiple people who were able to read the file. Details are here: Hidden Dangers in Creating Public EBI Snapshots on EC2 [5].
Even if you are not going to be sharing copies of your instances, you may need to think about how to safely put your server into production.
Security for servers in production
A production server is one that is serving your business content, live, to end users in a highly available and highly secure manner. A complete guide to production server security is unfortunately outside the scope of this course. We are not setting up servers that are ready to go into production. However, we will be covering some aspects of server security as we go along in the course. In addition, here are some general principles that you should know:
- Turn off operating system components and services you are not using. If a computer is being used as a machine to lauch web servers and databases, but is not running a web server or a database itself, then disable the web server and database software on that computer.
- Limit account access. Use an administrative account only for administrative tasks. Normal usage should use an account with more restricted rights.
- Limit port access. Use firewalls to restrict port availability, and be cautious when opening ports. If you are using Amazon Web services, use Security Groups as well as a firewall on your operating system for defense in depth. A good introduction to using Security Groups [6] can be found at rightscale.com.
- Sanitize any input allowed into your system. For example, if you allow people to upload images, test the uploads before saving them on your system to make sure they are valid images rather than malicious files. Be especially cautious of SQL or other data manipulation input.
- Keep your operating system and server software patched and up to date.
- Back up your data and systems. Data which is not backed up will eventually be lost. Failure rates for individual computer instances are usually high in a cloud environment, due to the use of commodity hardware. A good backup strategy involves backing up your data to two separate physical locations or two different "Regions" on Amazon EC2. Keeping a remote backup of your server can be a lifesaver in an emergency, and can make you a hero if you can get the system restored quickly. A good strategy for EBS-backed instances (that is the most popular kind of instance and the kind that we are using in this course) is to take regular snapshots of the boot EBS volume. You can then easily create a new server instance from one of the snapshots if disaster strikes.
- Don't share your private keys or passwords with anyone. Responsible administrators will never ask you to share this kind of information. I'm sure you have already heard this, but it bears repeating.
A good resource for how to safely run a server in production is the National Institute for Standards and Technology's "General Guide to Server Security [7]," accessible at csrc.nist.gov/publications/nistpubs/800-123/SP800-123.pdf. It describes the necessary planning steps, how to secure your operating system, how to secure your server software, and how to maintain your security. It also describes the multiple personnel roles that are involved in good security practices. If you will be involved in helping to administer a server in production, I suggest you read this guide and follow its recommendations.
OK, enough of the heavy stuff; it's time to start your first cloud computer in this course, an Amazon instance!
Setting up your first Windows instance
Let's create an EC2 instance that is running Windows. The purpose of this exercise is to get you familiar with the basics of Amazon EC2 using some familiar software. Before you attempt this part of the lesson, you need to make sure you've obtained an Amazon account and enabled it for use with Amazon EC2. This should have been covered during the course orientation.
If you have any doubt about the above, contact the course instructor.
Here are the steps for getting Windows running on Amazon EC2. Since Amazon can potentially update their site at any given time, some minor adjustments may be required for these steps. Contact the instructor if you have questions, or, if you find an issue that you are able to work around, please mention it in a comment in the Technical Discussion forum.
- Open a web browser to Amazon's AWS Management console page [8].
This application is called the AWS Management Console, and it helps you create and manage things on EC2, such as instances. This app has some quirks, and I've found that I have to run it in the Google Chrome browser to completely avoid them. Sometimes it will work in Firefox. - Click Sign in to the AWS Console.
- If prompted to choose a Root or IAM user, select the Root option. In a production environment you would likely want to create other IAM users under which to run things. It's generally not recommended to use an Admin or Root login for day-to-day operations, but for our purposes in 865 it will be just fine.
- Sign in with your Amazon account name and password.
You should be taken to a screen with a bunch of Amazon Web Services listed, such as Elastic Beanstalk, S3, etc. These represent all the types of web services that Amazon offers. For now, you're interested only in EC2, which is Amazon's set of web services for renting hardware infrastructure. - Click the EC2 link. On the right, you'll see a summary of all the items you have running in Amazon EC2. There should be nothing listed. On the left, you'll see a menu of different categories of things you can create in EC2, such as Instances, Volumes, Elastic IPs, etc. You'll learn about a few of these as we go along.
In the upper-right corner, notice that a dropdown list allows you to pick the region you want to work in. It likely reads "US East (N. Virginia)" or a location closer to where you live. Amazon runs EC2 from various data centers placed around the world. You can choose which data center, or region, will house the resources you create. Typically, the closer you can place your region to your end users, the faster your services and apps will appear. But some organizations may also pick a region based on legal requirements relating to countries that can or cannot house their data. Be aware that costs are slightly higher in some regions. You can see a list of costs at Amazon's Elastic Compute Cloud Pricing page [9]. For this course, set the region to "US East (N. Virginia)."
Before you launch an actual instance, you'll create an Amazon virtual private cloud (VPC) which is sort of your own special space carved out of Amazon's cloud. Instances in a VPC can see each other and your own network fairly easily, but they're not immediately accessible from elsewhere without some extra work on your part. That's a good thing for security. - Click the Services dropdown in the upper left and click VPC (it's under Networking & Content Delivery).
Creating a VPC is potentially a very technical and complex activity, but it's something most people have to do at first. For that reason, Amazon has made a wizard for setting up a real basic VPC. This will suffice for our purposes. - Click Create VPC.
- Select the the VPC and more option.
- Leave the Auto-generate box checked, and enter a name like Geog865VPC in the box below it.
- Leave the default value, 10.0.0.0/16, in the IPv4 CIDR block box. This is a default private IP address [10] range for your machine that's only visible to other machines within your VPC. You'll create an Elastic IP later which will be the public address we'll use with ArcGIS Enterprise.
- Leave the other options in their default settings and click Create VPC.
- Click the Services dropdown in the upper left and click EC2 to go back to the EC2 resources page.
- From the left menu, click Instances. Ensure that you are using the N. Virginia region, then click the Launch Instance button.
Now you're at a place where you can type a name for your instance. It used to be that your instances in the console were just assigned an ID. This was hard to keep track of once you had more than just a few instances, so Amazon allows you to type other metadata about the instance. This is stored as name/value pairs.
- Enter something like, Geog 865 Windows instance, in the Name box.
- In the list of AMIs, browse in the Windows section and select the one that's called Microsoft Windows Server 2019 Base.
The next section provides Instance Type options. On this panel, you'll choose the size, or computing power, of your instance. Micro instances -- low-resource options suitable for many trial situations -- is the type selected by default on this panel. Note that the instance size you choose drastically affects the price that you pay, so follow these instructions carefully.
- Select t2.micro. This instance is sufficiently powerful for what we need to do, and at the time of this writing, it's part of the AWS free tier, which means that you won't be billed against your credit card until the free credits that AWS provides in their Free-Tier are exhausted. Then click Next: Configure Instance Details.
The next step in this process has to do with logging into your instance for the first time. You need to get special file called a key pair that allows you to retrieve the instance's administrator password. This is a one-time action; you can use this key pair for the rest of the instances you launch in the course.
- Click the link to Create a new key pair, type a name for your key pair (e.g., geog865), then click Create Key Pair. A small, text-based file with the extension of .pem will be downloaded to your machine. Keep this key pair file in a safe place that you remember for later in the course.
- In the Network Settings section, a default VPC may be selected. We want to use the VPC we created in the previous steps, so click the Edit button and change the drop-down selection to show your VPC as the destination network for this instance.
- Confirm that the Subnet box shows one of your "public" subnets. This specifies that the resource we are creating will have access to the Internet.
- Leave the Create Security Group option selected and enter a name like, Geog 865 Security Rules and a description, if desired. Machine instances you create will operate under the firewall settings you specify here.
Your new security group will start out with a rule allowing Remote Desktop (RDP) access, so you can log in to your instance and administer it. Windows Remote Desktop requires port 3389 to be open. Note the Source IP address, which defaults to Anywhere (0.0.0.0/0), which basically allows any IP (i.e., any computer) to use Remote Deskop to access your machine. You do not typically open RDP access to all addresses ( 0.0.0.0/0 ). Instead, you specify your local computer's IP address or your organization's range of IP addresses using; this is a much more secure approach that you would use in a production setting. For our purposes in Geog865, leave the option set to Anywhere (0.0.0.0/0). This allows any computer to use Remote Desktop to contact your Instance. They will still need your Windows username and password to log in, but the firewall on your EC2 instance won't block it. This will avoid difficulties if you happen to use a different computer to work on your instance, or if you use your laptop in a public wi-fi environment, like Starbucks, which will assign your computer a different IP everytime you connect.
- Click the Add Security Group Rule button and select HTTP from the Protocol dropdown list, with a source of Anywhere. You have just allowed HTTP access on Port 80 to everyone, thereby letting Internet users access your web services. Port 80 is the most common port used on the Internet for incoming web traffic into a server.
Some of the other settings are beyond the scope of this course. However, you will enable Termination Protection. Terminating your instance deletes it forever. Termination Protection is nothing fancy; it just prevents you from terminating an instance until you explicitly disable termination protection on the instance. It's a way of making you go through an extra step to make sure you don't accidentally do something you didn't intend to do, which is helpful for beginners.
- Expand the Advanced Details section and Enable Termination Protection.
- The last section shows a summary of the instance that will be created. Examine it, then click Launch Instance.
- Return to the Instances section of the EC2 console, where you should see your instance listed. Within a minute or two, you'll see its status change from pending to running, but this does not mean the instance is ready yet. It takes around 10 minutes for Windows and the software running on your instance to configure itself. It's best not to disturb the instance while this is occurring.
Because you created your instance in Amazon VPC, it's not publicly visible by default. Furthermore, the name of the instance will change every time you stop and start the instance. In order to reach your instance in a consistent fashion from a remote desktop connection, you'll need to set up an Amazon Elastic IP. This is an unchanging address that Amazon allocates to you for your use. You can then associate it with any instance you choose. Every time you stop and start the instance, you'll associate it with this IP address.
- At least 10 minutes after performing the previous step, open the AWS Management Console, enter the EC2 Dashboard, and click Elastic IPs.
- Click Allocate New Address, and then Allocate using Amazon's pool of IPv4 addresses.
- You should see an address appear in your list of Elastic IPs, such as 107.20.220.152. (You may need to Clear Filters to see any other IPs you already have.)
- Check the box next to your new Elastic IP and click Actions > Associate address.
- Choose your Geog 865 Windows instance from the dropdown list and click Associate.
IMPORTANT NOTE: The Elastic IP you create at this step must remain constant for the duration of this course. Please avoid deleting the Elastic IP or using new ones. You may create and destroy machine Instances, to which you associate the Elastic IP, but the Elastic IP itself must stay the same.
- Notify me as soon as you've established your Elastic IP. Tell me what your Elastic IP is so I can help get a domain name for your server (a requirement for ArcGIS Enterprise). I will also help get everyone an SSL Certificate for your server (also a requirement for ArcGIS Enterprise). The Certificate will be associated with your domain name, so we need to get that established first. The process of registering domain names takes some time, so try to get me your IP as soon as possible.
Once you launch an instance, the instance starts automatically and your Amazon bill begins accruing. It's very important to understand that you begin amassing charges right away; Amazon does not wait until you log in to your instance to begin charging you. In order to control costs, you need to stop your instance whenever you aren't using it. Before you take a break, please immediately continue reading the next section of the lesson to understand how to properly stop and start your instance.
How to stop and start your instance
Fortunately, you don't have to repeat all the previous steps to complete the Launch Instance wizard every time you want to use Amazon EC2. Once you have an instance created, it's fairly easy to log in, start, and stop it. Before we talk about logging in, let's cover the basics of how to stop and start the instance. You'll need to begin using these techniques immediately, every time you use your instance, in order to keep costs down.
When people begin using Amazon EC2, they often ask about the difference between logging out, stopping, or terminating an instance.
- You can close your Windows Remote Desktop Connection session or click the Windows Log Out button when you are finished using your instance. However, this does not stop the instance and you continue to accrue charges for it.
- You can stop the instance, which is akin to pressing the power button to turn off your physical machine on your desktop: the machine is still there, and you can start it later, but it's not using any resources like electricity, spinning its CPU, etc., and it's not getting charged by Amazon. (Amazon does continue to charge you for the disk space your instance is using, but this is a relatively small charge.) When you are working through this course, you should stop the instance when you are finished working on the lessons for the day. When you are ready to go back to the lessons, you can start the instance and continue working with your programs and data.
- You can terminate an instance, which makes the instance go away forever. The only thing left behind is any disk drive that was attached to the instance. Terminating your instance will hopefully not be necessary until the very end of the course; however, you can keep it as an option if your instance gets corrupted. If you terminate your instance, then you will have to create a new one using the steps in the previous section of the lesson for the Launch Instance wizard.
If you fail to stop your instances after you have finished working, you will quickly use up the Amazon Free-Tier credits and start seeing charges to your credit card.
Below are some reference instructions that you can use to stop and start your instance (Do not stop your instance for at least 10 minutes after you first launch it. It needs time to configure Windows for the first time.)
You can return to this page throughout the course if you need help remembering how to stop and start your instance.
Stopping your Windows instance
Use the instructions below to stop a Windows instance like the one you created in Lesson 1. Do not use these instructions for ArcGIS Server instances.
- Log in to the AWS Management Console and open the EC2 page.
- Click Instances.
- Right-click your instance and click Instance state > Stop.
This stops the clock on the charges for running your instance. When an instance is stopped, no one can use your server and you cannot log in.
Starting a Windows instance
Use the instructions below to start a Windows instance like the one you created in Lesson 1. When you start your instance, it takes a few minutes to boot up, but you shouldn't have to wait the full 10 minutes that you waited when you first launched the instance. Always follow the instructions below when you start your instance:
- Log in to the AWS Management Console and click the Amazon EC2 tab.
- Click Instances.
- Right-click your instance and click Instance state > Start.
- Wait at least 10 minutes so that the machine can start up and configure itself correctly.
- If you notice that your machine Instance no longer has your Elastic IP associated with it, click Elastic IPs and check the box next to your Elastic IP.
- Click Actions > Associate Address, choose your instance from the drop-down list, and click Associate.
After a few minutes your instance will be ready to use with its Elastic IP. After enough times of repeating this action you should have these instructions memorized.
Viewing your bill
To view your accrued charges at any time, go to the AWS Management Console Billing page [11]. You can see detailed reports of your usage of each part of the service by clicking the Bill Details button at the upper right of the main Billing page.
I recommend that you view your credits after every lesson so that you understand whether you are in danger of excessive charges. If you consistently stop your instances after you are finished working, your costs will remain small.
Logging in to your instance
After you've given your instance about 10 minutes to configure Windows, you can get ready to log in to the instance and start working with your software. The first thing you need to do is get the Administrator password so you can log in.
- Log in to the AWS Management Console and view your list of instances, as you did in the previous walkthrough (Services > EC2 and then click Instances in the left menu).
- Right-click your instance and click Get Windows Password.
- Click Browse... and browse to the key pair file you saved in the previous walkthrough when you launched the instance. This is a small file with a .pem extension.
- Click Decrypt Password and copy or write down the displayed password.
- Open Windows Remote Desktop. In most versions of Windows, you can browse to this from Start > All Programs > Accessories > Remote Desktop Connection. In older versions of Windows, it may be in a folder called Communications.
Note: If you're using Windows 8.1 (or later) or any machine with a very high resolution display, you might notice that your Remote Desktop has very, very small fonts, making your EC2 instance difficult to use. In this event, you might like to (as I do) use Microsoft's "Remote Desktop Connection Manager" tool. It has the same functionality as Remote Desktop Connection, but with the ability to smartly scale the size of the screen.
Remote Desktop is a program that you can use to log in to other computers from your own computer. If you're new to Remote Desktop, you may want to take some time to read Remote Desktop Connection: frequently asked questions [12]. - In Remote Desktop Connection, click the Options button > Local Resources tab > More button and check the box for Drives. Then click OK. This will permit you to copy data from your machine onto the remote machine (in this case, your Amazon EC2 instance).
- In Remote Desktop Connection, under the General tab, type or paste the Elastic IP of your instance into the Computer input box. If you can't remember what this is, click Elastic IPs in the AWS Management Console and you will see it listed.
- In the User name input box, type Administrator. Then click the Connect button.
You might see a warning message here about remote desktop connections harming your computer. Anytime you connect to a remote computer, there is the possibility that a malicious party could try to pose as the machine you are logging in to. Older versions of Remote Desktop were especially susceptible to this type of "man in the middle" attack. The work you are doing for this course is relatively benign and low risk, so you can click Connect.
If you are using a computer at work, it's possible that Remote Desktop connections to machines outside your corporate firewall are blocked. If this is the case, you need to work with your IT administrator to open communication through port 3389 on your machine to all machines in the Amazon subnet. If you work in a high-security environment (or any environment with lots of red tape), getting approval to change a firewall rule like this may be difficult or impossible, and it will be easier to perform these steps from home instead. - In the Password input box, carefully type or paste the administrator password that you obtained in the first few steps above (sometimes Windows will not allow you to paste a password). Then click OK.
You may see a window warning you that the identity of the remote computer cannot be verified. You can ignore this warning and click Yes.
In a few seconds, you should see Windows appear. You are now working in a remote desktop session that is connected to your Amazon EC2 instance. This behaves just like any program in Windows. You can minimize it or close it, but note that closing your remote desktop session does not stop your instance. Your instance will continue to accrue charges until you right-click it in the AWS Management Console and click Stop. This is what you should do if you are interrupted while performing these instructions, or need to take a break at any time.
The first thing you'll do on your instance is change the administrator password to something that only you know and can easily remember. - On your instance (not your own computer), click the search magnifying glass icon in the lower left and find Computer Management.
- Expand Local Users and Groups and click Users.
- In the list of users, right-click Administrator and click Set Password > Proceed. Type and confirm a new password that you can remember. In the future, you can use this password when logging in to your instance.
- Now do a bit of exploring around the machine. Notice that you have the basic Windows programs available to you.
- Take a screen capture of your entire desktop and save it to your local machine as evidence that you made it this far. You will need this in your lesson deliverables. At least some part of your Remote Desktop session should be visible in the screen capture, although you may also have to display part of the desktop of your local machine before you can successfully take the capture onto the local machine.
- Open Windows Explorer (using the little file folder icon at the bottom of the screen) and click This PC. Notice that your instance has a 30 GB C: drive (which we could have made bigger when we launched the instance). You should also see all the disk drives from your local computer listed (go ahead and browse them). This is how you can copy files from your own machine onto your EC2 instance.
The purpose of launching this instance was to show you how you can use the AWS Management Console to create and log in to a virtual machine. We're not going to use it for any future assignments, although an instance like this might be useful if you need a certain program or a particular level of computing power just for a short time.
In future lessons, we'll work with Windows instances similar to this one that are running ArcGIS Server. You will make remote desktop connections into them, change the administrator password, and move files around in the same way that you have observed here. Therefore, although there is no GIS in this lesson, the material covered here lays down the fundamentals that you'll use for at least the next three lessons and possibly your term project. - When you are done looking around in the instance, close your Remote Desktop session and stop the instance using the instructions in the previous page.
If something goes wrong with your instance, you can terminate it and create a new instance.
Typically when you log in to your instance, you'll open Remote Desktop Connection and type the user name Administrator, followed by the new password that you set above. To end your session, you can just close the remote desktop window. If you are going away for more than an hour, also make sure to stop your instance in the AWS Management Console.
Assignment: Reflecting on your first AWS walkthrough
The first few lessons of this course have relatively lengthy technical walkthroughs with lots of moving parts, therefore your assignments will largely consist of showing evidence via screen captures that you were able to complete these steps. I'll also ask one or two reflection questions that you will answer to accompany these images. In Lesson 4, you'll have the opportunity to complete a more complex walkthrough and make a video demonstration of your work.
Deliverables
Please create a new document and put the following in it:
- The screen capture that you were instructed to take at the end of the walkthrough when you created your first Windows instance.
- A thoughtful paragraph or two answering the following question:
Think about your current workplace (whether GIS-related or not) and how it uses computers and information technology. Then think about your recent experience launching a brand new Windows instance onto which you could do all kinds of things. What are some ways that using virtual machines on an IaaS cloud like Amazon EC2 could benefit everyday computing and IT operations at your workplace? What are some technical or logistical obstacles that your workplace might face with using virtual machines on the cloud? If you aren't currently employed or you are a full time student, consider this question from the perspective of a former job you've had, or a graduate student using computers to conduct research.
Submit your document to the lesson drop box on Canvas.
Cloud Computing Discussions: Introduction
Cloud GIS
Cloud GIS is an emerging set of technologies, concepts, and work practices, rather than a settled set of services. This course is intended to provide you with both practical skills that you need to use cloud computing in your everyday work, and also the background and critical thinking you need to make decisions about how cloud computing should be used in your organization.
Cloud computing discussion
Most lessons feature a cloud computing discussion page that presents an important aspect of cloud computing and encourages you to envision its potential impact on GIS systems. Many of these will be accompanied by required readings that will guide you toward the discussion. We'll use several free online chapters of Rosenburg and Mateos' The Cloud At Your Service. Buying the entire book is optional, but I will list other chapters from it that will be helpful in some of the discussions.
The trends we will cover this term are:
- GIS cloud computing
- Cloud computing and you
- Cloud computing economics
- Cloud security
- Cloud architectures
- Cloud service vendors
- The future of cloud computing
I'll ask you to participate in threaded discussions with your classmates based on several prompts that I will provide on the topics above. These constitute an important part of your participation grade.
On the next page, you'll find your first cloud computing assignment. In this assignment, we will examine what cloud computing is, how we are using, and how we plan to use cloud computing in GIS.
Cloud Computing Discussion: Cloud GIS
Cloud Computing Discussion: Cloud GIS
First, please read Chapter 1 in Rosenberg and Mateos's The Cloud at Your Service [13]. The book is available as a free preview from the publisher's website. Purchasing the entire book is optional for this class, and not required.
Also, please read this paper:
and this one:
Cloud Computing: A Solution to Geographical Information Systems (GIS) [15].
Please note that I am not endorsing the opinions expressed in these papers, instead, I am hopeful that these papers will stimulate a good discussion. Please feel free to agree or disagree with the authors.
Deliverables for this week's emerging theme:
- Post a comment directly on the discussion forum in Canvas that describes how you see cloud computing being used in GIS work, and conversely, how cloud computing might need to change to fit the needs of GIS, in addition to any reactions you have to the papers above.
- Then, I'd like you to offer additional insight, critique, a counter-example, or something else constructive in response to one of your colleagues' posts. For possible full credit on this assignment, you need to do both.
- Brownie points for linking to other technology demos, pictures, blog posts, etc., that you've found to enrich your posts so that we may all benefit.
Lesson 2: ArcGIS Server up and running on Amazon EC2
Overview
In the previous lesson, you learned the basics about servers and clouds, and you got some experience setting up an EC2 instance. In this lesson, you’ll learn a little bit more about how a server can augment your GIS. You will also set up a new instance running Esri ArcGIS Server, which you will use in Lessons 2 through 4.
ArcGIS Server is just one part of Esri's ArcGIS Enterprise product suite that they market for sharing GIS across the web and internal organizational environments. We'll discuss ArcGIS Enterprise and Portal from time to time in later lessons; however, we are going to focus on ArcGIS Server here. Fortunately, the ArcGIS Server piece is relatively easy to get running in the cloud, and we'll concentrate on ArcGIS Server to understand how maps and GIS datasets you make on your desktop are exposed across the web.
Although you could potentially install ArcGIS Server on your own home or work computer, in this course, you will run ArcGIS Server on the Amazon Elastic Compute Cloud (EC2). Basically, you pay Amazon an hourly fee to run ArcGIS Server on their machines. This is an easy way to practice with a real server without compromising or adjusting your own machine. Running ArcGIS Server on Amazon EC2 also helps you learn about the cloud by using it.
Lesson Objectives
At the successful completion of this lesson, you should be able to:
- understand cloud computing architectures in an infrastructure as a service (IaaS) model;
- set up an ArcGIS EC2 instance;
- understand the methods of moving data to the cloud;
- create a simple map service on that instance accessible via the Internet.
Deliverables
- Complete L02: Assignment
- Participate L02: Discussion
Introduction to ArcGIS Server
ArcGIS Server is Esri software that allows you to expose your GIS as a set of web services. It is just one component in a larger software suite called ArcGIS Enterprise that enables organizations to deploy their GIS onto the web. In Lesson 5, we'll talk more about the different parts of ArcGIS Enterprise.
Web services are software code or components that run on a specialized machine called a server. Web services receive requests from other apps and machines, called clients. The request might be to send some information or process some data. GIS web services do things related to sending and processing geographic information. Here are some examples of types of web services offered by ArcGIS Server.
- A map service exposes your map as a web service. It originates with an ArcMap document (MXD) that you "publish" on the server. Clients can use the map service to request a map image at any scale or extent in a variety of image formats. Depending on how the service is configured, the server either draws the map on the fly, or sends back some pre-drawn map images (tiles) that are retrieved from a cache. Clients can also request the geometry (vertex locations) and attributes of any feature in the map.
- A geoprocessing service allows clients to request that the server perform some GIS action or analysis and send back the result. For example, the client might send the vertices of a parcel to the server and request that the server run a model to buffer the parcel and select all other parcels that fall within the buffer. A geoprocessing service works with tools and models that you have run in ArcMap.
- A geometry service calculates lengths, areas, and spatial relationships.
- A number of other service types allow for synchronizing geodatabases over the Internet, analyzing raster images, and so on. Additionally, ArcGIS Server services can expose further, optional subsets of actions through a concept called “capabilities.”
ArcGIS Server components
ArcGIS Server works through the concept of distributed computing, in which you can increase the power of your server by adding more physical machines. For this reason, ArcGIS Server is made up of several different components that you can either install all on one machine or spread out among many machines. We won’t examine these components in much detail in this course, because you will have ArcGIS Server installed for you, and you will only be using one machine. However, below is a brief introduction of the most common components.
- GIS server – The GIS server is the component where ArcGIS Server does its work. You can install the GIS server on one or many machines (although you are required to have paid the applicable Esri licensing fees for each machine). If you want to add more computing power to your ArcGIS Server system, the easiest way is by installing the GIS server on more machines and connecting them to your system.
The default setting is for all GIS servers in your site to make available the same set of web services, meaning you could make a request to any GIS server for any service. The GIS servers communicate with each other and distribute the load evenly. For advanced workflows, you can optionally organize the GIS servers in "clusters" that run dedicated subsets of services. For example, you might have three normal sized machines in Cluster A that run all your map web services, and one big machine in Cluster B that runs your geoprocessing web services. - Web server and Web Adaptor – The GIS server component mentioned above has some rudimentary ability to serve out web services, but in most deployments of ArcGIS Server, you'll want to connect it to your organization's existing web server. The web server receives the web service requests when they first come in from client applications. It then forwards the requests to the GIS server. Esri makes available a supplemental installation called the Web Adaptor, whose purpose is to connect ArcGIS Server with your web server.
Including a web server in your architecture allows you to monitor and control the URL or web address that people use for your server. Some organizations also perform authentication (challenging the user for a name and password) at the web server level of the architecture. Web servers can further be configured to block traffic from specific addresses, providing a layer of protection for your site.
A web server is also useful for hosting web applications. Once you design a nifty app to show off your web services, you need a machine to host it on. This machine should be a secured server that can handle the amount of traffic coming into your app. In this course, you'll use the same EC2 instance for your web server and GIS server, which is a common practice in small deployments. The web server software you'll use is Microsoft Internet Information Services (IIS). It comes pre-installed on your instance. - Database – Most servers sit between a client who wants some specific piece of information and massive collections of raw data sitting in a database. Web services provide structured access points to the data. The location of your GIS database is important to consider when building a cloud architecture for ArcGIS Server.
In ArcGIS Server deployments, the data can either reside in a collection of files (such as Esri shapefiles or file geodatabases), in a larger relational database management system (RDBMS) such as Oracle or Microsoft SQL Server, or in the built-in DataStore. Certain "middleware" components of the ArcGIS Server software facilitate communication between ArcGIS and the RDBMS (in former days these components were called ArcSDE).
The database can either reside directly on the ArcGIS Server machine or it can reside on its own dedicated machine. Putting the data and ArcGIS Server on the same machine can save money, but the database and the server compete for resources and this architecture ultimately has problems with scaling.
No matter where you put the data, you need to register your data locations with ArcGIS Server [16]. This provides the server with a list of known data sources. If you attempt to publish a web service to ArcGIS Server and the data sources are not registered with the server, the data is copied to the server [17] at the time that you publish. This may be a convenient way to copy small datasets to the cloud, but it is not a scalable way to transfer and organize large amounts of data.
Because migrating a large database "across the wire" to the cloud is cumbersome, many individuals wonder if they can deploy a server in the cloud and leave their database "on premises". Such an architecture results in multiple "hops" between geographically dispersed servers just to satisfy one request and is not nearly as efficient as situating the database in the cloud.
ArcGIS Server accounts and security
When you run a program on the Windows operating system, it runs as a specific user account and can only do things that the account can do. This is why you sometimes see Windows popping up messages that the program needs Administrator permissions to continue. That type of message means that the account running the program is not an administrator, so you need to manually confirm that it should temporarily be allowed to do something that only an administrator would ordinarily be allowed to do.
ArcGIS Server uses an account to run the GIS server, called the ArcGIS Server account [18]. This account is specified during the ArcGIS Server installation. You won't do much with the ArcGIS Server account in this course because it comes preconfigured when you run ArcGIS Server on Amazon EC2.
If you run ArcGIS Server in your own organization, you need to remember to give the ArcGIS Server account permission to read any GIS data used by the server. The account also needs permission to write to any datasets you will edit.
How you will work with ArcGIS Server in this class
In this class, you’ll work with your own ArcGIS Server that runs on Amazon EC2. It has a GIS server and the ArcGIS Server account already configured. After logging in to your server, you’ll publish some map services and use them in a web app that you create. You’ll also learn techniques for speeding up your map services, using a tile cache, and how to use a map service for web editing.
This lesson gets you to the point of setting up a server, publishing a service, and making a simple web map on ArcGIS Online.
Introduction to ArcGIS Cloud Formation Templates
In the previous lesson, you used the AWS Management Console to set up an EC2 instance. When you build an ArcGIS Server site on Amazon EC2, you typically use a different approach, in our case, a resource called Cloud Formation [19]. This consists of a text file that pre-defines all of the parameters of the site you intend to build on the AWS platform, which can be deployed to install everything in an unmanaged manner. Cloud Formation templates exist, which can be customized to deploy the precise system you need. ESRI has developed Cloud Formation Templates that are already set up to do the heavy lifting of installing ArcGIS Enterprise in AWS, leaving us to provide only a few parameters.
It's possible to build simple one-machine ArcGIS Server sites manually with the AWS Management Console. You can even put several of these "siloed" sites under a load balancer to get more computing power. However, to get the full benefit of the ArcGIS Server architecture, in which multiple GIS servers process and balance loads in a peer-to-peer fashion, Cloud Formation Templates are the way to go.
Getting access to the ArcGIS Enterprise AMIs
Cloud Formation uses some Esri-created Amazon Machine Images (AMIs) behind the scenes to create your ArcGIS site. These AMIs have ArcGIS Server, ArcGIS Pro and in some cases, a database installed on them.
The AMIs require that you "bring your own license" and apply it to any Esri software that you run on the EC2 instances. In other words, Esri pricing is not built into the hourly fees for the instance, like it is with Windows. The Esri AMIs are accessible by anyone in the AWS Marketplace, but you must log in with your Amazon account and accept the terms and conditions for using them.
- Go to the AWS Marketplace page for the Esri ArcGIS Enterprise 10.9.1 AMI [20].
- Click the Continue to Subscribe button and log in with your Amazon account.
- Click to Accept Software Terms.
This doesn't actually launch anything right now, it simply establishes that you agree to the terms of using the particular AMI, but if you don't perform this step and accept the terms, Cloud Formation will fail when you try to create a site. In fact, if you ever experience Cloud Formation failures in the future, you should check to make sure you have accepted the software terms for the exact AMIs that you are trying to use. There's nothing else you need to do on the AMI Marketplace page.
Security Requirements for ArcGIS Enterprise
Recent versions of ArcGIS Enterprise and Server now require that all communications be performed over a secure channel. This means that anyone making a request for a map service or web app from your ArcGIS Enterprise/Server machine must do so using the https protocol rather than traditional http. You may have noticed that many websites you visit now appear with an https URL. Https uses something called, Secure Socket Layer (SSL) to encrypt all traffic that is sent between clients and the web server. In this way, any text that's sent, including passwords, usernames, and other content, is protected from hackers who might try to intercept or monitor it. Implementing SSL on a web server is good practice, which is why many websites and web services are utilizing it.
Enabling SSL on a web server isn't a trivial process, however, and it requires that an SSL Certificate be obtained and installed. SSL Certificates are issued by authoritative providers that verify the identity of your web server and provide an assurance that the communication channel clients establish with the server are properly encrypted. It makes sense that only authorized providers issue SSL Certificates, otherwise anyone could generate them and deploy them improperly. Further complicating this process is that SSL Certificates are attached to the fully-qualified domain name rather than the IP address of a web server.
Every web server has an IP number, which has the form xxx.xxx.xxx.xxx, that uniquely identifies it on the Internet, but clients typically don't use that number to communicate with it. Instead, clients (like you in your web browser) use a fully-qualified domain name to call a server. A fully-qualified domain name is a URL you would enter to visit a website, for example, www.pasda.psu.edu [21] or www.arcgis.com [22]. Domain names are linked to IP addresses using a registry called DNS (Domain Name System). Anyone wanting to attach a domain name to their server's IP must make a request to a DNS server. This request is performed by authorized Internet service providers.
So, to enable SSL on our ArcGIS Enterprise/Server machines, we need to do two things: (1) assign a unique, fully-qualified domain name to our Elastic IP in DNS, and (2) generate and install an SSL Certificate that refers to our domain name. To facilitate the setup of our ArcGIS machines in AWS, I have performed these steps for you. I assigned you a domain name in the form, namegeog865####.e-education.psu.edu, and registered it in DNS by linking it to the Elastic IP you created in Lesson 1. I also generated SSL Certificates for you using the same domain name I assigned you. That being completed, the process of installing and configuring these on your ArcGIS machines is trivial using the Cloud Formation Template; all you need to do is reference your domain name and SSL Certificate in the template and Cloud Formation does the rest.
Building an ArcGIS Server site with Cloud Formation
In this part of the lesson, you'll use Cloud Formation to create an ArcGIS Enterprise site on Amazon EC2.
Clean Up Lesson 1 Resources
Before we proceed to create a new EC2 machine instance for Enterprise, I recommend that we terminate the instance and storage you created in Lesson 1. We won't use that machine or its storage subsequently, so we may as well remove it and not incur any more potential costs.
- In your AWS Console, browse to your Elastic IP and disassociate it from the Lesson 1 machine instance. (Do not delete your Elastic IP. You will reuse it throughout the course.)
- In your AWS Console, browse to your EC2 Instances and Terminate the one from Lesson 1.
- In your AWS Console, browse to your Elastic Block Storage Volumes, and delete the Volume that was created for your Lesson 1 machine instance. (Important Reminder: Don't delete a volume for a machine instance that you still plan to use. Regardless of whether the Instance is Running or Stopped, the storage Volume needs to exist. To delete a storage volume is akin to removing a physical hard drive from your desktop computer; it doesn't matter if your computer is on or off, if you throw out the drive the machine is useless.)
Create an S3 Bucket for Config Files
To simplify the Cloud Formation installation, we will upload a few config files to an S3 Bucket, from which the template can access them. You will refer to them later as you customize the template parameters.
- Log into AWS and click the Services menu.
- Select S3 under the Storage section.
- Click the Create Bucket button and proceed to create a bucket with the name, deploymentbucketNAME, replacing “NAME” with your own last name. For example, mine would be deploymentbucketbaxter. This bucket name can be anything, but must be unique.
- All other settings may be left at their default values.
- Upload the following three files from the Student Downloads page in the Course Resources module in Canvas to your S3 bucket:
- The ArcGIS Server license file (.prvc)
- The ArcGIS Portal license file (.json)
- The SSL Certificate file (.pfx)
- The CloudFormation template file (.json)
- Be sure that there are no spaces in the file names.
Launch Cloud Formation Template
- Log into your AWS Management Console.
- Browse to the CloudFormation section under Services menu (you may need to expand All Services).
- Click the Create Stack button and choose the New Resources option.
- Leave the Template is Ready option selected, and leave the Amazon S3 URL option selected.
- Return to your S3 Bucket and click on the CloudFormation template .json file you uploaded.
- On its overview page you should see an Object URL.
- Copy that URL and paste it into the Amazon S3 URL box back in the CloudFormation template.
- Click the Next button.
- Refer to the document, Geog865CloudFormationParameters, in the Course Resources module in Canvas for details on what to enter on the Specify Stack Details page of the stack creation. In this section, you will provide a name for your Instance, the Elastic IP you'll associate with it, what type of AWS machine you'd like it to run on, all the license files for Enterprise/Server/Portal, passwords for the Windows and ArcGIS user accounts that will be created, your fully-qualified domain name, and the SSL Certificate that will secure your site. You may leave all other settings at their defaults. When you've entered all the information, click Next.
- On the Configure Stack Options page, be sure that the Stack Failure Options section is set to "Preserve successfully provisioned resources." By setting this parameter, if the cloud formation process encounters an error when setting up the ArcGIS components your EC2 Instance will persist. This way you can use Remote Desktop to log into your machine and investigate what the problem was. Without changing this setting, the entire EC2 Instance would be deleted making it difficult to troubleshoot.
- On the next page, check the box acknowledging the IAM resources note, and click Create Stack.
- The process will take some time to complete, likely an hour or more, and it may not be obvious that anything is happening. You will see an indication of what is going on in the Status column, and if you check the box next to the Stack Name, you will see more details under the Events tab.
- DO NOT PROCEED until the Status column for your stack on the Cloud Formation page shows "CREATE_COMPLETE" in green text.
- See the Debugging Resources section below if you encounter errors.
- When the Stack indicates that it is complete, return to your AWS Console and browse to your EC2 Instances.
- Check to see that your new machine is successfully running, evidenced by a green “running” indicator and that it is no longer “initializing.” (Even if you see your new instance here, don’t proceed until the Cloud Formation stack is also complete.)
Your new machine instance is now set up and ready for you to log into and start working with ArcGIS Server.
Debugging Resources:
If you receive an error in the CloudFormation Event page, you may see information about which step in the process caused the issue; the error may appear in red text on the stack page. The Event logs in CloudFormation sometimes aren't too helpful however. This is because, often, the error occurs after CloudFormation has successfully created your EC2 Instance and while the ArcGIS software is being configured on the machine instance itself. Errors in the CloudFormation template don't report specifics about any errors encountered on the EC2 Instance, rather, the errors are logged in files saved on your EC2 instance. To view those logs, check to see If your EC2 Instance was created and still appears in your AWS Management Console. (If it is not there, repeat the CloudFormation process, being sure that the "preserve successfully provisioned resources" is set to True.) If it is there, proceed to create your Windows username and password and use Remote Desktop to log into it. On your EC2 virtual machine, open a File Explorer and use the View - Options - Change Folder and Search Options settings to be sure you can see protected operating system files, see file extensions, see hiddn folders, etc. The log folder that ArcGIS generates is hidden by default.
Browse to C:\cinc and open arcgis-enterprise-primary.log in a text editor. You'll see entries with their respective timestamps as they occured during the install. Scroll through the entries in chronological order until you encounter one with a Warning or Error indicator. That should indicate what the issue was. It is very common for us to enter the name of a license file, domain name, or anything else incorrectly in the CloudFormation template. The log file in C:\cinc usually provides information we can use to deduce where the error/typo occurred. If you are unable to interpret the error logs and find the culprit, feel free to send the log file to me and we will get to the bottom of it.
A tour of the ArcGIS Server site
Now that you have an ArcGIS Server site running, let's take a quick tour to give you a feel for what's there.
- Be sure you've given your machine Instance enough time to get booted up and get your site started.
- From your web browser, visit your Manager URL, which will look like, https://namegeog865####.e-education.psu.edu/server/manager/. (Substitute your own name and semester, of course.)
Note: Sometimes it takes a few minutes after you've started your site for Manager to become available. If you get a blank screen or an error, wait a few minutes and try again.
The nice thing about Manager is that you can run it from any computer that has an Internet connection. Later on, you'll learn how to make a remote desktop connection into your EC2 instance, but some administrative functions are exposed in Manager and don't require the hassle of remote desktop. - Log in to Manager using the site administrator credentials you designated in the Cloud Formation Template.
- Click the Services tab and Manage Services subtab, then examine the pre-generated services that ArcGIS configures for you.
There is a SampleWorldCities map service that you can preview by hovering over the thumbnail icon and clicking View. - Back in the list of services, you should see a Sharing Properties icon to the right of the SampleWorldCities service. Click the icon and check the box next to Everyone. This defines the service as public and available to everyone browsing your server, regardless of whether they are logged in. By default, services are set to only be visible to their author when signed in.
- From the left-hand list of service folders, click System. These services (Caching Controllers, Publishing Tools, etc.) are used internally by ArcGIS Server when publishing services, building tiled map services (which you'll learn about in Lesson 6), and so forth. You don't have to do anything directly with these services, and you should leave the ones running that are running and leave the ones stopped that are stopped.
- From the list of folders on the left, click Utilities. You can optionally start the PrintingTools service to include printing functionality in web applications that you build. This service takes all the layers in a web map and makes a single printable image, which is not always an easy task to program on your own when the layers are coming from different web services.
Another pre-generated service called Geometry helps with simple measurement and editing operations if you are programming web applications. The GeocodingTools service is used for finding addresses and is associated with Portal for ArcGIS, another part of ArcGIS Enterprise that we'll learn about in a future lesson. Finally, the Search service allows for creating a searchable index of your organization's geographic data. - Click the Site tab and the Server Configuration subtab.
Here you can view technical information about how your site is configured.
Notice the Directories and Configuration Store locations. These are key folders required by the ArcGIS Server site which you may have to prepare and configure if you ever set up ArcGIS Server on premises. Cloud Formation creates shared folders for these and grants the ArcGIS Server account permissions to them (Cloud Formation also created the ArcGIS Server account for you).
The Data Store menu item is also important. Here you need to add a list of folders and databases that you'll be using with your web services. - Click the Security tab.
If you have services that need to be restricted to certain subgroups of users, you can configure your list of users in this section of Manager. Some organizations import their existing list of Windows users to ArcGIS Server, although using Manager you can alternatively set up a list of users from scratch. Once you have a list of users, you place them in roles and then lock down your services to allow only certain roles. You can also grant roles privileges to administer ArcGIS Server or publish services.
The above procedures are beyond the scope of this course but can be explored in your final project if you would like. In the course exercises, you'll have just one user who can log into Manager, which is the primary site administrator that you designated in Cloud Formation. Anyone who has the URL to your site will be able to view your web services because by default there are no rules restricting access to your web services. - Click the Logs tab.
This is where ArcGIS Server writes messages about what it is doing. The logs can be an invaluable troubleshooting tool, and you should return to this screen whenever you run into a problem you can't diagnose. The server can write very detailed messages down to the coordinates and draw time of every single map and layer it creates for every user. However, for performance and for ease of traversing the log messages, the logs are configured to only write Errors and Warnings by default.
You should now have a good feel for what's running on your ArcGIS Server site and the settings available there. The next item of business is to log into the EC2 instance itself and move some data there. This will allow you to publish your own web services on the ArcGIS Server site.
Logging in to your instance
Now that your site has been created and started, you can get ready to log in to the instance and start working with your software. Some of these steps will be similar to what you did in Lesson 1, but please follow them closely.
- Log in to the AWS Management Console, navigate to the EC2 region where you built your site in Cloud Formation (probably N. Virginia), and click Security Groups.
When Cloud Formation created your EC2 instance, it also created a security group for that instance. You might remember from Lesson 1 that you need to add a rule to this security group allowing Remote Desktop connections through port 3389. - Click the name of the security group that Cloud Formation created. The name should be similar to what you called your Instance.
- In the lower panel, click the Inbound Rules tab and click the Edit button.
- If it's not already there, click Add Rule, and add a rule of type RDP.
- In the Source box, be sure it's set to 0.0.0.0/0 so that any computer can access it via Remote Desktop, and click Save Rules. It's best practice to only allow this type of access to only specific client IPs, like your local computer. But we're going to open it up to any IP for the purposes of this class.
- Follow the procedure you learned in the previous lesson to confirm that your Elastic IP is associated with your new EC2 Instance that was created by CloudFormation. If it's not, check the box next to your Elastic IP and click Actions > Associate address to associate it with the new Instance.
- In the AWS Management Console, click the Instances link on the left side. From the list of instances, right-click your instance name and click Get Windows Password.
- Browse to the key pair file (.pem) that you saved in Lesson 1 and decrypt the password, just like we did in the previous lesson.
- On your local computer, open Windows Remote Desktop Connection.
- In Remote Desktop Connection, click the Options button > Local Resources tab > More button and ensure that the box for Drives is checked, then click OK. This will permit you to copy data from your machine on to the remote machine (in this case, your Amazon EC2 instance).
- In Remote Desktop Connection, under the General tab, type or paste the elastic IP address of your instance into the Computer input box.
- In the User name input box, type Administrator, then click the Connect button.
- In the Password input box, carefully type or paste the password you decrypted, then proceed with logging in.
Notice that Amazon gives you a pretty strong password for this instance, but it's not one you're liable to remember easily. You should change the administrator password once you've logged in.
- On your instance (not your own computer), click Start (Windows button) > Administrative Tools > Computer Management and follow the same steps we did in the previous lesson to change the Administrator password. Go back and look at the steps if necessary. Do not skip this step, because you want to have a password you can remember and not the real complex one supplied by Amazon.
The password rules are fairly stringent; please see them in the image in Figure 2.1, below.
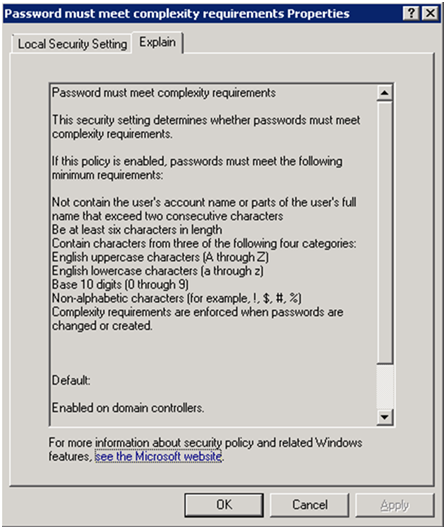 Figure 2.1: Password Security Setting
Install Google Chrome
The following paragraph talks about disabling IE enhanced security on your EC2 machine. An alternative to doing that is to simply install the Google Chrome browser on your EC2 machine and use it instead of Internet Explorer. You may use Internet Explore to browse to the Google site to download and install Chrome.
Disabling IE ESC
As a security precaution, it's usually not a good idea to go around browsing the web from your production server machine. To do so is to invite malware intrusions onto one of your most sensitive computers. The operating system on your instance, Windows Server 2012, enforces this by blocking Internet Explorer from accessing most sites. This is called IE Enhanced Security Configuration (ESC).
IE ESC gets burdensome when you're using the server solely for development or testing purposes like we are. To smooth out the workflows in this course, you'll disable IE ESC right now and leave it off for the duration of the course.
- Start Windows Server Manager by typing its name from the Windows Start Menu.
- Click Local Server.
- Scroll over to the right and find IE Enhanced Security Configuration. Click the On link to access the options for turning it off.
- Select Off for both users and administrators and click OK.
You're now ready to begin working with your EC2 instance.
Remember that if you are going away for more than an hour, you should stop your instance using in the AWS Management Console. (Only stop your machine Instance. Leave your storage volume(s) and Elastic IPs as they are. Deleting them may require that you completely rebuild your virtual machine.)
Exploring the instance
ArcGIS Server on Amazon EC2 comes preconfigured with some running services and data. These can help you understand how the server works and they're also a good way to verify that your server is running correctly. Let's take a few minutes to look at these items.
- On the desktop of your EC2 instance, open a web browser (Internet Explorer) and enter the url for your Services Directory. The url has the form, https://namegeog865####.e-education.psu.edu/server/rest/services (substituting your own name). Each ArcGIS Server has this simple page called a Services Directory that helps you explore what services are available on the server. Application developers (i.e., programmers) can also use the Services Directory to get certain information that is useful when writing code to use ArcGIS Server.
- In the Services Directory click SampleWorldCities, then in the View In row of links at the top, click ArcGIS JavaScript. This opens a web browser to a preview of the sample service on the instance. We already caught a glimpse of this service in Manager earlier.
- In your browser's address bar, examine the URL of the SampleWorldCities service. It should look like this: https://namegeog865####.e-education.psu.edu/server/rest/services/SampleWorldCities/MapServer?f=jsapi
- Copy the URL that you see in the web browser address bar and paste it in a web browser on your own computer (not your EC2 instance). You should see the same thing as you did from your EC2 instance (be sure you've already set the SampleWorldCities Sharing Properties to allow Everyone to view it, like we did in a few pages earlier). Your computer made a request to ArcGIS Server running on the EC2 instance, somewhere off in Amazon data center land. The instance then sent the image back to your home computer. You have successfully created a public GIS server!
All services are driven by GIS data. With ArcGIS Server, these are the geodatabases, shapefiles, map documents, and so on, that you are accustomed to working with in ArcMap and ArcCatalog. The sample services here are no different. Let's examine some of the data that drives these services. The data is preconfigured on your instance. - Maximize your remote desktop session again and open Windows Explorer on your instance (click the folder icon in the taskbar).
Notice that you have a C: drive of 100 GB. Cloud Formation sets up this drive when you create your instance. The C: drive is on the instance itself, meaning that your instance has a 100 GB hard drive.
You might remember that you specified the size of this particular drive when you were in the Cloud Formation template. The course instructions told you to leave the default at 100 GB, which is the minimum required by ArcGIS Enterprise.
EBS volumes have some great advantages. You can create and destroy them at any time, just like instances (but only if you're done with them and the machine they're running on). But you can also take "snapshots" of your volumes and store them on EC2. This allows you to create multiple "clones" of the hard drive that you might attach to different instances. The snapshots also give you a backup of your data in case your original EBS volume fails (yes, hardware does occasionally fail even in an Amazon data center).
Looking in Windows Explorer, you should also see that your own local hard drives are available. These are listed in a fashion like "C on MYMACHINE". This makes it easy to copy and paste data from your local machine onto your instance. - Minimize your remote desktop session. On your local computer, log in to the AWS Management Console and from the left-hand menu, click Volumes.
You should see the 100 GB volume associated with your instance. You are actually charged a storage fee for having these volumes, and you cannot stop the clock on this fee even if you stop your instance. However, the fee for these volumes is relatively small compared to the fee you incur for running your instance.
Installing ArcGIS Pro
- To facilitate some administrative tasks, we will install ArcGIS Pro software on our EC2 instances. You may also install Pro on your personal computer, but to be sure it works for class purposes, and because it doesn't run on Macs, we'll run it on our EC2 instances for now. Many of the tasks we can perform using the web-based Server Manager site can also be performed with ArcGIS Desktop or ArcGIS Pro, and as each environment evolves it may become more efficient or comfortable to use one versus the others.
- Using Remote Desktop, log in to your EC2 machine instance.
- Follow the steps on the Student Downloads page in the Course Resources module in Canvas to acquire and install ArcGIS Pro.
Now that you've seen what's preconfigured on your server, you'll learn a little more about how you can copy your own data onto the instance and start your own mapping web service.
Moving data to the cloud
One of the most challenging aspects of moving to a cloud deployment is transferring data from your local (on-premises) environment onto the cloud. In this section of the lesson, we'll look at special problems that arise in data transfer scenarios. We'll also discuss ways data can be moved to Amazon EC2, and you'll copy some GIS data to your own instance in preparation for publishing a web service.
Challenges of data transfer
For your data to go from your machine to commercial cloud services such as Amazon EC2 or Amazon S3, it must go "across the wire", meaning it is transferred through the Internet onto the cloud-based server. This can pose the following issues:
- Your datasets may be so large that they are not feasible to transfer across the Internet in a reasonable amount of time.
- A slow Internet connection or low bandwidth makes it impossible to transfer your data in a reasonable amount of time.
- Your data may be sensitive enough that transferring it across the Internet would require extra security measures or is not an option altogether.
Let's examine these problems one at a time.
Large datasets
GIS data collections can be very large: up to terabytes in size. This is often the case when imagery is involved, but even vector datasets with a broad amount of coverage or detail can prove unwieldy for an Internet transfer.
When moving large datasets to the cloud, you have to plan for enough time to move the dataset and, if possible, increase your bandwidth. After doing a test transfer of a few hours or days, you should be able to get an idea of the rate of data transfer, and you can thereby extrapolate how long it would take to transfer the entire dataset.
If this amount of time is unreasonable (say, months) you may consider shipping the data directly to the cloud provider on a piece of hard media. The cloud provider can then load the data directly onto the cloud much faster than you could send it over the Internet. Amazon provides such a service called AWS Snowball [23]. You load up your data on a ruggedized secure device called a "Snowball" and ship it to Amazon. In the old days of computing this technique was called "sneakernet", since you could sometimes put your data on a floppy disk and walk it across the office to another computer faster than you could send it electronically.
Internet connection limitations
Cloud-based data centers like Amazon's are built to handle high levels of data traffic coming in and out. However, your connection going out to the cloud may be limited by a slow connection or lack of available bandwidth. Some IT departments and internet service providers (ISPs) throttle or cap the amount of data that can be transferred from any one machine or node in the network. These types of policies are sometimes put in place to prevent the use of streaming sites such as BitTorrent that violate company policy or simply monopolize the organization's available bandwidth. However, sometimes these policies can negatively affect legitimate business needs such as transferring data to the cloud. If you find yourself in a situation with low bandwidth, it might be helpful to visit with your IT department to understand if your machines are being throttled and could be granted an exception. If an exception is not possible due to other bandwidth needs within the company you might explore whether your data transfer could occur during off-hours such as nights or weekends.
Sensitive data
Confidential or proprietary datasets, such as health records, may require extra security measures for transfer to the cloud. When dealing with sensitive data, the first question to answer is whether it is legal or feasible for the data to be hosted in the cloud in the first place. For example, some government organizations responsible for national security may possess classified or secret data that could never be uploaded to Amazon's data centers no matter the measures taken to ensure secure data transfer. Also, some organizations may not have the desire or permission to host datasets on servers that are physically located in a different country.
Other types of datasets may be okay to host on the cloud but must be encrypted during transfer, to prevent a malicious party from using any data that may be stolen en route to the cloud server. Secure socket layer (SSL) connections (HTTPS) and secure FTP are two techniques for encrypting data for Internet transfer.
Techniques for data transfer
Sometimes the ability for one computer to directly "see" or communicate with another computer is hindered by firewalls or network architectures. For example, your computer at work is probably allowed to only access the file systems of other computers on your internal network. You could potentially open up a folder on your Amazon EC2 instance for access by anyone but this opens a security risk that malicious parties could find the folder and copy items into it.
There are a number of strategies that people use to get around these limitations when transferring data into Amazon EC2 and other cloud environments, these include:
- Copy and paste through Windows Remote Desktop. This is the technique we'll use in this course because it's convenient. However, it may not be appropriate for highly sensitive data.
- Use of a "digital locker" type of site like Dropbox.com, where you are allowed to upload a certain amount of data onto the site (for example, 2 GB). You can then log into your instance and download the data onto whatever drive you choose. You could even use your allotted Penn State PASS storage for this technique. Upload the data to your PASS space using your local computer, then log in to your instance and download the data from your PASS space.
- A secure FTP (file transfer protocol) connection configured by your IT department. FTP is an Internet protocol designed for transfer of files, but if the data is sensitive, you should encrypt it before you send it this way.
The ArcGIS Server on Amazon EC2 help has an overview of data transfer techniques. Please take some time right now to read Strategies for data transfer to Amazon Web Services [24].
Copying the Appalachian Trail data to your EC2 instance
In this part of the lesson, you'll copy some data to your EC2 instance in preparation for publishing a web service. Before you attempt these steps, you should be logged in to your EC2 instance through Windows Remote Desktop Connection. If you followed the steps earlier in the lesson for connecting via Remote Desktop then your local disk drives should be available to the instance.
- Download and unzip the Appalachian Trail data [25] to a location on your local computer (not your EC2 instance).
This is National Park Service data obtained from the Pennsylvania Spatial Data Access (PASDA) website. In this exercise, we'll pretend this is a dataset that you've been using for years at work that you now want to transfer to the cloud. - Open Remote Desktop Connection to your EC2 instance and then open Windows Explorer.
You should see something like the following, where you have a set of drives listed for your instance and a set of drives listed for your local computer. The drives on the local computer will be followed by the computer name. For example, in image 2.2, below, the local computer is named EED-RSLT053, and the C drive is available from it. There is also one drive available on the EC2 instance, which is also C.
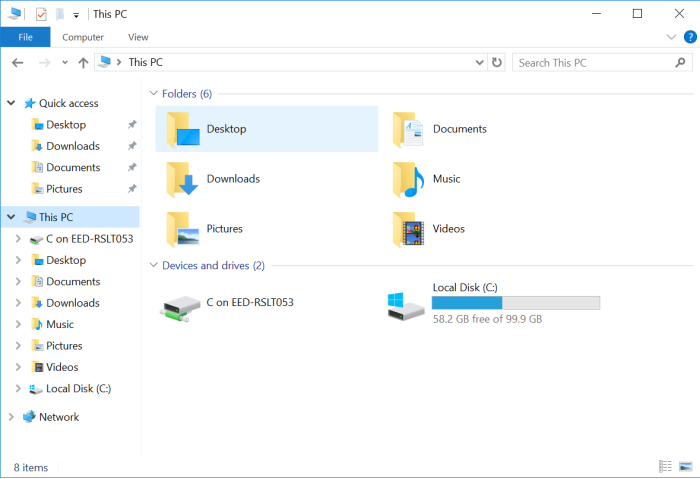 Figure 2.2: Available drives
 - Browse to the folder on your local computer where you downloaded the Appalachian Trail data, right-click the folder, and click Copy.
- Browse to the C: drive on your instance, and create a new folder called, data.
- Navigate into the C:\data folder, right-click, and click Paste. This should put your data at C:\data\AppalachianTrail.
- Open and explore the AppalachianTrail folder. It contains a map document displaying the Appalachian Trail and shelters along the trail. The trail and shelter datasets are feature classes in an Esri file geodatabase. You will publish this map as a web service in the next part of the lesson.
Registering your data with ArcGIS Server
For simplicity in this course, you'll follow the workflow of transferring all data to your EC2 instance, working with ArcGIS Desktop on your EC2 instance, and publishing to ArcGIS Server on your EC2 instance. Theoretically, you could do most of the desktop work on your own computer and then publish up to the server when you were ready. However, any time you introduce separate computers into the architecture, especially on different networks (in the case of your home computer and your EC2 instance), things can get more complicated. Because you have a limited time available to learn about ArcGIS Server, I want you to spend the time experimenting with the capabilities of the server, not worrying about network issues or which machine contains the data.
However, in large organizations, these challenges of distributed architectures are inevitable. Some GIS shops might have a GIS server administrator who controls access to ArcGIS Server, and a number of cartographers and desktop GIS users who just prepare the maps for publishing. This latter group of "publishers" work on machines that are separate from the server and may even reside on a different subnet than the server. In some cases, the publisher machines and the server machines use different copies of the data that are kept in sync by an automated process, and the paths to the data used by the publishers may be different than the paths used by the publishers.
To help manage these scenarios, ArcGIS has the ability to "register" a data location, meaning that you provide ArcGIS Server with a list of data locations you typically use. If the publishers use a different path to the data than the server uses, you can provide both the paths. Then, when you publish a service, the map is copied to the server and all the paths in the map are switched to use the server's path instead of the publisher's path.
This can be a difficult concept to conceptualize with just a verbal explanation, so please take a few minutes to read the help topic registering data on ArcGIS Server [26]. This has some diagrams of different situations where data registration can be particularly useful. It is one of the most important help topics for ArcGIS Server.
Please note that if you try to publish a service and ArcGIS Server does not find any of the data paths in your map in its list of registered folders and databases, the data will be packaged up and copied to the server [17]at the time you publish. The copying ensures that no data paths will be broken in the published service. This automatic data copying is an interesting feature in some scenarios where the publishers do not have the rights to log in to the server machine, but it is not an appropriate workflow for managing large amounts of data. The best approach is to make sure you set up workable data locations on the publisher's machine and the server machines, and then carefully register those locations with ArcGIS Server. In some cases, like ours, the publisher's machine and the server machine will be viewing the same path to the data.
Follow the steps below to register your C:\data folder with ArcGIS Server:
- On your EC2 instance, open a web browser and connect to your ArcGIS Server Manager, as you did earlier.
- Click the Site tab, and open the GIS Server section.
- Click on the Data Store link along the left to see a list of the registered data locations.
- You'll see a button to the right where you can Register. Change the dropdown list to Folder, since we will be registering a folder on your server.
- In the Register Folder dialog, enter a name for your folder such as, "C Drive Data."
- Enter C:\data in the Publisher Folder Path box.
- Type your machine's name in the Publisher Folder Hostname box; it will look something like EC2AMAZ-NMPERYP. You can find your machine's name by opening the Server Manager from the Windows Start Menu and looking for the Computer Name under Local Server.
- Check the box to set the Server Folder Path to be the same as your Publisher Folder Path.
- You should now see your C Drive appear in the list of registered locations, and you can confirm that it's valid by clicking the Validate button and seeing a green check mark.
Now you're ready to publish a map web service using your Appalachian Trail dataset that you placed in C:\data. You'll do this in the next section of the lesson.
Publishing a service
In the previous part of this lesson, you copied a map document to your EC2 instance. However that map is still only available inside ArcMap on your instance. Now you'll take the step of publishing the map as a web service so that it can be used by anyone.
Whenever you publish a service, you begin the process in ArcMap, having opened the map document that you would like to publish. You run an analysis process on the map to find anything that might prevent it from being drawn by ArcGIS Server's drawing engine. You then set service properties and publish the service.
Opening and analyzing the map
- Log in to your instance using Windows Remote Desktop Connection.
- Start ArcGIS Pro and create a new Project.
- We're going to import an existing map that was saved as an .mxd file earlier. Click the Insert tab and click the Import Map icon.

- You should see the Appalachian Trial layers appear in the Contents pane in Pro. These layers reference the data you uploaded to the C:\data folder.
- Scale ranges have been set on the layers to symbolize them differently as the user zooms in and out. Group layers are used to organize the layers for each scale range.
- The layers have been given intuitive names. This ArcMap table of contents won't be available to the user of the web service. However, apps that use the service will sometimes construct a legend or table of contents given information that the app can read for the service. Since the app is going to read the layer names, it's important to name them intuitively. For example, "Trail" is a more user-friendly layer name than the default "Centerline". Also, the default data frame name of "Layers" has been changed to "Appalachian Trail Shelters".
- The bright colors and shadowed labels of this map have been chosen with the anticipation that the map will overlay satellite and aerial imagery. The imagery itself has not been included in the map because it will be obtained through a different web service. When designing web services, it's a good practice to separate base map layers such as imagery into their own services. The trail data we are working with consists of business layers, or operational layers. These types of layers are usually the main datasets of interest in the web map, and they are often separated into their own services and symbolized with the anticipation that they will overlay the base map service.
- Save your ArcGIS Pro project using the Project tab.
- We are now going to make a connection to the ArcGIS Server instance running on your EC2 machine. Open the Insert tab, click Connections, expand Server, and choose the New ArcGIS Server option.
- Enter the URL to your Server instance. It will look something like, https://baxtergeog865su23.e-education.psu.edu/server [27]. (You may need to click the Enter key on your keyboard to get the window to recognize that you've entered something. This step is sometimes a bit quirky.)
- In the Sign In window that appears, enter the login for your EC2 ArcGIS installation. This is the Site Admin username and password that you supplied in the Cloud Formation template.
- In the Catalog pane in ArcGIS Pro, you should now see a Server folder and your instance inside it.
At this point, your ArcGIS Pro session is connected to two different ArcGIS Server (Portal) sites: the Penn State organization (pennstate.maps.arcgis.com) that you initially used to sign in, and your personal ArcGIS Server (e.g., https://baxtergeog865su23.e-education.psu.edu/server [27]). Before we publish our data to the server, we need to inform ArcGIS Pro which of these two servers to use.
- At the upper-right of the ArcGIS Pro window, click where you see your name and "Penn State University." Click the option to Switch Active Portal, and choose your Server on EC2.
Now we can publish our data to the Server.
- Click the Share tab, choose Web Layer, and click Publish Web Layer.
- In the Share As Web Layer pane, enter a name, summary, and tag for your data.
- Since you already copied data and registered the C:\data folder with Server in an earlier step, there is no need to copy the data to server at this point; it’s already there and is in a folder that Server has access to. Accordingly, click the radio button for Map Image under Reference Registered Data. Had we not already registered the C:\data folder with Server, we would need to choose one of the options to copy the data to our server at this point.
- In the Portal Folder dropdown, choose the root option.
- You can put your ArcGIS Server services in "folders" if you want to group them together for security or logistical purposes. These don't translate to physical folders on disk, they are just an organizational mechanism. For example, you might remember seeing the PrintingTools and Geometry services in the Utilities folder back when you were touring Manager. In the lesson exercises, we won't bother with folders because you won't have that many services to keep track of.
- Check the box to Share the data with Everyone.
- Click the Analyze button, and then examine the Messages window that appears.
- (You may see an error asking you to “allow assignment of unique numeric IDs for sharing web layers.” If so, you can click the link to open your Map Properties and check the box to Allow.)
- The Messages window displays a report of anything that might prevent the service from being created. The ArcGIS Server drawing engine is optimized for speed on the web and does not support some of the less-common layers and symbols that you can view in ArcGIS Pro. If your map contains something that's not supported, you will see an Error in the report and you must remove the layer from your map before you can publish.
The report also lists Warning and Info messages about things that might slow down or otherwise hinder your service once its published. On the web, speed is king. It's usually worth your time to fix as many of the warnings as you can before publishing your service.
If you don't understand a particular message, you can right-click it and click Help to see documentation about that specific message.
The most important warning you see in your Trail map is that the data is stored in a different coordinate system than the data frame. This means the data frame is projecting the layers "on the fly" every time the map draws. Since this projection is computationally intensive, it's best if your server does not have to perform it on every map draw, especially if hundreds of people will be hitting the service at the same time. Let's change the data frame projection to match the source data and re-analyze.
- Without closing the error window, return to the Contents pane, right-click the map name at the top (Appalachian Trail Shelters), and click Properties.
- Click the Coordinate System tab, then browse to Projected Coordinate Systems > World > WGS 1984 Web Mercator (Auxiliary Sphere), and click OK.
Your data frame projection now matches the projection of your data. The Web Mercator (Auxiliary Sphere) projection is a common one used by online mapping services such as ArcGIS Online, Bing Maps, and Google Maps.
- In the Share As Web Layer pane, click Analyze again, and notice that the warning about the coordinate system has gone away.
- In the Share As Web Layer pane, click the Configuration hearding and examine the available options.
ArcGIS Server capabilities define the ways that users can access your service. All web services have strictly defined ways that they are allowed to communicate with clients. They also expose a set of methods or operations, which are things they can do (like draw a map). By adding more capabilities here, you thereby expand the ways that clients can use your service. The WMS capability, for example, allows clients to communicate with your service through the Open Geospatial Consortium (OGC) Web Map Service (WMS) specification, an open specification for how GIS map web services should communicate.
Since you're publishing a simple service for test purposes, leave the default capabilities. In Lesson 3, you'll get a chance to work with the Feature option.
- In the Share As Web Layer pane, click Analyze again. You should see no warnings now that you've corrected the coordinate system mismatch.
- Click the Publish button to finish publishing the data to the Server.
This creates a web service for your map. In a few seconds, you should be able to see the service listed in the web Manager or the Catalog pane in ArcGIS Pro.
When you publish a service, a copy of your map is placed in a special folder on your server (arcgissystem). If you ever update the layers or symbology in your map, you must overwrite your service so that a new copy of the map can be placed there. You overwrite a service using the same wizard that you use for publishing. In the first panel, you choose Overwrite an existing service instead of Publish a service. - Open the Services Directory and verify that you see your new trail service. The URL to your Services Directory, which you can use from any machine, is https://namegeog865####.e-education.psu.edu/server/rest/services (substituting your own name). If you don't see your service, it's ok.
- If you don't see your Trail service on the Services Directory page, it's likely because it is not set to be visible to the Public. One way to see your service is to click the login link at the upper-right of the Services Directory page and sign in with the ArcGIS credentials you established with Cloud Formation.
- To be sure that all clients are able to view your Trails service, return to the Server Manager page (https://namegeog865####.e-education.psu.edu/server/manager), view the list of services, click the Sharing icon and select Everyone.
Ways of working with web services
When you publish a service, you are giving the server a set of things that it can do with a particular map. In order for this to be useful to anyone, the client application and the server need to be able to communicate with each other in a way that both understand. There are several ways that an ArcGIS Server map service can allow itself to communicate with client applications.
REST
Representational State Transfer (REST) allows a client to discover information about a service or invoke operations on a service using a known structure of URLs. REST is not really a communication protocol, but rather an architecture; a way of building a web service so that it has a hierarchy of resources and operations that can be accessed by formulating the correct URL.
The actual bits of information sent "across the wire" can vary in format, but JavaScript object notation (JSON) is often used. JSON is desirable because of its well-known structured format and the fact that it can compact information into a minimal amount of characters.
Here's an example of some JSON that describes a Pennsylvania municipalities map service [28]. Take a few moments to examine all the properties exposed in this JSON. This is actually an easy-to-read format of JSON with extra line breaks and spaces called "pretty JSON." Removing the spaces to get pure JSON makes it more difficult [29] for you to read, but reduces the information that the computer has to read and can, therefore, make your web service more efficient.
REST is stateless, meaning that any one request cannot depend on information sent in a previous or future request. All requests are independent of each other. This requirement can make for some interesting architectural considerations. For example, to support an interactive web editing session with REST, you must send an entire digitized feature to the database at once; you cannot send the feature vertex by vertex as it is digitized.
Because of REST's simplicity and efficiency, the Esri web mapping APIs for JavaScript, Flex, and Silverlight communicate with ArcGIS Server web services using REST.
Viewing your service in a web map
Each GIS web service has its own specific purpose. It may support analysis performed inside an organization, or it may be intended to be used by anyone on the web. In this lesson, we'll assume that the Appalachian Trail service you just published is intended to be used by anyone on the web to explore and use in their own maps.
So, how could someone use your trails service in their own web map? A programmer could put the URL of your service directly into web app code and then write appropriate code to display the map. That's a topic for a different course, and ultimately writing code is something that many people cannot or will not do. In this part of the lesson, you'll use the ArcGIS Online map viewer, an interactive web map designing tool, to see how you can put together several services into a web map.
You might say that the ArcGIS Online map viewer is "running on the cloud". It is software as a service (SaaS), meaning you don't have to install any software in order to use it. When you save maps on ArcGIS Online, they are not saved to your computer, rather they are saved on an Esri server. You can come back and work with your maps from any computer as long as you tell the application who you are by logging in.
To perform this exercise, your Amazon EC2 instance must be running, but you can do the steps on your local computer.
- Open a web browser to the ArcGIS Online homepage [30].
You can use the ArcGIS.com map viewer without signing in; however, you will sign in so that you can save and re-use your maps. - Click the Sign In link, and choose the Your ArcGIS organization's URL option. We will login using Penn State's ArcGIS Online Organization, in which all Penn State students automatically have accounts. Enter "pennstate" to connect to the Penn State organization at pennstate.maps.arcgis.com, and sign in with your regular Penn State Access ID.
- Click the Map link near the top of the screen. This takes you to the map viewer.
You learned in an earlier part of the lesson that a web map typically consists of a basemap and operational layers. The map viewer gives you a basemap already. - Change the basemap service by clicking the Basemap icon and choosing Imagery.
You can experiment with some of the other basemaps if desired. The trails service is symbolized with an imagery basemap in mind.
Now you'll add the operational layer, which is your trails service. Notice that although the trails service has several layers inside (Shelters and Trail), it's common to refer to the entire service as one layer in the context of the web map. - Click the Layers icon and choose Add > Add Layer from Url.
- Change the drop-down to ArcGIS Server Web Service and type the full URL of the service on your server in the URL box and hit Add to map. The URL takes the format
https://namegeog865.e-education.psu.edu/server/rest/services/<your service name>/MapServer.
To get the full URL of your service, you can open a separate browser window and enter the following,https://namegeog865.e-education.psu.edu/server/rest/services. You should see a hyperlink on the rest services page for your map service. Click it, and note the URL in the browser. This is what you can copy and paste into the ArcGIS Online map above. - Find your trail service and add it to the map.
Go ahead and explore your web map, perhaps zooming in to some shelters at a large scale (where you can see the shelter labels). You can also experiment with the buttons at the top of the table of contents, such as Legend. - Position your map on a place of interest to you, and save your map using the icon in the menu along the left.
- Enter a title, tags, and summary for your map, and click Save Map. Tags are just key terms that can aid others who may be searching or browsing for maps.
If you want to see or return to any maps you have saved, you can click Content > My Content. This screen also gives you the option to share your map with the public. Sharing your map at this time is not recommended because your server is stopped most of the time, so this map will not be of much use to the browsing public.
So, what good is this map that you've made? As mentioned above, if you have a permanently running server with a permanent address, you might choose to save your map and share it with the public. People could then search for and view the map in ArcGIS.com. Another way the map can be used is by web app developers. Each map saved on ArcGIS.com is assigned an ID. Esri has designed their web programming frameworks (APIs) for JavaScript, Flex, and Silverlight such that a developer can just reference a map ID in the code, rather than building the map "from scratch".
Assignment: Sharing your web map
For this week's assignment, create a new document and insert the following:
- A screen capture of your web map. Please ensure that your screen capture is unique (not identical to anyone else's). A compressed image format, like JPEG or PNG is recommended.
- A short summary of how things went for you. Did you run into any issues getting it to work? Did you discover anything interesting you could do that was not covered in the lesson?
- In this lesson, we brought together several web services layers in the style of a "mashup". I'd like you to think a bit about some useful applications of this technique. In a thoughtful paragraph, give an example of two or more map layers you can think of that might be useful to overlay from different web sources. Explain how the GIS server technology you just used might help facilitate this process. If you're having trouble thinking of some, search around for maps on the web and see what people are doing.
When you are finished working on this lesson, remember to stop your Instance in the AWS Management Console.
Cloud Computing Discussion: Cloud GIS for Each of Us
How cloud computing services are defined and used is a key part of understanding cloud computing and foundational knowledge in this course. However, cloud computing definitions vary from source to source. For this week's discussion assignment, I'd like you to look back at the NIST definition of cloud computing [31] we are using in this course, and also read Chapter 2 of The Cloud at Your Service (available here as a preview from the publisher [13]). Then, compare Rosenberg and Mateos' definition of cloud computing with the NIST-based definition.
Deliverables for this week's emerging theme:
- First, submit a post in this lesson's discussion on Canvas that compares Rosenberg and Mateos' definition of cloud computing with the NIST-based definition and indicate which you prefer. If someone else has already posted what you would have said, either respond with a new point of your own, or make some other observation about cloud service definitions.
- Second, include in your post (or perhaps better, make a second post) that describes how you are currently using cloud computing, at work and at home, and how you plan to use cloud computing in the future. What tasks do you think would be uniquely suited to cloud computing?
- Third, I'd like you to offer additional insight, critique, a counter-example, or something else constructive in response to one of your colleagues' posts.
- Brownie points for linking to other technology demos, pictures, blog posts, etc., that you've found to enrich your posts so that we may all benefit.
Lesson 3: Cloud-based databases and web editing with ArcGIS Server
Overview
Web services have the potential to expose your data to a much wider audience than may have previously seen it. But beyond allowing simple visualization of the data, web services can also permit editing and creation of data over the web. This type of "web editing" can allow field workers and people who typically don't use GIS to contribute valuable information to your database, information that you might not otherwise get.
For all its benefits, exposing a database on the web comes with some challenges. How do you protect your data from becoming corrupted? If you put a database on the cloud, how do you keep it in sync with the database in your office? And what happens if multiple users edit a feature at the same time?
This lesson explores some of the requirements and challenges related to making a GIS database available for editing on the web. You'll put some data in a SQL Server Express database on your EC2 instance, and you will use that data to design a map for web editing. You'll learn about how ArcGIS Server provides a special type of "feature service" that is engineered to allow editing through a web service. Finally, you'll make a web application that allows others to edit your data over the Internet.
Throughout this lesson, you'll be guided with step by step instructions. At the end of the lesson, you'll post a screenshot of your work. Pay close attention to what you are doing, because next week you will be assigned a project in which you will have to think through these processes on your own.
Lesson Objectives
At the successful completion of this lesson you should be able to:
- create a feature service;
- create an application for editing your feature service using Web App Builder;
- understand GIS databases and web editing;
- understand how to set up your ArcGIS Server for web and feature services; and
- understand how to design a web map to support editing.
Deliverables
- Complete: L03: Assignment
- Participate: L03: Discussion
Web editing: opportunities and challenges
The ability to expose a GIS dataset to Internet users and allow them to modify it presents some enormous opportunities and challenges. A GIS professional needs to carefully understand and weigh these considerations before making decisions about how to make data available for web editing.
Opportunities
Web apps for editing GIS vector geometries were cumbersome and somewhat rare until about 2005. Attributes could be sent to a database through a web service fairly easily, but sketching geographic features on a screen posed some different problems. How could vertices be drawn in the web browser in real time as the user sketched them, without the entire page refreshing? Or how could a user view a snapping threshold on the screen while making a sketch? These problems were somewhat alleviated when AJAX came on the scene.
The bane of web developers up to this point had been the necessity of doing a full send and retrieval of information to the server in order to accomplish anything, with the ubiquitous "page blink" occurring in between. AJAX was not a particular product or feature, but rather a technique that web developers devised to work with existing technologies, with the goal of making their apps more interactive.
JavaScript is a language web developers use to program actions on web pages (in contrast to HTML, which is markup language used to lay out the static elements on the page). AJAX stands for Asynchronous JavaScript and XML. Web developers discovered that they could use JavaScript to send and retrieve XML packets of information from the server to create certain effects in their applications, without doing a full refresh of the page or requiring any type of browser plug-in. This revolutionized the interactivity of web applications.
Perhaps you remember the first time you saw Google Maps. This was actually one of the first programs, mapping-related or otherwise, to really give people an idea of the power of AJAX. Google Maps used AJAX requests to request pregenerated map images as the user panned and zoomed, creating a smoother web map navigation experience than most people had ever seen. Virtually all major commercial web mapping sites now use this approach.
AJAX techniques helped open the door for interactive editing of GIS geometries through web applications. Users could now sketch edits on their maps and see each vertex of the sketch drawn in real time without being interrupted by page blinks or waiting for the browser to respond. They could press a key and immediately see a snapping threshold that would be applied to a vertex. People began to think about the ways web browser-based editing could improve their GIS. In more recent years, people have also began to consider benefits of smartphone and tablet-based editing.
Tailoring GIS to other professionals
There are often many individuals within an organization who lack extensive GIS training, but could still contribute valuable information to the GIS. These include receptionists, field technicians, planners, and managers. Web editing comes with several advantages for these types of professionals.
First, virtually everyone has used a web browser, so an intuitively designed web application can be much less intimidating for them than a full-featured desktop GIS program like ArcMap.
Another advantage is that the web app can be specifically tailored to certain editing tasks that are within the audience's realm of expertise - no more, no less. If you need field technicians to sketch the locations of telephone poles, you can design a web app that allows sketching of telephone poles and nothing else. You can make the symbols big and round and even tappable on a smartphone by someone wearing large gloves. You can make the app as simple as needed, remembering that a simple app can still collect very valuable information.
Opening the door to crowdsourced GIS and volunteered geographic information (VGI)
Because everyone knows how to use a web browser, web editing gives you the potential to allow everyone to contribute to your GIS. When might this be a good thing? When everyone knows something that you don't! Or when the power of everyone can create something more complete, useful, or accurate than you can create on your own.
Enter two buzz terms that have crept into the GIS world in recent years with the advent of web editing, crowdsourcing, and volunteered geographic information (VGI). Crowdsourcing is the idea of allowing anyone to edit an information repository, with the faith that this will make the repository more complete and accurate over time. Wikipedia is an example of a crowdsourced online encyclopedia. In the GIS realm, OpenStreetMap is an example of a crowdsourced street map of the world. People hold mapping parties for OpenStreetMap where they ride and walk around a town collecting data and then enter it all into a database. Regardless of your feelings on using crowdsourced data, this type of activity undoubtedly increases the quantity and accuracy of the data already in the database (especially if the database previously contained nothing).
Similarly, VGI allows individuals to enhance a dataset with information that they alone may possess. Whereas the term crowdsourcing evokes images of mass participation in the creation of publicly-available dataset, VGI is more versatile in that it can contribute to private or temporary datasets. For example, a city might set up a VGI application to allow citizens to report broken streetlights, graffiti, overgrown trees, and so on. This information may remain proprietary to the city and it may go away over time, unlike a crowdsourced database that is expected to remain more or less available.
Editing on tablets and smartphones
You've learned that the beauty of web services is that they communicate by common architectures and protocols like REST and SOAP, that can be invoked by any device with a connection to the Internet. These devices include the numerous tablets and smartphones that have hit the market in recent years. The ArcGIS Server feature service that you will create in this lesson could potentially be used in editing apps for the iOS, Android devices, or Windows Phone.
Smartphone and tablet-based editing greatly facilitates the field work and crowdsourcing scenarios that you learned about above. It's a lot easier to record something you see on a street, such as a pothole, if you can send it to the database right away from your mobile device. The editing app may even allow you to attach a picture to your feature that you captured just seconds before with your phone!
Challenges
Along with the benefits of web editing comes a number of challenges. These need to be well-understood and dealt with appropriately by anyone planning a web editing implementation.
Security
When thinking about web security, it helps to consider all the different tiers, or levels, at which someone can access your system. Then consider how each tier might be vulnerable and how it might be secured. With web editing security, you need to at least consider the application tier, the web service tier, and the data tier.
If this sounds confusing to you, let's talk through them one at a time. First, consider the application tier. You need to decide which people will have access to your web editing application. Is it open to everyone on the Internet? This is the easiest to set up, but it also results in the most vulnerability. Your organization's existing firewalls might also make it fairly easy to set up an application that's only visible to members of your internal network, in other words, people who work for your organization. A trickier kind of application security to set up is one that has a login page where only certain members of your organization are allowed to log in, but not others. Setting up this type of security is certainly doable, but is beyond the scope of this course.
The next level of security to think about is the web service tier. An organization can set up its server such that certain services require a login to access. If the application itself also requires a login, the application developer must figure out how to get that name and password to be applied to the services accessed therein.
Regardless of whether you decide to require a login for your services, you should consider which layers should have editing allowed. There are some datasets that you'll want to expose for web editing, and others that you will not. You need to design your web services such that they only allow editing of those particular datasets that you want to have modified. Several days before writing this lesson, I came across a web map showing election results in a certain country. The authors of this map had used a feature service with popup balloons to display the election results. This was not a bad plan; however, the web service authors had inadvertently left the editing capability exposed on the feature service. I discovered that I could potentially click a popup balloon and literally rewrite the election statistics for any particular province!
Your software will give you controls over which features may be edited, and you must carefully understand and use these controls. Sometimes you may be required to group editable layers in one web service and non-editable layers in a separate web service that has different security settings.
The final tier of security to consider is the data tier. By exposing your dataset for web editing, you are opening your database to many more people than would otherwise have access to it. You need to plan for the scenario where a malicious party could corrupt or delete your data. Keeping a backup or replica of your data is recommended in web editing scenarios.
Data integrity
In addition to the threat of a malicious party corrupting your data, it's possible that a well-intentioned user could make a mistake and negatively affect your database. Before you take all the changes submitted by your web editors and push them into your on-premises database, you might choose to have a GIS analyst examine the edits and perform a quality check. This type of scenario is possible if you maintain separate replicas or copies of the database for web editing and for on-premises work.
You can reduce the possibility of data corruption by carefully limiting the types of features and attributes that web editors can access and create. Later in this lesson, you'll use feature templates that ArcGIS provides for editing. The feature templates help you give the web editor a palette of approved features that can be created, while making it impossible or difficult to create other types of features. For example, if you want your web editors to add only 8", 12", or 16" pipes to the database (no 20" pipes, or fire hydrants), you can create a feature template with only those three types of pipes, with the size attribute preset for each one.
Database maintenance
You've learned in this section that keeping a copy of your data for web editing and a separate copy for your on-premises work can be a good practice for maintaining security and data integrity. The tricky part is synchronizing the two copies at the appropriate times, with only the appropriate changes. ArcGIS contains a feature called geodatabase replication that can help with this.
The simplest option for replication is to make a one-way replica of the geodatabase, which is essentially a one-off copy made in a desired projection and format. This is useful for exposing a read-only database for web use. Some sites use one-way replication into the mercator projection for their web database, since they need to use mercator on the web but not in their office.
A more complex, but more useful action is to make a two-way replica of your database. This creates a copy of the database for web editing that can be synchronized with the original (or "production") database at intervals that you choose. A GIS analyst can potentially examine the web edits before synchronizing them with the production database. If the two databases are separated by firewalls or reside on different networks, an ArcGIS Server geodata service can be used to synchronize the two. This is beyond the scope of the course, but it's important for you to have a basic knowledge of these architectures in case you ever need to implement them.
If replication is a new concept to you, or you would like to learn more about it, you can read the first several topics in the ArcGIS help section Managing distributed data [32].
GIS databases and web editing
GIS vector datasets come in many formats. Some of these are better suited to web editing than others. Since we are working with ArcGIS Server in this exercise, we'll talk about some of the data formats that Esri offers and which ones are required for web editing. You'll then load some GIS data into a database on your EC2 instance.
Whether you're working with Esri software or not, one of the most ubiquitous formats for exchanging GIS datasets is the shapefile. This is a data format developed and openly documented by Esri, meaning that other software companies are allowed to use, create, and share shapefiles. A shapefile actually consists of multiple files with the same root name and different suffixes (.shp, .dbf, .prj, etc.) that store the data's geometry, attributes, projection information, and so on. You'll often see shapefiles available on GIS data warehouse sites that allow you to browse and download geographic datasets.
A shapefile is handy for exchanging data, but it's not very useful for web editing. Because the shapefile is an openly documented file format, it may be possible for a web developer to write an application that edits shapefiles. However, this would be a significant amount of work and ArcGIS does not supply out-of-the-box web editing functionality for shapefiles. Nor does ArcGIS support web editing with the shapefile's more advanced (but less openly documented) cousin, the file geodatabase.
In order to perform web editing with ArcGIS Server, your data must be stored in the ArcGIS Data Store or in a geodatabase hosted in a relational database management system (RDBMS). Here's what those terms mean:
- The ArcGIS Data Store is a built-in data repository that comes with ArcGIS Enterprise. You can read more about it on the ESRI website [33]. It's intended to support data hosting needs for installations that don't have a fully-functional relational database management system and geodatabases. For production data within an organization, a geodatabase is recommended because it possesses many data management capabilities. However, for use cases in which data simply needs to be uploaded or visualized in a less-critical manner (via apps, for example), the Data Store offers a simple way to create "hosted" services and store data in your server environment.
- An RDBMS is a heavy-duty database used by enterprises to store large amounts of data. This includes GIS data, but RDBMSs also store many other types of datasets. Anytime you apply for a driver's license, fill out a hospital admittance form, or buy something online, your information is probably getting pushed into an RDBMS of some sort. Common RDBMSs include Microsoft SQL Server, Oracle, and the open source PostgreSQL. ESRI also supports a scaled-down version of an RDBMS called SQL Server Express that is offered for free by Microsoft.
- Geodatabases (you may also recall the term ArcSDE) are an Esri technology that allows data stored in an RDBMS to be easily used within ArcGIS. It provides features such as versioning [34] and replication [35] that allow you to maintain different branches and copies of your data to accommodate enterprise workflows.
Why are these things required for web editing with ArcGIS Server? One thing you have to consider is that when you configure editing on the web, you may not want to expose your main production database to everyone on the network. Your data is valuable. You may have spent thousands of dollars collecting it. It may be required to meet certain quality standards. To protect your data, you'll probably choose to expose a copy, or replica, of it for web editing. This replica goes on your EC2 instance. You'll keep a separate replica of the data in your on-premises environment. This on-premises replica can be protected by your firewall, data quality checks, and so on.
From time to time, you can synchronize the two replicas using ArcGIS software tools. This means that one replica gets sent the changes that were made to the other replica, and vice versa. ArcGIS Server even provides a special type of web service for synchronizing two replicas, called a geodata service.
Terms you may see during this lesson include geodatabase and feature class. Geodatabase is an Esri-coined term to describe a database containing related GIS datasets, tables, relationship classes, topologies, and so on. A feature class is a vector dataset within a geodatabase.
Creating a geodatabase in SQL Server Express
Let's load some data onto your EC2 instance and prepare it for web editing. Your whole goal is to make a map on your instance and expose it through an ArcGIS feature service, which is the type of service that you can edit over the web. The first step is to get the data onto your instance and load it into SQL Server Express.
The first part of this process for us is to install SQL Server Express and its required licensing and system components.
- Before we begin installing a database on your server, download the following files to C:\data from the Course Resources module in Canvas; we'll need them in the next few steps:
- SQL Server Express 2017 installer
- .prvc license file that you used to install ArcGIS Server using the Cloud Formation template
- .NET Framework 3.5 is a required component of the Database Server, which we'll install first:
- On your EC2 machine, open Server Manager from the Start Menu.
- Click the Manage tab at the top.
- Click Add Roles and Features.
- Click Next until you get to the Features section highlighted along the left.
- Expand the .NET Framework 3.5 Features section, and check the box next to .NET Framework 3.5.
- Click Next and Install to finish the installation of the .NET Framework 3.5.
- You may see an error about missing files which you can ignore
- You may see an error about missing files which you can ignore
- With the .NET Framework installed, proceed to install SQL Server Express:
- Right-click the SQL Server Express installer and Run as Administrator.
- Choose the Basic install and Accept the terms.
- Install to the default location.
- When the install finishes, you'll notice on the confirmation window that your database instance is called SQLEXPRESS and your local Administrator user is designated as a database admin.
- Click Close.
- To create an enterprise geodatabase in SQL Server Express we will need to provide a keycode file. The following steps take us through the process of generating one from our license file.
- Obtain the Authorization Number:
- We already have an authorization file (.pvrc), but we need to retrieve an authorization number from it to create the required keycode file.
- If you haven't already, download the .prvc file you used to install ArcGIS Server using Cloud Formation and save it in the C:\data folder on your EC2 machine.
- Right-click it and Open With Notepad to view the text contents of the file.
- Scroll down to the Features and authorization numbers section.
- Copy the code number next to ArcGIS Server. It should have the form, ECP123456789.
- Now we'll run a Software Authorization program to generate the keycode file:
- Open Windows Explorer and browse to C:\Program Files\Common Files\ArcGIS\bin.
- Right-click SoftwareAuthorization.exe and Run As Administrator.
- Select "I have installed my software and need to authorize it."
- Choose ArcGIS Server as the Product to be Authorized.
- Click Next.
- Choose "Authorize with Esri now using the Internet", and click Next.
- Leave the default values on the Authorization Information page or, if it is blank, enter your own name and Penn State email address, and use the following contact information for the rest:
- Phone Number: 814-865-3433
- Location: United States
- Zip: 16802
- State: PA
- City: University Park
- Address 1: 302 Walker Building
- Department: Geography
- Organization: Penn State
- On the second Authorization Information page, enter the following:
- Your Organization: Education-Student
- Your Industry: Higher Education
- Yourself: Student
- On the Software Authorization Number page, paste the authorization number you copied earlier in the ArcGIS Server box.
- Select the option that you do not want to authorize any extensions.
- Click Next without checking any of the boxes to evaluate other products.
- Click Finish.
- Open Windows Explorer and browse to C:\Program Files\ESRI\License10.9\sysgen.
- You should see a new file called, keycodes. This is the file you'll provide to the database installer in the next section.
- Obtain the Authorization Number:
- Now that we have installed our underlying RDBMS (SQL Server Express), our keycode file, which we'll use to authorize the database, and the required system components, we can proceed to create an enterprise geodatabase:
- Open ArcGIS Pro on your EC2 instance.
- Open the Toolbox (under the Analysis tab) and find the Create Enterprise Geodatabase tool.
- Run the Create Enterprise Geodatabase tool and select SQL_Server in the Database Platform dropdown.
- For Instance, type the name of the instance of SQL Server Express that you just installed: localhost\SQLEXPRESS.
- For the Database, enter a name, such as geodata. This will be the name of the geodatabase we create in our SQL Server RDBMS.
- Check the box next to Operating System Authentication. This indicates that we'll use our Windows Administrator login to connect to the database, rather than a separate user that we create within SQL Server Express.
- Uncheck the box next to Sde Owned Schema.
- In the Authorization File box, browse to the keycode file you generated earlier (C:\Program Files\ESRI\License10.9\sysgen\keycodes).
- Click the Run button to issue the creation of your geodatabase in SQL Server Express.
- Download the Bighorn Sheep data [36] to your EC2 instance and extract it so that the datasets lie immediately under C:\data\BighornSheep. You can choose to download the data onto your local computer and copy it to the cloud using Remote Desktop (like we did in the previous lesson), or you can try to download it directly onto the instance through this web page.
The data is a map document and a bunch of shapefiles showing Rocky Mountain bighorn sheep habitat and sightings in Carbon County, Utah. These were obtained from the State of Utah Automated Geographic Reference Portal (AGRC) [37] except for the sightings, which are fictional.
You will prepare a feature service out of this data and create a web editing application that people can use to report bighorn sheep sightings. You'll also see how to expose the habitat boundaries for web editing.
- On your EC2 instance, start ArcGIS Pro with a new empty map and make sure the Catalog pane is displayed.
- Find the Databases folder and right-click it to create a New Database Connection. Specify SQL Server in the Database Platform dropdown, and enter localhost\SQLEXPRESS in the Instance box. Be sure the Operating System Authentication is selected as the Authentication Type. At this point, ArcGIS Pro should make a connection to the enterprise geodatabase you created in SQL Server. You should now be able to select your database, called geodata, in the Database dropdown. Click OK and you should see an entry for your database appear in the Databases folder in the Catalog pane. Rename your connection, geodata. You have now successfully created an enterprise geodatabase and connected to it from ArcGIS Pro! You now have the capability of loading data in your geodatabase as an alternative to file based formats like shapefiles and file geodatabases.
You may have noticed that your connection has the suffix, .sde. Technically, when we create a geodatabase within a commercial database like SQL Server, we are using an ESRI product called ArcSDE, or Spatial Database Engine. ArcSDE used to be a separate software package that you would install manually; now, it is embedded within the geodatabase tools in Pro, and the requisite components are loaded into SQL Server to enable the storage of spatial data. For more information about this, check out one of our other Penn State courses, Geog868 - Spatial Database Management [38].
- Right-click your geodatabase 'geodata' and click Import > Feature Class(es).
- For Input Features, browse to the lesson data folder you extracted at C:\data\BighornSheep and select all the shapefiles contained therein. Use the Shift key to help you select multiple shapefiles.
- Click the Run button to import the data into your enterprise database.
When the job completes successfully, you should see your datasets appear in the Catalog pane under "geodata".
In the end, you are going to allow editing for the sightings and sheep habitat layers. Now that you are accessing your data through ArcSDE, you are required to register these datasets as versioned before you can edit them. Versioning is an ArcGIS feature that allows you to have multiple working versions, or edit sessions, of your dataset available. Edits made to these versions can then be incorporated into the master database as needed. Versioning allows you to have multiple editors working on a dataset at the same time.
Since you're required to register the datasets as versioned, perform the following steps.
- In the Catalog pane, find the datasets you just imported. Right-click your dataset named <Database name>.DBO.Sightings and click Manage.
- Check the Versioning box.
- Select the Traditional option and check the box to Move Edits to Base.
- Repeat the above two steps to also register <Database name>.DBO.RockyMountainBighornSheep as versioned. This is the habitat layer.
You don't need to do any more work with versioning beyond the above steps. However, if you want to learn more about versioning you can browse the ESRI documentation [39].
Now that you've got the database all set up, you'll register it with ArcGIS Server.
- Realize that during the preceding steps, we were running ArcGIS Pro under the Windows user, Administrator. This user had been granted access to the SQL Server Express database earlier in our setup process. ArcGIS Server, however, runs as its own user, arcgis, which we configured during the install of Server with Cloud Formation. Therefore, we need to grant the arcgis user access to the database so that ArcGIS Server can read and write to it.
- Right-click your database connection, geodata.sde, in the Catalog pane of ArcGIS Pro and choose Administration, Create Database User.
- Leave the Input Database Connection set to your geodata database.
- Click the box to specify that we are creating a database user that corresponds to an existing Operating System user (arcgis).
- In the Database User box, enter you EC2 computer's name followed by \arcgis. You can find your computer's name by opening Server Manager from the Start button and clicking the Local Server tab along the left. Your computer name will be shown at the upper-left. It will look something like, EC2AMAZ-P48DB6O. In this example, I would enter "EC2AMAZ-P48DB6O\arcgis".
- In the Role box enter, db_owner. The db_owner role is one of a number of roles that exists in SQL Server, each with a different set of permissions. We need to grant the arcgis user editing privileges on the feature classes in the geodata database. For the purposes of this class, we are going to grant the arcgis user full administrative rights. (In practice, you probably wouldn’t give this user full control; rather, you’d give it just the amount of privileges that it needs.) For more information about creating users and customizing their permissions within SQL Server, see our course Geog868 - Spatial Database Management [40].
- Click the Run button to create the user.
- To register our database with ArcGIS Server, we'll use the Manage Data Store tool under the Share tab in ArcGIS Pro.
- Click the dropdown list and select Portal Items.
- Click the Add button and choose Database.
- Give your database a name and a tag, and click the Add button under the Publisher Database Connection box. Enter the following information:
- Platform: SQL Server
- Instance: localhost\SQLEXPRESS
- Authentication Type: Operating System Authentication
- Database: geodata
- Click OK to close this window.
- Check the box next to Same as Publisher Database Connection.
- Check the box next to your ArcGIS Server in the list to indicate that that's the place where you want the database to be registered.
- Check the box to Share the database with Everyone and click ok to complete the registration process.
- To confirm that we successfully registered the database with our server, let's use the web-based Server Manager to inspect our Server's properties.
- In a web browser, enter the URL for your Server Manager. It will look something like, https://baxtergeog865su22.e-education.psu.edu/server/manager [41].
- Sign in and click on the Site tab along the top.
- Click on the Data Stores heading along the left and you should see both your geodata database and your C:\data folder in the list of registered items. Use the Validate All button to confirm that Server can access all of the data stores.
Your data is now loaded, prepared, and registered with ArcGIS Server. In the next section, you'll start working with some maps that use this database. You will prepare them to run as feature services that can be edited over the web.
Designing a map for web editing
You learned in the previous lesson how publishing a web service requires some extra thought beyond just taking your existing map document and putting it on the server. It requires that you think about basemaps and business layers and separate those out into different services. It requires that you think about the coordinate systems of your data and the services you will overlay. Throughout this course, you'll learn of even more things to prepare for as you design a web service. In this section, we'll cover some considerations for web editing.
There are perhaps some layers in your map that you will want users to edit, and other layers that you will not want anyone to modify. For the most fine-grained control, the editable layers should be isolated into their own web service, with the non-editable layers being published in a separate service.
Once you isolate the editable layers into their own ArcGIS map document, you can set up feature templates that determine the types of items users will be allowed to create. You can predefine the symbology and some of the attributes of these items to make the job of your editors (and, as you will see, your web application developers) as simple as possible.
When the map is ready, you publish it to ArcGIS Server with the Feature Access capability enabled.
Designing map services for web editing
Let's take a look at how you can design a map document (.mxd file) for web editing. You will start with an MXD that was included in the BighornSheep lesson data that you downloaded previously.
- If necessary, start your EC2 instance and log in through Remote Desktop Connection.
In the previous section of the lesson, you moved all the BighornSheep data to an ArcSDE geodatabase in SQL Server Express. Just to make sure we're using this database, we're going to "burn our bridges behind us" and delete the shapefiles you originally copied to your server. - On your instance, start ArcGIS Pro, open a blank map and display the Catalog pane.
- In the Catalog tree, browse to the folder where you downloaded the BighornSheep data, probably C:\data\BighornSheep. (You may first need to right-click the Folders item in the Catalog pane and Add a Folder Connection to C:\data.)
- Using the Catalog tree, delete all shapefiles in the BighornSheep folder. Do not delete BighornHabitat.mxd or Metadata.txt.
This will ensure that your MXD is not inadvertently pointing at the shapefiles. - Import and Open the BighornHabitat.mxd in ArcGIS Pro.
You'll see some broken data sources in the layer list because this map was originally pointing at the shapefiles. The first thing you need to do is re-point the layers at the feature classes you imported into SQL Server Express. - Click the red exclamation point next to the broken Sightings data layer.
- In the file browser dialog that appears, browse to the database section and select the Sightnigs feature class inside your geodata database.
This should re-point all your layers to the correct feature classes in the database. Once you repair one broken data connection, ArcGIS looks at the new correct path you chose and tries to find other datasets in the same location that would correspond to the other broken layers in your map document. In this case, it found similarly-named layers and fixed all the connections automatically.
If, for some reason, all the connections are not repaired automatically, you can repair them one by one using the procedure above.
- Zoom to the extent of the Carbon County boundary, and take a minute to examine this map. Think about things that have been done to prepare it for web editing, and things you still need to do.
The most important thing in this map may be what's not there, which is an unwieldy number of layers. When you prepare a web map for GIS editing, you want only the layers that are most essential to the purpose of the app. Too many layers can slow down your app and create visual clutter that makes it difficult to perform the editing. In this map, I have chosen five vector layers that are essential for editing or providing reference.
Once you've narrowed down your layer list, it's a best practice to give the layers some intuitive, readable names that would make sense to anyone, such as Sightings, Springs, and Carbon County Boundary. This may seem like a small thing, but when you consider that the original name in the Table of Contents might have been something like CarbonCountySheep.DBO.Springs, the name change goes a long way toward making your app feel approachable. Simple usability improvements like this are especially important if you are trying to pitch your app to your organization's upper management, who may not be familiar with GIS and could be wary of technical-looking names.
Another preparation you should notice in this map is that the symbols have been chosen with large, bright symbols, colors, and labels that are easy to see (and tap if you are using a mobile device). I have symbolized the habitat by unique values based on the habitat classification (Crucial or Substantial). This will come in very handy when you look at the feature templates later on.
Despite the above preparations, there's some work that still needs to be done. There are some features in this map that make sense for field workers to edit and some that should not be exposed for editing. Sheep sightings definitely need to be exposed. For the purposes of this lesson, you are also going to expose the habitat areas for editing.
The remaining layers do not make sense to expose for web editing in this application. Probably no one using your application is going to have the authority to change the county boundary. You want to prevent the possibility that anyone could even do this. Other layers such as the springs and wilderness areas are included for reference only. Editing these is not the purpose of the web application.
So you'll need to do some work to group the editable layers in their own map document, which you'll publish as a service with editing enabled. The other layers will go into a separate map document and service.
Finally, there is the imagery layer. Because these services will typically be viewed on top of imagery in the final web application, some imagery has been put in the MXD to assist with map design. It's a lot easier to pick out colors and symbols ideal for overlaying imagery when you have some actual imagery in the background. However, this imagery is coming from an ArcGIS Online web service and, for various reasons, it is forbidden to publish an ArcGIS Server web service within another web service. Your editing web application will do the work of connecting to the editing web service and the imagery web service and overlaying them. In this way, you are performing the overlay at the web application tier instead of the service tier. This may become easier to understand when you build the application. - Right-click the World_Imagery layer, and click Remove.
- Save your ArcGIS Pro project.
Now that you've removed the imagery, you'll take the layers you don't want to be editable and put them into a separate map. You'll eventually publish both of your maps as services, giving you an editable service called BighornHabitat and a non-editable service called BighornReferenceLayers.
Let's take a detour for a few steps to prepare the reference layer map.
- Open a second map in ArcGIS Pro.
- In the Table of Contents of your original BighornHabitat map, select the layers Springs, Carbon County, and Wilderness Area. Use the Ctrl key to do the multiple select.
- Right-click the selected layers, and click Copy.
- Now go to your new blank map, right-click the data frame name (it should be called "Map"), and click Paste.
- Prepare this new map document for the web by doing the following things:
- Change the data frame coordinate system to WGS 1984 Web Mercator (Auxiliary Sphere).
- Rename the map's data frame to something more descriptive, like "Carbon County Reference Layers," instead of the default, "Map."
- Zoom the map to the Carbon County area.
- Remove any basemap layers that were added by default, like World Imagery or a Topo map.
- Set the data frame background to a dark, earthy brown color.
- Return to your original BighornHabitat map and remove the Springs, Carbon County, and Wilderness Study Areas layers.
- Save your ArcGIS Pro project.
This leaves you with just your editable layers: Sightings and Bighorn Habitat. Let's take a look at how ArcGIS exposes editing on these layers through feature templates.
- In ArcGIS Pro, view your BighornHabitat map and click the Edit tab.
- On the Edit toolbar, click the Create button. You should see a Create Features window appear.
This window holds the feature template for your editing. The template defines the types of features that editors can create or modify. You should see three types of things you can create: a Sightings point location, an area of Substantial Habitat, and an area of Crucial Habitat.
This template does not just apply in ArcGIS Pro, it applies to any web service that you publish with this map. The feature template helps you define and expose what web editors can do. Some web applications, like the one you will build later in this lesson, understand how to read and interpret the feature template to give the app user a palette of editing choices.
Notice that when creating the feature template, ArcGIS uses the unique value renderer that is set on the habitat layer. There is only one habitat feature class, yet the feature template includes the two habitat types of Substantial and Crucial. This is because the symbology is already configured with several different symbols based on the VALUE_ attribute of the CarbonCountySheep.DBO.RockyMountainBighornSheep feature class.
If a user chooses to draw a feature using the Substantial habitat type in the feature template, the VALUE_ attribute for the new feature will automatically be set to "substantial". This saves a lot of effort editing the attribute table for each feature created. If there were seven unique values for the VALUE_ attribute, then you would see seven choices in the feature template instead of two. This is just one more way that the preparation you do in configuring the map document can affect your experience using the web service.
You might ask, "Why did I go to all the effort to move the non-editable layers into another map document? Why couldn't I have just deleted them from the feature template?" This is a good question, and the answer lies in the fact that removing an item from a feature template does not prevent someone from making edits to the feature through direct web service calls. The feature template is something that is used for convenience only when designing and working with editing apps; it provides no measure of security to prevent people from making appropriately-formatted web service requests (for example, through REST-ful URLs) that would apply edits to layers outside the template. - After examining the feature template, close the Create Features pane.
You don't have to apply a dark background to this map document because you are eventually going to use these layers in a feature service. Therefore the web browser (not ArcGIS Server) will draw the features and you don't have to worry about artifacts of the data frame background color being introduced into these layers.
- Save your ArcGIS Pro project just to be safe.
In the next section, you'll publish both your maps to ArcGIS Server so that they can be used in a web editing app.
Publishing feature services for web editing
In order to get your maps into a web editing app, you need to publish them as services. Specifically, in ArcGIS, you publish your map as a map service, with the Feature Access capability enabled. This creates a feature service that can be used for web editing.
The terminology here can be confusing. Is it a map service or a feature service? The answer is...both. When you look at your GIS server as an administrator, you'll only see one service, a map service with the Feature Access capability enabled. However when you look at the GIS server as a consumer of the service, for example when you are developing a web app with the service, you will see two ways that you can access the service. You'll see the map service URL and the feature service URL. You need to use the feature service URL in order to access web editing functions. The feature service provides methods (or REST "operations") for editing. These operations include Add Features, Update Features, Delete Features, and Apply Edits. You have to enable the Feature Access capability and use the feature service URL (it ends with "FeatureServer") in order to get these methods. They don't come with a regular old map service.
In the previous section, you created two maps: BighornHabitat and BighornReferenceLayers. You'll publish the BighornHabitat map as a feature service. The reference layers map also needs to be published, but it doesn't need to have the Feature Access capability enabled.
Try these steps:
- If necessary, start your ArcGIS Server site and log in to your EC2 instance through Windows Remote Desktop.
- On your EC2 instance, start ArcGIS Pro and open BighornHabitat project that you saved in the previous lesson.
- Open the BighornHabitat map that contains the editable layers.
- Click the Share tab and choose Web Layer - Publish Web Layer.
You went through this process in the previous lesson, but we'll review the steps here once and then give you a chance to publish another service in your own.
- In the Share As Web Layer pane, give your data the name "BighornHabitat", a summary, and a tag.
- As before, select the radio button to specify Map Image under Reference Registered Data. This specifies that we want to create a regular image map services (nothing with vector tiles, for example).
- This time, however, also check the box for the Feature option. This specifies that we also want to publish our data as a feature service, that enables editing and other functionality.
- If you click the Configuration tab at the top, you should see both Map Image and Feature listed under the Layer(s) section. This confirms that we will be publishing our data in both ways.
- Confirm that your ArcGIS Server url (not the Penn state one) is shown in the Server and Folder box.
- Check the box to Share With Everyone and click Publish. (If you get an error able Allow Assignment of Unique IDs, click the error message to open the configuration page and check the box to allow.)
- Repeat the above steps to publish your other map, Carbon County Reference Layers, as a service named "CarbonCountyReferenceLayers;" however, do not enable Feature Access on the service.
- Recall that, by default, services are published without public access. To be sure that all clients are able to view your new services, visit the Server Manager page (https://namegeog865####.e-education.psu.edu/server/manager), view the list of services, click the Sharing icons, and confirm that "Everyone" is selected.
Taking into account the service you published in the previous lesson, your Services Directory should now contain the following services:
- AppalachianTrailShelters (MapServer)
- BighornHabitat (MapServer)
- BighornHabitat (FeatureServer)
- CarbonCountyReferenceLayers (MapServer)
- SampleWorldCities (MapServer)
Creating a web editing application
In the previous sections of this lesson, you have laid all the groundwork for allowing web-based editing of your GIS datasets. You've set up the database, prepared the maps, and published a web service that allows editing. Your final step is to make a web application that allows editing.
Web editing can be a successful or frustrating experience for users depending on how the web services and app are designed. You already did some work with your web services to make them easy to visualize and understand. For example, you made only a few layers editable and verified that a feature template was available so that users could create only certain types of features and have some of the attributes pre-set.
In the same way that you made simple, focused services for editing, you also need to make a simple, focused application. An application that has too many buttons, functions, or GIS lingo can seem over-complicated to field workers and other professionals in your organization who may need to perform web editing. Fortunately, it's a lot easier to make a simple web app than a complex web app.
In this lesson, you'll build a web editing applications using the ArcGIS [30]development tools, which will let you build in a what-you-see-is-what-you-get (WYSIWYG) environment so you can quickly and easily create an app. For those of you that are interested in going beyond the simple functionality, ArcGIS has an "extensible framework" which means you can build your own custom widgets and themes if you have some programming knowledge. We won't cover those extensions in this class but you should know that you're not limited to the tools and templates that Esri provides.
Creating the web map
Before we start creating the app, let's assemble the web map that we want to display inside of it. You'll do this using the same ArcGIS.com map viewer that you used in the previous lesson.
- On any machine, open a web browser to the Penn State ArcGIS Online Organization [42] site and sign in using the Enterprise login with the Penn State credentials you used in the previous lesson.
- At the top of the screen, click Map to open the map viewer.
- Follow the procedure you used in the previous lesson in "Viewing your service in a web map" to add the following layers to the map:
- Esri imagery in the background
-CarbonCountyReferenceLayers map service on top of that
- BighornHabitat feature service on top of everything - Save this map as BighornWebMap.
Creating the web app using Web AppBuilder
Now that you've got a web map set up, you can get down to the business of creating your web app.
-
In your ArcGIS Online website, click the Content link in the main menu.
-
Click the Create App button, and select Web AppBuilder.
-
Choose 2D, enter a title (e.g., BighornSheepEditingApp), tags (again at least one is required), and a summary (e.g., Bighorn Sheep editing app using ArcGIS Online), click OK.
You will see the Web AppBuilder for ArcGIS screen, and then you'll be redirected to a webpage displaying a theme and other graphical styles. -
Choose a style and color scheme that you like. I'll leave it up to you to be creative.
The important elements live under the Map and Widget tabs. We'll start with the Map tab. -
Click the Map tab, and click Choose Web Map.
-
Select the BighornWebMap you created above, and click OK.
This will bring in all the layers that you configured in the ArcGIS.com map viewer. That's all you need to do for the map design. Now, let's add some widgets. -
Click the Widget tab and click Set the widgets in this controller and then the +.
-
From the list of widgets that appears, add the Edit and Measurement widgets. Also feel free to choose a couple of others.
-
Click Save in the bottom of the pane and then Launch. The web app will open in a new browser tab (it might take a few seconds to start). Take a quick look around.
-
Now, go to your own local computer (not your EC2 instance), and log in to arcgis.com. Click Content, then click your BighornSheepEditingApp, and click View Application.
From a look at the URL, you will see that your web app is, in fact, running on ArcGIS online servers via the Penn State URL (pennstate.maps.arcgis.com); however, it is still depending on services that are running on your EC2 instance. When you stop your instance, this app will not work as expected.
If you wanted to download the source code for this app and host it on your own web server, you could easily do that using the Download link that appears by each app in your ArcGIS Online content. -
Test out your Web App thoroughly by reading and following along below.
Now that you have your app created, you can use your widgets to edit some of the underlying data. If you click the Edit widget, a sidebar window will appear with the list of editable layers within your feature layer. If you select the Sightings, you can add in some new sightings and some attributes. Try it!
You can also add a habitat area by drawing a polygon on the map (follow the on-screen instructions). You can use the controls at the bottom of the edit window to modify those changes (just like you might in the Edit window of ArcMap).
When you're done editing, click the X in the upper right of the window. These changes will be saved back to the server version. You could open your database and look at it in ArcMap on the EC2 instance to prove that this is the case.
- Take a couple of screenshots that give a tour of your ArcGIS Online app and its editing functionality, perhaps showing a before-and-after view of ArcMap on your EC2 machine that shows the Sightings layer before you make an edit via the Web App and after you make an edit in the Web App. Show how you made the app uniquely yours in design.
- When you have finished with the above, stop your EC2 Instance in AWS.
Assignment: Web-based editing
Please create a new document or PowerPoint slide show. Paste your screenshots that you took from your app. Label each with a description of what is happening in the screenshot.
Also, answer the following question in a thoughtful paragraph: What things would you change about this walkthrough or the app design if this were a real-world deployment looking at animal sightings? If you're having trouble coming up with ideas, think about this question across several layers, or tiers, of the architecture, starting at the database tier and working your way up to the GIS server tier and the web application tier.
Upload this document to Canvas in the lesson drop box.
Cloud Computing Discussion: Cloud computing economics
Cloud computing advocates often cite cost savings as a reason to adopt cloud computing. But, there is no guarantee that any given project can be more cheaply executed using cloud computing than using traditional IT provisioning. This week, we will discuss how cloud computing economics might apply to your organization or situation.
First, please read this white paper from Amazon: The Well-Architected Framework - Cost Optimization Pillar [43]. This document is part of a series available here [44] on best practices for using AWS's infrastructure services. Also, if you have purchased the optional textbook The Cloud at Your Service, please read chapter 3, "The business case for cloud computing". Despite the title, it gives a reasonably objective view of how cloud computing costs break out for different kinds of users (start-ups, small and medium businesses, large businesses).
Second, please post your reaction in the lesson discussion in Canvas on the topic below
Deliverables for this week's technology trend:
- Post a comment on the lesson Canvas discussion page that describes which aspects of cloud economics you were most aware of, and which you had not considered prior to this week's reading(s). Which parts of the reading did you find most helpful toward architecting a cost-effective cloud solution?
- Then I'd like you to offer additional insight, critique, a counter-example, or something else constructive in response to one of your colleagues' posts.
- Brownie points for linking to other technology demos, pictures, blog posts, etc., that you've found to enrich your posts so that we may all benefit.
- If there are concepts or vocabulary items that are not familiar to you -- don't suffer alone! Please post a question below. Posting a question is a form of participation, but doesn't take the place of your substantive post requested in step 1 above
Lesson 4: ArcGIS Server performance and rasterized map tiles
Overview
There's so much to learn about ArcGIS Server and GIS server technology in general that it's impossible to cover it all in this course. Instead, we've chosen to focus on some of the issues most commonly faced by people setting up and running a GIS server. In Lesson 2, you learned how to set up a server and a web service, and you viewed that service on the web. In Lesson 3, you took that a step further and learned how to prepare data for editing over the web. You also made a fully-featured web application.
In Lesson 4, you will learn how to build rasterized tile caches to improve the speed of your map services. This is a practice used by major web mapping services such as Google Maps, Bing Maps, MapQuest, and the ArcGIS Online services that you have already used in this course.
Building and maintaining tile caches requires careful strategy and planning, far beyond just knowing how to push the buttons to make tiles. For this reason, map tiling can be a fun and intriguing subject to study.
Lesson Objectives
At the successful completion of this lesson you should be able to:
- understand how to design a map for tiling;
- create and maintain a rasterized map tile cache; and
- create a substantive application using your knowledge of ArcGIS for Server.
Deliverables
- Complete: L04: Assignment
- (No discussion this week)
Ways to serve maps and the role of tiled services
By this point in the course, you may have observed that there's more than one way to take raw GIS data from your server and put it into a map in someone's web browser. Recall some of the map services you used in the previous two lessons:
- The AppalachianTrail and BighornReferenceLayers services used the server to draw a new map every time the user panned or zoomed. The completed map image was then sent to the user's computer for immediate display in the web browser.
In ArcGIS Server-speak, this is a dynamic map service, because it is drawn "dynamically", or on-demand, by the server. Dynamic map services are the default that you get when you publish a map service to ArcGIS Server, but it's not just Esri services that use this pattern. The Open Geospatial Consortium (OGC) Web Map Service (WMS) also uses this approach of sending back a dynamically-drawn image based on URL parameters sent from the requesting computer.
Dynamic map services are easy to set up, but they are not the fastest or most scalable type of service (scalability refers to how many clients can be served at one time). Accessing data and drawing a map image require the server to do work, and if a large number of people are requesting maps at the same time, the server can get overwhelmed. Complex maps with many layers or fancy symbols may take the server an unreasonably long time to draw.
Recognizing that dynamic drawing speed was suboptimal in early versions of ArcGIS Server, Esri wrote a streamlined drawing engine for the server and introduced it as an option at 9.3.1, using a special type of file you had to explicitly create called an MSD (map service definition). Starting from 10.1, the optimized drawing engine is used in all map services and the MSD takes a behind-the-scenes role. However, even a dynamic service, based on the optimized drawing engine, may not be appropriate for some heavily-used or complex maps. - The BighornHabitat layer from the previous lesson containing sheep sightings and habitat was not drawn dynamically by the server. Instead the coordinates of all the vertices of the points and polygons were sent to the web browser as text, and the browser did the work of drawing the features. This approach can be thought of as using client-side graphics, because the client (web browser) uses its graphic-drawing technology to put the features on top of the map.
ArcGIS Server map services can optionally be drawn as client-side graphics. OGC Web Feature Services (WFS) are also designed to be queried and drawn by the client machine.
Client-side graphics are great for providing interactivity to your web applications. Once you get all the geometry and attributes of the features onto the client machine, you don't have to go back to the server any more. You can change the shape or color of a feature in real time, allowing for highlighting of features, reclassification, or making edit sketches.
Client-side graphics are not appropriate in every case. Most browsers have a limit on how many points or vertices they can draw before they really start to slow down. Also, you saw in the previous lesson how symbology was limited using client-side graphics. The diagonal hash line symbolizing the habitats could only be drawn with a simple solid fill. This is because web browsers know how to draw a limited set of symbols; for example, they can't use the whole gamut of ArcMap polygon fills. - The imagery service from ArcGIS Online that you used as a background for your bighorn sheep map was a tiled (or "cached") map service. In these types of services, the server just hands out little square images (tiles) of the map that it has stored in a cache on disk. These images are usually generated by the server administrator at a number of different scales before the service is made available to the public. Then, when web users request to see a map, the server does not have to do the work of drawing the map; it can just send back whichever tiles are needed to fill the map request.
A server can send out tiles a lot faster than it can draw maps; therefore, tiled map services are quicker and can accommodate a lot more users than the other two types of services. Just take a look at how fast the imagery layer loads in your bighorn sheep app, or how quickly all the basemaps appear in the ArcGIS.com map viewer. If you have a complex map (especially a basemap) or a map that will be viewed by a lot of people, it's usually worth the effort to make a tile cache.
Like the two other choices above, tiled maps also have their unique drawbacks. The biggest one is the time investment and server power needed to generate the cache, along with the disk space necessary to store it. Also, because a cache represents a snapshot of your data at one point in time, it requires maintenance. If your source data or your map symbology is edited, you have to update the corresponding tiles in order for people to see the changes.
In this lesson, you'll learn about designing a map with the goal of building a tile cache. You'll get a chance to make some tiles and use them on the web. Since the number of tiles in a cache can multiply with each scale level added and become unmanageably large, you'll also learn about strategies for building and updating very big caches.
A word about vector tiles and rasterized tiles
A word about different tile types before we begin: There are two main types of tiles commonly used in web maps today. The kinds of tiles we've been talking about above can be thought of as rasterized tiles; in other words, they are images made up of grids of pixels. Rasterized tiles are easy for clients to draw because most apps and all web browsers know how to display an image like a JPG or a PNG; however, the server has to construct the image and, after that, you're stuck with the colors and symbols you chose.
To get around issues with rasterized tiles, another type of tiles called vector tiles have been increasing in popularity. Vector tiles are similar in concept to rasterized tiles in the sense that they are square packets of information structured in a pyramid motif and sent by the server; however, they contain vector coordinates instead of a picture of the data. This allows the styling to be easily changed. Vector tiles are displayed as client-side graphics, so the client software needs to understand what a vector tile is and how to deal with it. Older mapping software and APIs may not be able to consume vector tiles.
We will talk more about vector tiles in Lesson 5 when we work with Mapbox software, since Mapbox pioneered this format and based their company on it. Esri vector tile support [45] is growing, although it has lagged behind that of Mapbox.
Be aware that all the remaining content in Lesson 4 refers to rasterized tiles, and some of the design and performance considerations discussed may be very different when thinking about vector tiles.
Increasing your instance size for this lesson
Building rasterized cache tiles is CPU and memory-intensive. Your server is making thousands of repetitive map draws, sometimes with a very complex MXD in the background. You can build a cache a lot faster if you assign the tile creation to a powerful machine.
This short-term need for high computing power is a perfect use case for cloud computing. A lot of offices don't have a powerful machine to spare for building tiles (usually their beefiest machine is the server that's already hosting their live apps and web services). In this situation, a server administrator could launch a high memory and/or high CPU instance for just a few hours for the purpose of building tiles. The extra cost is often worth the time savings that it takes to build the cache. Once the tiles are created, the machine can be shut down or scaled down.
For this lesson only, you'll change your ArcGIS Server site to run on a memory-optimized instance [46]. This costs significantly more than the general purpose instance [47] type that you've been using, but it will allow you to work with a complex map document and build cache tiles much faster.
- Log in to the AWS Management Console and, if it is not already stopped, stop your ArcGIS Server machine instance.
- Right-click your instance, and select Instance Settings > Change Instance Type.
- Choose r4.4xlarge, and click Apply.
- To see the specs for all instance types, check out the Amazon EC2 Instance Types [48] page and drool away. Then take yourself back to reality by viewing the Amazon EC2 Pricing [49] page.
- Start your machine instance when you are ready to work with it.
Now that you are running on an instance that costs (at the time of this writing) $1.064/hour as opposed to 40 cents/hour, it's more important than ever that you remember to stop your site when you are done working on your lesson materials for the day. Also, be sure to set your instance type back to m4.2xlarge after building all your tiles in Lesson 4.
Designing a map for tiling
You'll find during this lesson that a rasterized tiled map service takes a lot of planning. Let's look at a few of the considerations needed to get a map ready for publishing as a tiled service. You'll download and examine a predesigned map and publish it as a service in preparation for making some tiles yourself.
To cache or not to cache?
The first question to settle is whether or not to make a tile cache at all. If the map is going to put strain on your server or take a noticeable amount of time to draw (these two often go together), then you need to consider making a tile cache. Most vector basemaps that give geographic context to your web map contain a lot of layers and fall into this category. This is one reason that splitting up your layers into basemap services and business layer services is a good idea; you can potentially cache the basemap while leaving the business layers uncached.
Is it necessary to cache the business layers, since that kind of data changes more frequently? Google used to do it with the Wikipedia layer in Google Maps [50]. With so many features (Wikipedia articles) to show, and with the amount of traffic Google Maps receives, it was burdensome on the servers to draw those points on the fly. (Sadly, the Wikipedia layer is no longer offered.)
In addition to high traffic scenarios, you can also consider caching business layers when the map covers a relatively small extent, the data doesn't change very often, or the data is displayed at small scales only. Layers like weather radar need to be updated frequently, but are rarely viewed at large scales and require relatively few tiles in the cache, thus the update can be performed in a reasonable amount of time.
Choosing scales
There are a lot of decisions you need to make about how to set up your tile cache, but the first choice is the set of scales at which you are going to generate tiles. These scales represent the snapshots at which web users will see your map. They also determine how long it's going to take to create the cache, and which other web services the cache will be able to overlay. Ideally, you'll decide on your set of cache scales before you start designing your map.
Keep these things in mind when choosing a set of scales:
- If you already know that your map is going to overlay, or be interchangeable with, another tiled map service, then you should match the scales of that map service. Many server administrators set out to build caches that will overlay Google Maps, Bing Maps, or ArcGIS Online. In these cases, the choice of scales is easy. You have to match the Google/Bing/Esri scales, which are thankfully the same and are built into ArcGIS Server as an option.
- Larger scales require more tiles to cover the extent of the map. It takes four times as many tiles to cache a map at 1:1000 than at 1:2000. Thus, avoid building tiles at scales zoomed in farther than you need to see. It's worth noting that you can put scales in your "tiling scheme" (the Esri term for a set of scales and other cache properties), but you don't necessarily have to build tiles at all those scales. For example, in this lesson, you'll choose to use the Google/Bing/Esri tiling scheme which includes scales all the way down to approximately 1:1000, but you won't build tiles at the largest scales, because those aren't necessary for your map.
- Most tiled web maps halve the scale's denominator when zooming in (for example, the next scale beyond 1:48000 would be 1:24000, then 1:12000 and so on). The Google/Bing/Esri tiling scheme follows this pattern, and if you decide to enter your own scales, you might choose to follow it as well. Scale sets that increase slower than this rate tend to make the user feel some tedium when zooming in, and can cause you to create a lot more tiles than you really need.
Designing the map
Creating detailed vector basemaps of the type that are typically cached presents a grand cartographic challenge. In contrast to paper cartography, in which the map has to be designed at just one scale, the web basemap has to be designed to look good at every scale in your tiling scheme.
Designing this type of multilevel basemap can require you to include varying symbols at different levels of your map. For example, a road might be represented with a 3-point line width at a large scale, a 1-point width at a medium scale, and may not be visible at all at a small scale. Since ArcMap does not allow scale-dependent symbols, you'll sometimes need to add multiple copies of the same layer into your map, set different scale ranges on them, then assign appropriate symbols for each scale range.
It's also important to choose muted colors for the base map that look good, but do not overwhelm other layers placed on top. Go to Google Maps: Designing the Modern Atlas [51] to see some examples of how the Google Map design has toned itself down over time to be more accommodating to overlays.The Esri Light Gray Canvas basemap is another study of designing a basemap specifically as a backdrop for more important thematic or operational layers.
When web mapping exploded during the past two decades, some cartographers expressed their chagrin at the simple, uniform maps churned out by websites. Some may have thought their very jobs and livelihood were threatened. However, the years have shown that cartography holds a critical place in web mapping. Projects like the OpenStreetMap terrain layer [52] and the Esri World Topographic Map [53] incorporate very advanced cartographic techniques. In a sense, map tiling gave cartographers a ticket to ride in the web world, since these detailed maps would be too slow to serve dynamically.
No wonder some GIS professionals shrink at the thought of trying to design such a map on their own. Some organizations that lack an in-house cartographer have just limped along with the same symbols they used when more primitive map server technology was available. Others have imitated the colors and symbols of the ubiquitous Google Maps in their own basemaps (perhaps in response to a manager's demand, "Make our maps look like that!").
In response to queries about how the ArcGIS Online basemaps were constructed, Esri has released sample ArcMap documents using all the ArcGIS Online base map symbols. People can insert their own data into the map or simply copy the symbol settings into their own maps. Examining one of these maps provides a good lesson in multilayer basemap design.
Examining and publishing a street map
In this part of the lesson, you'll download and examine a map template that Esri has provided for the ArcGIS Online street map. This sample map covers the Little Rock, Arkansas region. You'll then publish the map as a service and get it ready for creating tiles in the next section of the lesson.
- If necessary, start your ArcGIS Server site. You will need to use your instance a few steps down the road.
- On your local machine, open a web browser to the ArcGIS.com map viewer [54] (which you used in Lessons 2 and 3) and then choose the Streets basemap.
This is an approximation of the map you'll be working within this part of the lesson (I say approximation because Esri has updated some of the symbols slightly since they released the template you're going to download). Zoom in and take note of some of the layers that appear and disappear as you do so. Also, note how the symbols for features like rivers and cities change as you zoom in and out. - On your EC2 instance, extract the street map template files found in the Course Resources module in Canvas into a location under C:\data. The cleanest way to organize it may be to place the map and data directly under a folder named C:\data\LittleRock. Notice that the files include an MXD and a file geodatabase with a bunch of sample data.
- On your EC2 instance, import and open StMap_Template_LittleRock_WebM.mxd in ArcGIS Pro.
- Save your ArcGIS Pro project.
The first thing you should notice is how long it takes this map to draw and label. Take a look at the number of group layers and sublayers in the table of contents, and you'll see why. In addition to the sheer number of layers available, a lot of the layers are symbolized with complex symbols such as multilayer lines that take more time to draw. The performance of this map on the web will not be acceptable unless it is tiled.
The map coordinate system is WGS 1984 Web Mercator (essentially the same as WGS 1984 Web Mercator (Auxiliary Sphere), which you used in previous lessons). This is the projection used by ArcGIS Online, Bing Maps, and Google Maps. It was not designed for geographic accuracy nor aesthetic purposes, rather for convenience. You could fit the whole world on a square tile. You'll go ahead and use this projection in this lesson, even though you can certainly make a tile cache in whatever projection you want.
As you examine the table of contents, notice that this map is organized with group layers, each corresponding to a scale range. This particular map is designed for viewing at about 1:1,000,000 scale down to 1:4,500 scale. Any other scale is not going to result in a map being drawn. The layers were painstakingly copied, symbolized, and grouped so that the map would look good at each scale.
To view the map at the ArcGIS Online, Bing, and Google scales, click the scale dropdown at the bottom of the ArcGIS Pro map and click Customize.
 Figure 4.1 Customizing the scales list
Then click Load, and click ArcGIS Online / Bing Maps / Google Maps. Click OK, and you will see the ArcGIS Online, Bing, and Google scales appear in the dropdown. Take some time to jump between them and examine the layers and symbols that will be in your tile cache. Figure 4.2 The ArcGIS Online, Bing, and Google scales appear in the dropdown menu
- Navigate your map so that it covers the full Little Rock region and then save the ArcGIS Pro project.
- Leaving ArcGIS Pro open, move on to the next part of the lesson.
Creating a server-side cache of map tiles
Now that you've finished designing your map, you're ready to start creating the cache of map tiles. As an advance notice, you should plan at least one continuous hour to work on this page of the lesson.
In this lesson, you'll learn how to create tiles using ArcGIS Server. However, tiles can be created using many other types of GIS and mapping utilities. Mapnik [55] is an example, which is used to create the tiles for OpenStreetMap.
Map tiling has become so popular that the Open Geospatial Consortium (OGC) has even released the Web Map Tiling Standard (WMTS) detailing an open specification on how mapping web services should expose their tile sets. ArcGIS Server services that have a tile cache can respond to WMTS-formatted requests.
Creating a tile cache with ArcGIS Server
When you publish a map service or image service in ArcGIS Server, you can define whether it will have a cache and what the cache properties will be. You can either build the tiles right at the time the service is published, or you can instigate the tile building later using geoprocessing tools like Manage Map Server Cache Tiles. Building the tiles at publish time is appropriate for smaller cache jobs, and that's what we'll do in this lesson.
- Make sure you are logged in to your EC2 instance and displaying your Little Rock project in ArcGIS Pro. In other words, you should be at the exact same point where you left off in the previous section of the lesson.
- Click Share - Web Layer - Publish Web Layer, and start the process of publishing a map service named LittleRock using the pattern from previous lessons.
- This time, in the Data and Layer Type section, click the radio button specifying the Tile option under Copy all Data.
- Before you publish this new service, click the Configuration tab and click the edit button next to the Tile layer. Here is where we can customize the properties of the tile cache that will be generated.
- In the Tiling Scheme section, choose ArcGIS Online / Bing Maps / Google Maps from the list. This specifies the scales at which maps will be tiled and cached, and this will align with the scale-dependent symbology we set in the map in ArcGIS Pro. You'll see a slider to change the range of scales at which tiles will be generated. Adjust the slider so the selected scales range from 1,115,581 - 4,514. This way, a collection of map tile images will be generated for each of the scales that are designed in our map. You could expand the range to include additional scale levels, but it wouldn't benefit our map, since a larger scale (more zoomed in) would be utilizing the symbology designed for 1:4,514. Realize, that for each larger (zoomed in) scale you add, the amount of tiles will increase by around 4, since each tile is divided in to four sub tiles at the next scale. These tiles are very small images, however, the storage requirements of all those little images really adds up as we increase scale levels, so be careful how many levels you add. I recommend not going any larger that the scale of 1:4,514.
- Leave the Image Format option set to MIXED. This specifies that the smallest possible image format will be used for each tile. This is particularly useful for the edges of your map that may be blank or other areas that are mostly transparent. JPEG files are generally the smallest storage size, but they don't support transparency like PNG files do. So areas that require transparency will be stored as PNG files and other areas will be JPEGs to minimize the amount of storage required.
- In the Options section, select the Cache Automaticaly on the Server option. This causes the server to generate all tile images at all scales immediately upon publishing the service. The other options Allow tiles to be generated on-the-fly as clients hit the service and zoom and pan across the map. Initil hits by those clients will be slightly slower, since tiles need to be created in real-time, but any subsequent requests for the same map areas and scales will utilize those tile images and be really fast.
- In the Estimate section, you can ask ArcGIS Pro to make estimates for the number to tiles and the corresponding storage space required for the cache you are planning to create. You can go back and change the number of scales in the slider and re-calculate the storage estimate to see the impact of each larger scale. The map we are caching covers a relatively small area so our storage requirements are low, but you can imagine how large these numbers can get when caching imagery at more scales and for larger areas.
- Go back to the General tab and go ahead and click Publish.
- The process of generating all the tile images takes some time. You should see a progress bar along the bottom of the ArcGIS Pro window. It should get to a message indicating the the service has been published and that caching is in progress. In a web browser, go to your Server Manager site and click on the Services Tab. Along the left, click the Hosted link and you should see your Little Rock service in the list. Next to the service's name you will see a small icon (looks like four little tiles) to View Cache Status. Click that icon and you'll see a progress window that indicates how many tiles have been generated. You may also want to open the Task Manager on your EC2 machine to see how hard it is working. Right-click the task bar at the bottom of your computer's desktop (be sure you click on your Remote Desktop EC2 computer, not your local desktop computer's task bar). Clicking the Performance tab will show how much CPU and RAM are being utilized.
- The cache you're building for this lesson should take under an hour to generate. Do not stop your instance while tile generation is in progress.
I have sometimes run into repeated crashes of the tiling processes when trying to build tiles of this map. If the reported number of tiles is not increasing when you view the status, or you get an error message about a crash, just take note of the scale level at which the tiles stopped generating, and move ahead to the next steps. It's not critical that you finish creating all the tiles for this Little Rock map; it's just for practice.
- While your tiles are being built (or afterward), take a moment to open Windows Explorer and navigate to the path: C:\arcgisserver\directories\arcgiscache\Hosted_LittleRock\Little Rock, AR\_alllayers.
Take a look around. You'll see folders for each scale level of your cache. You should also see large files with the extension .bundle. A bundle file is Esri's way of storing a large number of tile image files in one compressed file. You can optionally store each tile as an individual image file (.jpg or .png) using what ArcGIS Server calls the Exploded storage format, but when your cache starts containing thousands or millions of images it can be tedious for Windows to copy it around, assign permissions, or frankly do anything with it. Bundles are the way to go.
- When you are done creating tiles (or if you stopped because of a crash), open a web browser on your local computer and open the Services Directory. The URL will look like this: https://namegeog865####.e-education.psu.edu/server/rest/services/
- If you don't see your LittleRock service in the Hosted folder, return to the ArcGIS Server Manager (https://namegeog865####.e-education.psu.edu/server/manager) in your browser, and repeat the steps we performed in earlier lessons to make your service viewable by the public (Everyone).
- Back on the rest services page, click your LittleRock service, and choose to View in ArcGIS JavaScript.
- Zoom and pan around the map for a while, and note how quickly the tiles appear. Note that if your tile caching processes crashed, then you'll only be able to zoom in to the scale level at which the tiling stopped.
- When you are done creating and experimenting with tiles, stop your AWS Instance.
- Following the same pattern you used earlier in this lesson, open the AWS Management Console, and set your instance back to the m4.2xlarge Instance Type.
Strategies for building large tile caches
The tile cache you just built was pretty straightforward. You just gave the tool a map with symbology defined for each scale level, it created tiles, and within a few minutes, you had your cache. In this case, you were fortunate that you just needed a cache of Little Rock, Arkansas. But what if you needed a cache of the entire United States, or world, down to a large scale like 1:4,500? This could take days or weeks to build, and could require terabytes of disk space. Even if you were successful at building such a cache, would you be able to do it again if the source data were updated?
This section of the lesson discusses strategic approaches for building large caches. These are presented in the order that they should be considered, meaning that if you skip down and implement one of the later strategies first, you still may end up doing things inefficiently.
Using an existing tile cache
If you need a tile cache that covers an enormous area at large scales, it would be worth your while to consider using one that someone else has built. Why go to the trouble if someone else has done it already? You've seen these types of worldwide tiled map services already throughout this course. They include ArcGIS Online, Bing Maps, and Google Maps. The companies who have built these caches have spent many thousands of dollars and hours collecting the data (often competing against each other for the best quality), building the tiles, and purchasing the hardware to serve them out in a rapid way. If you can get away with using them, you may save much time and resources.
The disadvantage of using someone else's tiles is that you cannot guarantee the accuracy or currency of the data. You don't get to choose the symbology or projection of the data either. Usually, you have to work in the Mercator projection.
Finally, if the tiled service goes offline for some reason or you lose your connection, you may have no control over when it will reappear. No server, whether it's maintained by Microsoft, Google, or Esri, can guarantee 100% uptime; however, this applies to your own servers as well. It's likely that these third-party services have better hardware infrastructure than your own when it comes to serving tiles; however, those tiles must still cross the Internet to get to your app, and that opens the door to potential connectivity problems.
Some organizations, especially those in the military and intelligence communities, have much of their network blocked from Internet access. Recognizing this, some tiled map service providers sell an appliance, basically a big server containing all the map tiles that can be plugged into your network. This eliminates the Internet access requirements, but still requires you to load periodic updates to the appliance. The Esri Data Appliance for ArcGIS [56] is an example of this type of appliance.
Creating tiles selectively
Some areas of a web map generate a lot more attention than other areas. Someone looking for directions to a particular house may zoom in down to the largest available scale in an urban area. However, in the middle of the desert where there are few geographic features to see, it's unlikely that someone would ever zoom to a very large scale such as 1:1100 (the largest scale offered by ArcGIS Online/Bing Maps/Google Maps).
Creating tiles at small scales isn't a problem since it takes relatively few tiles to cover the map, but if you are limited on time or disk space, it pays to be selective about which tiles you cache at the largest scales.
Some GIS professionals have a hard time accepting the fact that they don't need to create every tile at every scale. They feel that all places are created equal, and shudder at the idea that someone might zoom to an area of their map and see a "Data not available" image. In fact, such an experience is now commonplace among laypeople who use web maps, who tend to blame themselves when they see a "Data not available" tile ("Oh, I zoomed in too far") as opposed to blaming the server administrator ("Why isn't there a map here!?")
A useful website for countering the idea that "all places are created equal" was Microsoft Hotmap, an old project by Microsoft Researchers to visualize tile usage in Virtual Earth (now Bing Maps). This site is no longer functioning, but a screenshot below will give you an idea of its appearance. You could open Hotmap and zoom into your town, then use the Select Data Level dropdown to visualize tile usage at different levels. At the zoomed out data levels, most of the tiles are requested fairly often. But when you get down to the zoomed in data levels (17 - 19), some clear patterns begin to emerge regarding where people want to see tiles: urban areas, major roads, coastlines, and other areas of interest. There are also some places where people never or rarely view tiles: wilderness areas, bodies of water, and so on. These are the tiles you don't want to spend your resources creating and storing (for more images and analysis see Fisher D 2007 Hotmap: Looking at geographic attention. IEEE Transactions on Visualization and Computer Graphics 13: 1184-91 [57] and Fisher D 2009 The Impact of Hotmap. WWW Document [58].

A few years ago, one of the authors of this course undertook a project to selectively cache the state of California using the observed usage patterns in Hotmap. He and his colleague combined urban areas, roads, coastlines, and places of interest into a single vector dataset that covered about 25% of the land area of California, but included about 97% of its population. The use of this dataset to define tile creation, as opposed to the entire state boundary, saved nearly 1 million tiles when caching down to the 1:4500 scale (see Quinn S and Gahegan M 2010 A predictive model for frequently viewed tiles in a web map. Transactions in GIS 14: 193-216).
When using ArcGIS Server to create tiles, there are a couple of settings on the Manage Map Server Cache Tiles tool that allow you to be strategic about which tiles you create. These are the ability to check on and off the scales you want to create, and the ability to pass in a feature class boundary that will define the area of tile creation. For a large caching job, you'll probably run the tool at least twice. The first time, you'll have only the small scales checked, and you won't pass in a feature class, you'll just create all the tiles. The second time, you'll have only the large scales checked, and you will pass in a feature class constraining the area where you want to create tiles, just like you did in the previous section of the lesson where you passed in the urban Little Rock feature class.
Optimizing the map drawing speed
The faster a map draws dynamically, the faster it will create cache tiles. All GIS software has its potential tweaks that can be made to increase performance, and ArcGIS is no exception. You've already learned, for example, that you can analyze your map using the Analyze button and see a list of potential performance issues.
Anything you can do to reduce computation will help your map draw faster. Matching the coordinate system of your source data, your data frame, and your web map will eliminate any costly projection on the fly. Saving out your labels to annotation (a way of storing labels in a database) will relieve the server from having to make label placement decisions while it is drawing your map. Spatial indexes [59] can help your map more quickly find the features that it needs to draw for each requested tile.
Increasing computing resources
The more computing power you can put behind creating tiles, the faster you can build your cache. CPU and memory restraints are often more of a problem than having enough disk space to store the tiles.
There are two ways you can increase your server computing power, scaling up or scaling out. Scaling up means you replace your existing machine with something more powerful, like we did in this lesson. Scaling out means that you add more servers to your architecture, with these servers possibly all having the same size and spec.
The concept of having more than one server working on one job is called distributed computing. Although distributed computing can allow you to do great things, it comes with some unique challenges. All machines have to be able to see the data and access it, which may require some adjustment of paths used in your maps. For example, in a distributed setup, you want to use network paths like \\server\data, instead of local paths like c:\data. Cloud Formation sets up your site so that if you put your data in C:\data on the site server instance (one named SITEHOST, for example), you can reference it through the path \\SITEHOST\data from any machine in your site.
Distributed computing may also require some adjustment of security settings so that the tile creation software has permissions to access the data from any machine. In ArcGIS Server, this is accomplished by giving the ArcGIS Server account permissions to your data folder (Cloud Builder does this for you), and registering the data folder with ArcGIS Server (you did this earlier in the course).
Building a cache in the cloud
Cloud computing can be an attractive environment for building caches, because you can access a higher level of computing power than you might typically have in your office. Usually, you only need it for a short period (a few hours or days to create all the tiles), so the prospect of renting a server by the hour becomes very attractive.
One challenge with building tiles in the cloud is moving them around. First, you have to get your data onto the cloud so that your caching software can quickly get it as the tiles are being drawn. Then you have to move the tiles back to their final home, which may be on premises. Both of these transactions involve moving data across the Internet and can be influenced by your organizations' bandwidth and security policies.
When creating tiles with ArcGIS Server on Amazon EC2, it's a lot easier to scale up than to scale out. As you have seen, Amazon offers the option to change the instance type (in other words, CPU, memory, etc.) without terminating the instance. This is very handy when you start doing something and realize you need a bigger machine, although you are required to stop the instance before you change size. Some of the largest instance types on Amazon EC2 have an enormous degree of CPU power and may negate the need to scale out. Scaling out ArcGIS Server on Amazon EC2 is accomplished by adding more GIS server machines to your site.
Summary
Think back over the above strategies and consider why the techniques at the beginning should be employed before those at the end. It can be exciting to think about how many tiles you can build with distributed computing and all the computing horsepower that's available through the cloud. You may actually save the most time and resources by carefully planning which scales you want to create and selectively generating tiles at the largest scales. If the cache is still going to be overwhelmingly large, consider using an existing cache or a data appliance. By using a combination of the above strategies, you can usually find a way to build the cache you need, whatever the size.
Maintaining and updating a tile cache
A tile cache is just a picture of your data at one point in time. If that data ever changes, you need to update the cache. This final section of the lesson gives some practical considerations for updating and maintaining a cache over time.
Update strategy should affect the decision to make a tile cache
Your update strategy probably should have come into consideration before you even decided you were going to create a cache. If you need to see data in real time, or you have frequent changes occurring over broad extents of the map, then creating a tile cache may not be appropriate.
For each map, there's a threshold of acceptable data currency. For a neighborhood street map available in your handheld GPS, you may find it acceptable if the street data is updated once every three months. For a tax assessor looking at land parcels, it may be acceptable to have the data current to within the past day or two. For a 911 operator tracking a vehicle's progress, a delay of more than a few seconds may not be acceptable.
If the cache update can be performed within the threshold of acceptable data currency, then it may make sense to create a cache. If the cache cannot be updated that quickly, then caching should not be used.
Focusing cache updates
There are two approaches for cache updates; generate the entire cache, or focus the updates on places where the data has changed. If your entire cache can be rebuilt within the threshold of acceptable data currency, then it may be easier to do the first option, you can just kick off a rebuild of all the tiles and be done.
If your cache is very large and it is undesirable to rebuild the entire thing, then you need some way to track places that have been edited (for the sake of this discussion, we'll call these "dirty areas"). You can then pass the dirty area polygons into your caching tools to define where tile updates should occur.
So how do you find the dirty areas? One approach is to track them as edits are being made, each transaction can be logged to a database and, at the end of the edit session, the spatial extents of all the transactions can be exported to create a vector dataset of dirty areas.
If real-time tracking of the dataset editing is not an option, you can attempt to compare two datasets directly for attributes or spatial features that do not match. This type of strategy is required when you receive a dataset update without any record of how it was created (such as from a data vendor every six months). It requires that features have at least one key field in common between the two datasets. Comparing attributes is necessary if map symbolization or labeling could change based on a field value.
Accomplishing either of the above solutions in ArcGIS requires custom programming. Fortunately, this problem is common enough that people have posted some scripts and tools online that help address it. The Show Edits Since Reconcile [60] tool, written by Tom Brenneman, compares two versions of an ArcSDE geodatabase and outputs a feature class of spatial discrepancies. It can be installed into your list of toolboxes in ArcGIS. A similar tool Compare two feature classes in a file geodatabase [61], written by Sterling Quinn, is designed for those who do not have their data in ArcSDE.
Basing an ArcGIS tile cache update on dirty areas requires some degree of caution. A feature class full of small, adjacent polygons can cause the Manage Map Server Cache Tiles tool to work slowly and inefficiently. If there are a lot of small dirty areas in close proximity, they should be merged before the dirty areas feature class is used to define a caching job.
Automating cache updates
It's common to perform tile cache updates on a regular basis, such as every three months, every week, or every evening. Because caching is so resource-intensive, many server administrators like to build the updated tiles on a staging server and then copy them to their production server. This avoids disruption to those who are viewing tiles on the live website.
Whether you use a staging server or not, it's wise to perform the update during times when the fewest possible individuals will be using your site. For most sites, this is during the early morning hours or the weekend. Since you probably do not want to log in at 2 AM Sunday morning to run your caching tools, it's worth exploring whether your tile caching software can be automated and scheduled to run at given times.
The ArcGIS tools, for example, can be automated using a Python script. Python is a relatively simple programming language to learn, and it can be used to run any ArcGIS tool, including Manage Map Server Cache Tiles. For a full update process, you might decide to chain several tools and functions together in one script, such as:
- Compare two feature classes in a file geodatabase (to find the dirty areas)
- Manage Map Server Cache Tiles (passing in the dirty areas feature class to define where tiles are created)
- A copy function to move the new tiles from the staging server onto the production server
Once you have a script that does everything you need, you can use your operating system to schedule it to run on a regular basis. Task Scheduler, included with Windows, is an example of a program that can run scripts on a repeated basis at any time you specify (such as nights or weekends).
Python scripting with ArcGIS is taught in Penn State's Geog 485: GIS Programming and Software Development [62]. If you're curious to see an example of a Python script that updates a cache, check out the ArcGIS help topic Automating cache creation and updates with geoprocessing [63].
Assignment: Putting it all together with ArcGIS Server
In this assignment, you will put together all of the ArcGIS Server skills that you learned in Lessons 2 - 4. Starting with a folder of raw GIS datasets, you will compose maps, publish them as web services, and assemble those services into a web application. You will create a video tour of your web application so that you don't have to leave your server running as the project is graded.
The data for this assignment consists of vector feature classes covering an area around a town. I downloaded these from the State of California Geoportal [64] (formerly the California Spatial Information Library - CaSIL) and did some post-processing on them so that they cover the same extent. Don't worry too much about what town this really is; for this assignment, consider that it could be Anytown, USA.
Download the data for this assignment [65]
The scenario
Pretend you work for a town that up until now has only done GIS in the desktop realm (maybe there is no pretending needed). You are moving to ArcGIS Server for the first time. You want to take your GIS data and make it available in a series of highly-focused web applications.
Your first application will focus on your urban flooding dataset. This is a point feature class that shows areas in the city that tend to pool with water and flood during a storm event. Your web app will allow "non-GIS-trained" personnel in other city departments to add and remove points from this layer.
You've been asked to create a basemap web service that will be used as a backdrop in this web application and other apps your town will create in the future. You must design this basemap yourself and create a tile cache for it. An existing basemap from ArcGIS Online, Bing Maps, or Google Maps cannot be used because the map needs to show your town's own data. However, you can imitate design principles and techniques used in those maps.
You are also to create a separate web service containing only the urban flooding layer. This layer should be exposed as a feature service and should be editable. This involves loading the source data into SQL Server Express as shown in Lesson 3.
Once you have created these two web services, you must overlay them in a web application that allows the urban flooding service to be edited by the application user. Do this using the ArcGIS Web AppBuilder unless you already have extensive coding experience with another API such as the ArcGIS API for JavaScript.
Because this assignment takes a fair amount of time, there is no cloud computing discussion assignment this week.
Deliverables and grading
To minimize the amount of time your cloud-based server is left running, this project will be graded based on a short video tour of your app. You should record this using Zoom, Screencastomatic, or a comparable screen recording utility of your choice. Your video must demonstrate the following features in your ArcGIS Services Directory and your flooding application. Each item is worth 3 points, resulting in a total of 30 points available for this project (making it three times the value of a typical weekly assignment):
- The application contains a basemap service that has a tile cache built at appropriate scale levels (not too large, not too small). To verify this, show the Services Directory page for this service and scroll down to the section that displays all the cache scales.
- The application contains a second service that displays only the urban flooding layer. This service should have Feature Access enabled so that it can be edited. Show the Services Directory to prove that it indeed is a feature service.
- The basemap has been cartographically designed not to overwhelm any operational services that are placed on top of it.
- The basemap has been designed to be cartographically sound at all cached scales. The symbology and amount of detail shown adjust appropriately as you zoom in and out. Zoom in and out in your application, and point out how you have designed the basemap using appropriate scale ranges and symbol changes.
- The urban flooding service has been designed to easily stand out when placed on top of the base map. If necessary, transparency has been set at an appropriate level.
- The web application allows the user to edit the urban flooding layer. In your video, show that you can add a point and edit its attributes.
- The services, the layers within them, and the attributes within them are intuitively named so that an end user can understand them. You can edit the dataset schemas to accommodate this requirement if needed.
- The web application starts at an appropriate initial extent, contains an intuitive title, and includes other customizations as appropriate.
- The video includes a short oral summary of things you learned, things you enjoyed, and challenges you faced when completing the project. If you can't fit this all in the video, you're welcome to write it up and post it as a comment when you share the video URL.
- The video is no longer than 5 minutes.
I recommend you use your video recording software to export an .MP4 file or some other easily shareable format. You can either host the file on YouTube, your PSU Microsoft OneDrive space, or some other online repository and provide a link (make sure it is viewable to the faculty). Zoom [66] is a tool available to PSU faculty, staff, and students that will easily allow you to screen share and easily record your screen. Zoom recordings will save as an .MP4 file. If you don't want to put the video online or can't get that to work, you can upload it to Canvas. Contact your instructor if these options don't work.
Do not host the video on your EC2 instance. Your instance should be stopped when you are not working on this course.
Lesson 5: Map design and vector tile services using Mapbox
Overview
This lesson marks a shift in the course where we will move away from talking about ArcGIS Server running on Amazon EC2 infrastructure and begin discussing various online software as a service (SaaS) options that enable GIS in the cloud. We'll begin by exploring services offered by the company Mapbox. You'll have a chance to restyle some online basemaps and see how these new styles can take effect immediately using vector tiles. You'll also learn how to create and load data into Mapbox for thematic mapping.
Before you begin this lesson, please make sure that all your Cloud Builder sites and all your Amazon EC2 instances are stopped. You wouldn't want to leave them running and accruing charges during the next few weeks while we are working with other technology.
Lesson Objectives
At the successful completion of this lesson you should be able to:
- list some advantages and disadvantages of the software as a service (SaaS) cloud computing model for GIS;
- give examples of SaaS providers for GIS and mapping;
- use services offered by the company Mapbox for basemap design and thematic mapping;
- embed maps from Mapbox in a web page;
- explain the advantages and disadvantages of vector tiles and their differences from the rasterized tiles you created with ArcGIS Server.
Deliverables
- Complete: L05: Assignment
- Participate: L05: Discussion
Software as a service (SaaS) with mapping and GIS
In Lesson 1, you learned about the software as a service (SaaS) model of cloud computing. With SaaS, the end user doesn’t have to install, configure, or code anything: the software is accessed directly from the cloud, usually through a web browser. The cloud hardware itself is maintained or leased by the service provider, with all the details of the back end architecture hidden from the end user. In Lesson 1, you used Google Fusion Tables as an example of SaaS. Others include all Google Docs, Gmail, and the ArcGIS.com map viewer that you used in the previous lessons.
Although you may be accustomed to using free SaaS such as online email, there is also much SaaS that is sold through upfront or metered fees. In fact, the free SaaS that you encounter is usually a gateway to more services that are available on a subscription basis. For example, you’ve already seen a little bit about how the ArcGIS.com map viewer is free to use, but you’ve also seen that Esri has a for-purchase credit system used for other services (which you’ll learn about in a later lesson). In a similar fashion, Mapbox offers a free tier of services but requires a subscription for certain volumes or usages.
SaaS is gaining popularity in the GIS industry because it saves people the hassle of installing and administering complex software. This is a boon for industries that want to use maps and spatial processing, but may not have the hardware or personnel to fully deploy a GIS onsite. It also allows them to give GIS a trial or pilot run for a relatively low cost and setup effort.
Because SaaS runs in a web page and needs to be accessible on many devices, its design is also usually streamlined compared to more complex desktop GIS software interfaces. SaaS generally lowers the bar for getting started with GIS. It is an excellent way for beginners to learn GIS, mapping, and design techniques, although it should be kept in mind that the features offered by SaaS may be limited compared to locally installed software.
SaaS is also an attractive way to do GIS because certain elements of functionality can be purchased on an as-needed basis. For example, companies who need to host just one or two spatial datasets as web services can do so without having to spend lots of money upfront on their own GIS server. Organizations that use GIS SaaS should assess the cost of services on a periodic basis. If a company needs to host many datasets and perform constant data processing or geocomputation operations, the cost of SaaS may actually exceed the cost for an in-house GIS server. In other words, although SaaS is convenient, it may not always be the most economical option.
This lesson begins a series on SaaS GIS offerings. We’ll first learn about Mapbox and its services for web map design and delivery. Then we’ll look at services from Carto, which are focused primarily on thematic mapping and analysis. Finally, we’ll spend two lessons looking at ArcGIS Online, covering its web map assembly tools in more depth and exploring its geoprocessing services.
Mapbox services and vector tiles
Headquartered in Washington, DC, Mapbox is a company that provides location and mapping services such as online basemap hosting, geocoding, routing, image processing, and web mapping APIs. Mapbox is a young company, but it has made waves in the geospatial software industry by offering a unique blend of cloud technologies, map delivery and styling innovations, and open source utilities.
Mapbox markets itself as “a mapping platform for developers [67]”. It does not offer desktop-based GIS software; rather, its services seem to be aimed at journalists, full time web and mobile app developers, and organizations looking for an alternative to other cloud-based GIS products. Some of these might not have the equipment, funding, personnel, or business need to implement a full onsite GIS.
The vector data in Mapbox maps comes largely from OpenStreetMap [68], a free geographic database open to editing by anyone on the Internet. Mapbox did not invent OpenStreetMap, but it is one of the first companies to aggressively build a business model around the project. Using OpenStreetMap lowers the price point for Mapbox maps and increases the flexibility of the map (because you theoretically have some control over OpenStreetMap quality and content in your area of interest.) Because unintentional errors and vandalism do occur in OpenStreetMap, Mapbox uses employees and software tools to monitor incoming OpenStreetMap edits and improve the map. This investment offers benefits to both Mapbox and OpenStreetMap, although its effect on the community dynamics of the OpenStreetMap project is still beginning to be understood.
Mapbox mapping services rely heavily on a vector tile approach wherein packets of vector coordinates are sent to client devices to be drawn. The tiles use a pyramid motif similar to what you saw with the rasterized tiles you created with ArcGIS Server, but they contain vector coordinate information rather than images. An advantage of this approach is that vector tiles can be restyled quickly without having to re-make all the tiles, since the data is decoupled from the drawing rules. Vectors also facilitate visual effects for map rotation and zooming.
One disadvantage of vector tiles is that more computing logic is needed to display vector tiles than rasterized ones (since displaying an image is one of the most basic tasks a computer can do). Also, the symbol set and visual effects available with vector tiles may be more limited compared to what can be drawn with rasterized tiles. Finally, although it seems obvious, vector tiles can only display vectors; satellite imagery, shaded relief, and some field-based phenomena must still be drawn with rasterized tiles.
Mapbox has offered several cartographic products for designing map styles and making tiles. Their legacy TileMill tool created rasterized tiles with the aim of hosting them on Mapbox servers, although utilities existed for unpacking the tiles and hosting them on your own website (see in Geog 585: Open Web Mapping [69]). Their current tools are aimed toward creating vector tiles to be hosted on Mapbox servers.
Unlike ArcGIS Online, Mapbox does not offer web services for performing vector spatial operations such as buffering, intersections, etc.; instead, Mapbox created a free and open source JavaScript library called turf.js [70] that developers can use to perform these operations on the client side. As with many of Mapbox’s services, using turf.js requires some programming ability; but it comes with the benefit of not having to pay for a cloud service to perform these operations. Some kinds of batch operations, complex calculations, multi-step models, or large datasets may still be better suited for sending to a server.
Mapbox offers a light amount of usage for free, allowing us to experiment with their services. On the Mapbox [71] website, click Pricing and look over the plans. Then go ahead and sign up for a user name and move on to the next section of the lesson.
Creating a custom basemap with Mapbox
As you saw with ArcGIS Server, online base maps can have dozens of layers, with all kinds of rules about what zoom levels they are hidden and displayed; therefore, we’re not going to start from scratch. Instead, we’ll start with existing Mapbox basemaps (which are pretty well designed to begin with) and make small modifications to fit our taste.
First, please download the data for Lesson 5 exercises [72]. After you download the data, unzip it.
We’ll start out simple by infusing some of our own data into one of the Mapbox basemaps. We’ll then view our creation in ArcMap, where you already know how to add more layers on top.
Suppose you’re examining nighttime safety in the Washington DC area. You want to understand where activities are occurring at night relative to existing street lighting. The “Dark” basemap offered by Mapbox looks appealing for your purposes, but you want to integrate a layer showing areas that are illuminated. You plan on eventually doing some visualization of street vendor activity, pedestrian patterns, crimes, and other happenings in relation to the street lighting.
For the best user experience, you should complete the following steps on a desktop computer (not a tablet or phone):
- Open a web browser to Mapbox.com [73], click Products > Studio, and click Get Started.
- If you haven't done so, make up a username, email address, and password, and click Create a Map in Studio after you log in.
- This takes you into Mapbox Studio. Following the model of most software as a service offerings, this tool runs directly within the web browser. It allows you to choose colors, text, and symbol weights to be used in a basemap. The base data is from OpenStreetMap, although you can also load in your own layers.
- On the Styles page, find the New Style button. Click the dropdown arrow next to the New Style button and choose Classic Template.
- Proceed to customize the the Dark variation of the Monochrome template.
- On the map editor page, click the pencil icon by the style name at the top (you need to hover over it to see it), and rename it to Street Lighting instead of the default name, Monochrome.
- Zoom your map into the central area of Washington DC.
This map looks great, but wouldn’t it be nice if we could add the areas illuminated by street lights in a soft yellow glow? Let’s do that. First, we’ll need to upload our data. - On the upper-left side of Mapbox Studio, click the Mapbox icon to return to the main Studio page, and then select the Tilesets menu.
Tilesets are the vector tiles that Mapbox uses to encapsulate data displayed on the web. They’re very different from the rasterized tiles you worked with in ArcGIS Server. You can upload a vector dataset like a shapefile, and Mapbox will turn it into vector tiles, which it then hosts on its servers. You don’t ever really work with the tiles directly, but you can define styling rules to dictate how they should look. These styling rules can be changed on the fly because they are not “burned into” the tiles as they are with rasterized tiles. - Click New Tileset, and upload the light_areas.zip shapefile included in this lesson. I derived this from a dataset of street light locations and wattage that I obtained from the Open Data DC [74] website. The lighted areas are just variable distance buffers based on a very unscientific mathematical formula (i.e., I made it up) based on the wattage of the light.
- When it's done loading, navigate back to your StreetLighting basemap, and click to open the Layers list in the left-hand pane.
- Click the Add New Layer button, and use the Custom Layer option to select your new lights layer as the Source.
- Be sure to click on the Type setting and select Fill.
- In the layer list on the left hand side, drag and drop your light-areas layer so that it is underneath all labels and boundaries.
- Click your light-areas layer, and modify its color to a bright yellow with an opacity of 0.5 and no antialiasing. This gives the street lights a soft glow.
- In the upper right of your screen, click the Publish style button, and confirm you want to do this by clicking Publish again (not Publish as new).
- Click the Share... button in the menu.
- Click Third Party, and copy the URL under WMTS.
Remember from an earlier lesson a mention WMTS (web map tile service) which is an open alternative to an ArcGIS Server service for serving map data over the web via tiles. Mapbox exposes their basemaps using this specification, and we can use that endpoint (URL) to consume it in our local ArcGIS Pro maps. - Open ArcGIS Pro (on your own computer or on your EC2 instance, if you have licensed it).
- Navigate to the Insert tab - Connections - Server - New WMTS Server.
- Paste the URL you copied from the Mapbox site and click OK.
- Open the Catalog pane in ArcGIS Pro and navigate to the Servers folder. You should see an entry for your Mapbox basemap.
- Add the layer to your current map and zoom into the Washington DC area and you will see your street light features on the dark Mapbox basemap, as you styled it on the Mapbox site. Hooray! You now have your Mapbox map as a basemap in ArcGIS Pro.
- Just for fun, add your sidewalk_vendors.shp shapefile (included with this lesson’s data) as a layer in ArcGIS Pro. I also obtained this from opendata.dc.gov. It contains the locations of registered street vendors in Washington DC.
- Style and label the street vendors in such a way that you can get an idea of which ones are surrounded by lots of lighting and which ones are in the darker areas.
To recap, you took an existing Mapbox-designed basemap and fused in some of your own data. You then brought this into ArcGIS Pro so you could work with it as a basemap. The next walkthrough will go beyond this, showing you how to modify the Mapbox design, create your own thematic data, and view your creations on the web.
Creating a data overlay with Mapbox
Now that you’ve gotten a feel for the Mapbox environment, let’s try something a little more complex that involves modifying the Mapbox style, creating thematic data from scratch, and viewing the result in a web browser environment rather than ArcMap.
Suppose you’re in charge of making a website to show the five best restaurants in your town (with you and only you as the judge). You want to make a map quickly that you can embed in a website, but since you’re somewhat of a picky cartographer, you want to have full control over the map style. Let’s do this with Mapbox, first designing a basemap, then adding data to represent the five restaurants of interest.
- In Mapbox Studio, click the Styles menu and create a New Style using the Outdoors template.
- Create a name for your style, such as Geog865Base.
- Zoom in to your state and click a green area (which represents forested or park land). Then select the layer name which will probably be something like: Landcover. An additional menu should appear allowing you to modify the style of this feature, including the color.
You can modify the style of anything on the map by either clicking its layer name from the left hand list, or by clicking it on the map.
You may need to click the Override button to make changes to layer symbology.
- Change the color of the greenspace to a slightly darker green.
- Experiment with changing the Land (background) color to a different shade of gray.
- Change the roads to be a darker gray color.
- Zoom all the way in and out of the map, looking at a mix of urban and rural areas. Make any other style tweaks that you think are aesthetically appealing. For example, you might want to change the color of water bodies or labels.
You’re done editing your basemap for now. You don’t have to save your work; Mapbox Studio has been doing this as you go along. Now let’s get the restaurants entered.
- On the upper-left side of Mapbox Studio, click the Mapbox icon to return to the main Studio page, and then select the Datasets menu.
- Click New Dataset.
- Enter the name Top Five Restaurants, and click Create.
- Zoom in to a place you know well (like your town), and click the upside-down teardrop icon to draw a point.
- Click the map at the location of your favorite restaurant. An orange dot should appear. (If you need help finding this, use another map for reference or change the Background style to one of the Mapbox satellite maps).
You’ve added the coordinates of the restaurant, but now you need to add some attributes, or properties as they are called by Mapbox. - In the left panel, click the Add Property button.
We’re just going to make one simple property here called labeltext, which will hold the text we’ll use to label the restaurant. - In the field box, type labeltext, and then in the value box, type the name of the restaurant.
- Add another field called rank, and type the rank of the restaurant. Start with 1, since this is your favorite restaurant.
- Repeat this process for four more restaurants that you know about. Make sure to add the labeltext and rank fields on each.
- Click the Save button to save your edits.
So far, you’ve just created some raw geographic data that is stored on Mapbox servers. Even though it shows up as little blue dots on the editor screen, it isn’t associated with any styling information. Also, it’s not saved as vector data tiles yet. Mapbox uses these tiles to insert the data as a layer in a web map. - Click the Export button to export your data to a tileset. You can call this tileset Top Five Restaurants just as you named the dataset.
- Wait a few minutes for the tileset to be created. You’ll know when it’s done because the Processing… message will go away, and the little whirligig icon will stop spinning.
- On the upper-left side of Mapbox Studio, click the Mapbox icon, and then select the Styles menu.
- Return to your Geog865Basemap style, and add your restaurants layer. This is where you can get your restaurants onto that custom basemap that you made.
- Look over the properties that are about to be applied to your layer in the basemap, but don’t change any of them. In particular, notice you could change the zoom levels where these restaurants show up. Since they are the main thematic layer in our map, let’s leave them visible at all scales.
- Zoom the map to your area of interest and notice that your restaurants now appear on the map as dots.
Next, you’ll apply your own style to the icons and add some labels. You’ll then preview your map in a web browser.
There are several ways you could symbolize these restaurant points. One way might be with a little icon in the form of a scalable vector graphics (SVG) file. Mapbox provides a nice set of these SVG icons called Maki.
Another way is to just use a basic marker like a circle. We’ll take this approach, but we’ll also add a label from some of the information we entered in the restaurant fields. The restaurant points and the labels will be treated as separate layers in the map. Follow these steps:
- Viewing your Geog865Basemap in Mapbox Studio, change the top-five-restaurants circle symbol to have a color and outline that is appealing to you.
Now, you’ll create a layer to hold the text label. - With the top-five-restaurants layer selected, click the Duplicate Layer icon, which looks like two overlapping squares. Rename this layer to top-five-restaurants-label (which you can do at the very top of the styling details panel where it reports the layer name).
- In the styling details panel of top-five-restaurants-label, click Select Data, and set the Type to Symbol.
- Now switch over to the Style panel, and set the Text field as (rank) & ". " & (labeltext). This will substitute in the values from your rank and labeltext fields so that your labels look like “1. Fidelina’s”, “2. Kabob House”, etc. If this part doesn’t work, you may need to wait a bit longer for your tileset to update. Try logging out of Mapbox and logging back in a few minutes later.
- Click the Position menu, and set up your labels so they appear to the upper-right of the point, with an x offset of .5 em and a y offset of -.5 em, or whatever looks good to you. You should see the effects immediately once you set these properties.
- Zoom the map to an extent where your five restaurants can be seen.
- Make any further changes you want to make to your basemap in order to help the restaurants to stand out. For example, I lightened up my roads a bit.
- When the map looks the way you want, click the Publish style button. You can use the little swipe tool to see the differences between the original map and the one you modified. Then click Publish again to confirm (don’t click Publish As New).
Now, let’s take a look at how this would appear in a web map. A simple way to preview the map is in Mapbox’s basic web viewer. - Click Share... button.
- Under Share, copy the Share Preview URL and paste it into a brand new web browser. Take a look at the map you just made!
Embedding a Mapbox map in a web page
Mapbox is really geared toward developers, people who write code to embed maps in websites and apps. Websites are typically written in JavaScript, with the maps being embedded through special programming libraries (APIs) that offer functions for working with tiles, markers, etc. One of the more popular of these APIs is Leaflet. Follow the instructions below to make a real simple web page that embeds your Mapbox map via Leaflet.
- Create a brand new empty text file and save it on your computer as testmap.html. Make sure it doesn’t have a .txt extension. Don’t use a word processor like MS Word to make this file; use a real basic text editor like Windows Notepad.
- Open testmap.html and paste the following code. Don’t worry about what it all means. You will just need to modify two lines of this code to get your own Mapbox map to display inside:
<!DOCTYPE html>
<html>
<head>
<meta http-equiv="Content-Type" content="text/html; charset=utf-8">
<title>Leaflet + Mapbox test</title>
<link rel="stylesheet" href="https://cdnjs.cloudflare.com/ajax/libs/leaflet/1.0.3/leaflet.css" type="text/css" crossorigin="">
<script src="https://cdnjs.cloudflare.com/ajax/libs/leaflet/1.0.3/leaflet.js" crossorigin=""></script>
<style>
#mapid {
width: 512px;
height: 512px;
border: 1px solid #ccc;
}
.leaflet-container {
background: #fff;
}
</style>
<script type="text/javascript">
function init() {
// create map and set center and zoom level
var map = new L.map('mapid');
map.setView([47.000,-120.554],13);
var mapboxTileUrl = 'PASTE YOUR URL INSIDE THESE SINGLE QUOTES';
L.tileLayer(mapboxTileUrl, {
attribution: 'Background map data © <a href="http://openstreetmap.org">OpenStreetMap</a> contributors'
}).addTo(map);
}
</script>
</head>
<body onload="init()">
<h1 id="title">Favorite restaurants</h1>
<div id="mapid"></div>
</body>
</html>
- In the Mapbox website, click the Share... button for your style. Navigate to the Third Party section and choose CARTO in the dropdown list (the CARTO specs should be compatible with Leaflet). Copy the integration URL.
- Paste the Leaflet URL in the line of code above that says PASTE YOUR URL INSIDE THESE SINGLE QUOTES.
- Find the line above that begins with map.setView and replace the latitude and longitude with the coordinates of the center of your town or area of interest you mapped. If you fail to do this, the map will show my hometown instead of yours. You should be able to see your lat and lon in the header bar in the Mapbox editor.
- Save the changes you made to testmap.html.
- From Windows Explorer or your file browser, double-click testmap.html to open it in a browser. You should see your Mapbox map inside. Note that you must be connected to the Internet for this step to work because the above code is configured to retrieve the Leaflet API online (rather than from your own machine).
This is a pretty basic example, but hopefully it helps you see how a map like this could be embedded anywhere in a web page by an able JavaScript developer. This could be a useful supplement to a blog, news article, corporate web page, etc.
Assignment: Put your own data into Mapbox
For your assignment this week, you’ll practice the things you did in the above walkthroughs, this time using your own data.
- Choose a GIS dataset that you’ve been thinking of using in your term project. Upload it into Mapbox as a tileset. If it’s a huge dataset, just clip out a sample for this part. Follow the procedure we used for the lighted areas.
- Create a new dataset in Mapbox and make some data from scratch to accompany the dataset you uploaded. This can be some real data that you want to incorporate in your term project, or a practice dataset that you disregard in later lessons. Follow the procedure we used for the restaurants.
- Select a Mapbox basemap, and make a few style modifications to suit your needs.
- Combine all three of the above layers and display them either in ArcGIS Pro or a web browser as we did in the walkthroughs. If you want to experiment with Mapbox GL, QGIS, or some other client API or app that we didn’t use in the walkthrough, that’s fine as well.
- Produce a written report of about 300 - 500 words describing the following:
- The datasets you selected to meet the above requirements
- The style adjustments you made to the existing Mapbox basemap, and why
- A screen capture of your final map from item 4 inside of a client app like ArcGIS Pro, a web browser, etc. Do not simply show the map inside the Mapbox Studio style editor. The layers from items 1 - 3 above and the client app itself must be visible.
- Any roadblocks you hit and how you got around them
Cloud Computing Discussion: Cloud security
Security is one of the biggest concerns for organizations considering using cloud computing. I have mixed feelings about this. On the one hand, giving up physical control is a big step. On the other hand, data is not 100% secure on-site either, and leading cloud providers have security teams that are second to none.
First, read the AWS Security Center website [75] and some of its subsidiary pages, especially this overview of Security Processes [76]. In the optional textbook, you can read The Cloud at Your Service chapter 4, Security and the Private Cloud.
Deliverables for this week's technology trend:
- Post a comment on this lesson's Canvas discussion forum that describes what you think of the security procedures described in the reading. Are they sufficient to give you more comfort about putting your data and applications in the cloud? What other security concerns should we keep in mind (that Amazon might have omitted either intentionally or unintentionally)? Feel free to post questions as well.
- Then I'd like you to offer additional insight, critique, a counter-example, or something else constructive in response to one of your colleagues' posts.
- Brownie points for linking to other technology demos, pictures, blog posts, etc., that you've found to enrich your posts so that we may all benefit.
- If there are concepts or vocabulary items that are not familiar to you -- don't suffer alone! Please post a question below. Posting a question is a form of participation, but doesn't take the place of your substantive post requested in step 1 above.
Lesson 6: Thematic mapping services with CARTO
Overview
There are many interesting offerings of cloud GIS SaaS. This week, we'll try CARTO [77] (formerly CartoDB). Worth noting about CARTO is that it is an open-source project. You could completely replicate what they have, using your own Linux server. At the same time, CARTO is able to operate a business by selling their services to the many folks who would rather focus on simple mapping on the cloud instead of deploying the entire software themselves on their own hardware.
The source code is available at the GitHub website [78]. They are using a fantastic set of technologies, although it might be quite a job keeping up with all the dependent projects if you wanted to work on the source. Fortunately, there's no need, as we can use their free pricing tier to get a feel for their cloud offerings.
Lesson Objectives
At the successful completion of this lesson you should be able to:
- understand CARTO software and how it enables thematic mapping;
- analyze spatial data patterns using CARTO aggregation tools;
- visualize complex data in CARTO using time-series animations; and
- understand how to upload datasets to CARTO.
Deliverables
- Complete: L06: Assignment
- Participate: L06: Discussion
CARTO mapping and location services
CartoDB was officially launched in 2012 as a web mapping front end to a PostgreSQL + PostGIS back end database. The software was open source and could run on one's own hardware, but at the same time CartoDB offered an online subscription service wherein customers could upload datasets and make maps without having to touch the source code or configure anything themselves. In 2015, one of the best-known PostGIS masterminds, Paul Ramsey, joined CartoDB [79]. In 2016, the company changed its name to CARTO [80] and repositioned itself as a "location intelligence" tool rather than just a basic web mapping interface and online database. As such, it now also offers geodemographic analysis, routing, proximity, and address finding services.
Some of the services, you will note, are similar to those offered by the other SaaS offerings we are studying in this course: Mapbox and ArcGIS Online. This is inevitable because these companies have have found an eager market for the kinds of services they offer, and competition is a byproduct. In these course lessons, we have tried to focus the walkthroughs on some of the unique strengths of each platform or the technologies that they pioneered. One of CARTO's unique points is its variety of thematic mapping options and its appealing basemap and thematic styling options. The color schemes use the ColorBrewer [81] ramps which were developed at Penn State and are based on scientific color theory. Cartographers using CARTO can aggregate point data to tesselated regions such as hexbins or their own boundary files that they upload. They can also make time series maps, rasterized heatmap-style density surfaces, proportional symbol maps, etc.
CARTO offers a "Builder" app for web-based design and an "Engine" piece consisting of APIs. CARTO services can perhaps be considered as either PaaS or SaaS. How can we distinguish between them? One way is to consider how they will be used. If the service is being used as a source and combined with others, then it is probably a platform service. If it is being consumed directly by the end user, then it's a software service. Along the same lines, if you access the service programmatically, it's more likely to be a platform service than if you access it with a GUI.
So, if we used CARTO as a source of web maps that we pass along to end users, then it's a software service. If we use CARTO as a "table in the cloud" then we would be using it as a platform. CARTO's provision of spatial data tables on the Internet, along with both GUI and programmatic access for users and programmers, makes them a good example of a cloud GIS.
Uploading data to CARTO and aggregating to hexbins
Let's go through the steps of uploading a basic dataset to CARTO and making a web map.
First, download the data for this lesson [82]. This folder contains datasets that I derived from Portland Maps Open Data [83] and OpenDataPhilly [84]. They are stored in GeoJSON, a popular format based on JavaScript syntax that is used for interchanging vector data on the web.
Then follow these steps:
- To log into Carto, in a web browser, visit carto.com
- Click the Try For Free button to create a 14-day trial account.
- Login to the Carto Platform through the login page [85].
- If you are promtped to create an Organization, create a new unique one with your name or Penn State Access ID.
(There is an option to create a free student account via GitHub, but I have had almost no success getting that to work in previous semesters due to GitHub's verification process. They seem to have issues with us being in an online program and not physically at University Park, PA.)
- After you log in, you will see options along the left of the CARTO homepage including Maps and Data Explorer. We'll use the Data Explorer link to upload and view our datasets, and the Maps link to design some maps from them.
- Click Data Explorer and click the Import Data button.
- Browse to csa_farm_dropoffs.geojson on your computer.
- Click Continue and select the Private folder within your Organization Data as the destination for the dataset.
- Click Continue and let CARTO automatically define the schema.
- Import the data.
You should now see the dataset in the Data Explorer list. These are locations where local farms around Portland will bring their produce into the city. They drop it off at these points for urban residents who have signed up for community-supported agriculture (CSA) subscriptions. Mapping these points is one way to see which areas of Portland are currently being served by CSAs (and which ones are not).
- In the main menu along the left, enter the Map section and click the button to Create Your First Map.
- In the map window, use the Add Source From button to add your farm dataset to the map. You'll see the points overlayed on a basemap of Portland. You're now in CARTO Builder, which is a map design center similar to the ArcGIS.com map viewer or Mapbox Studio (although Builder is more for styling thematic maps rather than basemaps).
- At the very top of the window, give your map a name, and notice the Updated indicator beside it. Your map will be saved automatically as you work.
- Click the Basemap link and explore the variety of basemaps offered by CARTO. For example, try the Dark Matter layer. These are built from OpenStreetMap data. You can choose your favorite one for use in this exercise.
- Go back to the layer list, and click on the farm points layer.
- Play around with changing the fill, outline, and other properties of the points.
Sometimes it's easier to visually make sense of a bunch of dense points by aggregating them to polygons of uniform size. Hexagons are a popular choice because they are compact and tessellate (fit together) easily. Let's aggregate these points to hexagons, or "hexbins" as cartographers sometimes call them.
- Still viewing the properties of the csa_farm_dropoffs layer, choose the Hexbin (H3) option.
- In the Fill section, choose UNIQUEID and COUNT in the dropdown list. This specifies that each hexbin will indicate the total number of farm points within each area.
- Select a color ramp for the hexbins that appeals to you.
- Click the Advanced Fill Options button to reveal the Color Scale dropdown. Change the Classification Method to Custom and set each color to indicate a range of just one. For example, set the lightest color to a value range of 0 - 0, the next color to 0 - 1, the next color to 1 - 2, and so on. Since our hexbins will only contain a few csa points, these color breaks should show us a reasonable distribution on the map.
- In the color ramp section, notice the options to change the number of classes that the data is divided into. You can also change the classification type.
- Set a classification type and number of buckets that you feel best tells the story about where Portland is serviced by CSAs. Notice how much power you have over the message implicit in the map patterns. This is true with all cartography and not just online tools, yet interactive web GIS of this nature brings the power of the cartographer to the forefront.
- Use the Share button at the top of the window to Publish your map and generate a Public Share Link. Paste that url link into a new browser window to see how your map may be viewed by other users. You'll also include this link as part of your assignment submission.
Making an animated time-series map
Let's try one more kind of map that CARTO does very well: the animated time series map. This type of map is used when your data has a date and/or time field representing when an event occurred. The data we'll use represent incidents of gun violence in Philadelphia. Each point is a shooting with a field noting when the event took place. Animating these events over time within a map can show temporal and spatial patterns of violence throughout the city.
- Following the techniques you learned in previous lessons, upload shootings.geojson to CARTO.
- Look at the table in the Data Preview section of Data Explorer.
- Note the different fields that contain a date and/or time. Which one do you think represents the date the shooting occurred? If you said date, you're right. What we don't want to animate is the date that the point was added or updated within the GIS itself (unless we have no better temporal information), therefore we'll ignore the created_at and updated_at fields.
- Create a new map with the shootings data.
- Use the tools in the CARTO Builder to add a Time Series widget using the shootings data you uploaded.
- Be sure that the field the widget is using is the Date field.
- In the Behavior section, select the Filter by Viewport option. This enables the Animation controls.
- Turn the Animation Controls slider on.
- Explore the widget in the panel below the map. You should see a Play button that will animate the map and show events over time.
- You can continue to apply other thematic styling to the layer beyond the animation. Let's change the officer-involved shootings to a red color and leave all the other ones blue.
- Use the layer style tools to create a custom color scheme with two colors: red indicating that, yes, an officer was involved and blue indicating, no, an officer was not involved. In the Fill section, select the officer_involved field, and use the filter button to set the Color Scale to Ordinal. Now you should be seeing the occasional red dot appear among the animated incidents. You may want to increase the size of the point symbols to see them more easily.
The animation may be playing a bit fast for your taste at this point. There are lots of settings you can adjust to determine how fast the dots appear and how long they stay on the screen. - Use the Share button at the top of the window to Publish your map and generate a Public Share Link. Paste that url link into a new browser window to see how your map may be viewed by other users. Explore the functionality, in particular, the ability to click and draw a range of times in the animaion window to aggregate activity temporally. You'll include the link to your animation map as part of your lesson deliverables.
Assignment: Doing your own mapping with CARTO services
In this week's assignment, you'll continue getting some experience with CARTO's thematic mapping services. Please assemble a document with all of the following:
- A hyperlink to your CSA map aggregated to Hexbins.
- A hyperlink to your time-series map of Philadelphia shootings.
- A map of one of your own datasets that appropriately applies either the aggregation or time series techniques covered in the walkthroughs. Write a paragraph explaining what you are showing and justifying your design decisions regarding styling, classification, etc.
- A map of your own datasets made using some new technique you've learned by experimenting in CARTO Builder and reading its documentation. Add a paragraph explaining what technique you are using and why it's appropriate for showing these datasets.
Items 3 and 4 can use data from your final project or some other data that you've obtained from an open data website. Please be sensitive to data ownership and licensing when uploading data to CARTO; don't put your organization's proprietary data on CARTO unless you've received permission to do so.
Cloud Computing Discussion: Reliability at Cloud Scale
This week's cloud computing discussion covers Service Oriented Architecture (SOA) and Hadoop-style massively parallel data processing systems. SOA is interesting because this is how new Internet services are being developed. It is also a huge engineering challenge.
An epic blog post that helped me understand the importance of this was written by software engineer Steve Yegge [86], it is known as Stevey's Google Platforms Rant [87]. Yegge used to work for Amazon and now works for Google. Apparently, it was meant to be internal to Google, but it was accidentally published to great acclaim. Please read it for his passionate advocacy of a service oriented architecture and developer tools, and for his rather humorous, if somewhat salty and irreverent, description of life while working at these software companies.
Hadoop is an amazing system that was started by Doug Cutting, who wanted to provide the means to be able to index the entire Internet overnight, which at the time, only Google was doing effectively. Please read the Wikipedia entry on Apache Hadoop [88] for background. Hadoop is quite powerful, but also notoriously tricky to get working. Amazon has an interesting service called Elastic MapReduce [89] which claims to take a way a lot of the pain of setting up and maintaining such systems.
Deliverables for this week's cloud discussion:
- Read Stevey's Google Platforms Rant [87], the Wikipedia entry for Hadoop [88], and the introduction to these topics earlier in this page.
- Post a comment in the lesson discussion in Canvas that describes how SOAs and parallel data processing systems, as described in these articles, could benefit GIS applications and services.
- Then I'd like you to offer additional insight, critique, a counter-example, or something else constructive in response to one of your colleagues' posts.
- Brownie points for linking to other technology demos, pictures, blog posts, etc., that you've found to enrich your posts so that we may all benefit.
- If there are concepts or vocabulary items that are not familar to you, don't suffer alone! Please post a question in the Technical Discussion Forum in Canvas. Posting a question is a form of participation, but doesn't take the place of your substantive post requested in step 2 above.
Lesson 7: Web maps and data as services using ArcGIS Online
Overview
In this lesson, we begin exploring Esri's offering of SaaS cloud resources, ArcGIS Online. In review, SaaS represents the end of the cloud spectrum where more components of a system are handled by the service provider and the user is responsible for none of the hardware, software and data infrastructure. In most SaaS cases, all client interaction occurs via a Web browser, which ideally offers a user-friendly and rapid development experience.
In this lesson, you will use ArcGIS Online to assemble and share online maps that combine various web services. You'll also see how you can upload your own data to ArcGIS Online and have it run as a live web service similar to the services you published with ArcGIS Server.
Objectives
At the successful completion of this lesson, you should be able to:
- understand the role of ArcGIS Online;
- create an application for sharing maps using ArcGIS Online; and
- upload data to ArcGIS Online and access it as a web service.
Deliverables
- Complete: L07: Assignment
- Participate: L07: Discussion
ArcGIS Online and its services
The definition of SaaS suggests that all components of a computing system are provided and managed by the cloud service provider, freeing the client to focus only on utilizing or consuming the resources. ArcGIS Online is an example of this level of service. As you observed in Lesson 2, ArcGIS Online can be used as a canvas for creating web map mashups, combining services from multiple sources. You'll do some more of this in this lesson. But you'll also go a bit further and see how ArcGIS Online can be used as a hosting site for your own web services and applications.
Hosting services on ArcGIS Online
ArcGIS Online can host web services in very much the way that ArcGIS Server can host web services. This means that you can make a map in ArcMap, choose File > Share As > Service like you have always done, and choose to host the service using ArcGIS Online servers instead of your own ArcGIS Server. In fact, there are other entry points into publishing a service that don't require ArcMap, such as uploading a CSV file or a shapefile and publishing it.
Because Esri is marketing ArcGIS Online to individuals and groups who may not be familiar with ArcGIS Server or GIS technical parlance, they don't use the term web services in the ArcGIS Online documentation; instead, they use the term "hosted web layers". Nevertheless, these hosted web layers use the same Esri GeoServices [90] specification that is used by ArcGIS Server services. Therefore, code you write to interact with these services looks very similar to code you would write for ArcGIS Server.
Hosting web layers in ArcGIS Online costs money. You buy a block of "credits" from Esri, and these credits are consumed as you consume various resources in ArcGIS Online, such as uploading data and hosting services. The Service Credits Overview [91] page shows the cost in credits for various actions.
The types of web layers that ArcGIS Online can host are limited compared with ArcGIS Server. Originally, ArcGIS Online could only host (rasterized) tiled map services and feature services. Recently, layers for supporting 3D views have been added (scene layers and elevation layers). Vector tile layers are also new and can only be published through ArcGIS Pro.
There are several workflows you can take to prepare hosted layers, depending how much GIS software you have installed onsite. A good example is with rasterized tiles. You can optionally build the cache tiles using ArcGIS Online (which costs credits) or you can build them yourself in ArcGIS Desktop and upload them as a "tile package" to ArcGIS Online where they can reside as a hosted layer (which saves credits but takes more work). See the article Workflows for building and hosting cached map tiles in ArcGIS [92] for a comparison of options for building rasterized tile layers in ArcGIS Online.
Field data collection workflows
Esri has developed a number of apps for getting data into ArcGIS Online and viewing it once it is there. One of the most widely used is Collector for ArcGIS, which is used for data collection in the field, sometimes in disconnected environments. You install Collector on smartphones or tablets from the device's app store. When you open up Collector, you connect to a web map that you've saved on ArcGIS Online. You can then download base map data to your device so that you maintain geographic context if or when you become disconnected from the Internet while gathering data.
When you go out into the field, Collector uses your device's GPS to place you on the map. You can then take data points at any location and optionally supply attributes and/or attach a photo from the device's camera. When you return to a connected environment, you can "sync" the device's data into your ArcGIS Online service, where it is then available to other client applications.
Other apps such as the Esri Operations Dashboard are used for visualizing data from ArcGIS Online, whether it was put there by Collector or other means. This video series from the Esri Federal User Conference shows how Collector, ArcGIS Online, and the Operations Dashboard can work together in real time. Although this demonstration was conducted several years ago early in Collector's history, it does a nice job of showing the fundamental purpose of the app and how it can be used for data acquisition in the field.
- Operation Gold: The Operations Dashboard and Collector App for ArcGIS [93]
- Operation Gold 2: The Operations Dashboard and Collector App for ArcGIS [94]
As you will see on You Tube's "Up Next" list, there are a number of follow-up videos in this Operation Gold series that you can continue watching to see how the data is used further down the line after it is collected.
A platform as a service
When you were viewing the credit cost page, perhaps you noticed that ArcGIS Online offers geocoding and place finding services (which are free up to a point), as well as things like routing and network analysis services. Along with the ability to create mashups from third-party services, these capabilities may conceptually shift ArcGIS Online out of the SaaS category and toward the PaaS category, as the data component becomes more managed and handled by the client. This is perhaps a purely philosophical conversation rather than a practical one, but given the breadth of functionality provided by ArcGIS Online, its users may consider it to fall within SaaS or PaaS depending on the specific manner in which the site is used.
Running it on premises
Esri has recently productized a version of ArcGIS Online that can be run on premises, named Portal for ArcGIS. This is aimed at organizations that are disconnected from the Internet (such as the intelligence community), organizations that need a higher SLA (uptime percentage) than ArcGIS Online can offer, or organizations that simply do not feel comfortable moving to the cloud yet.
Portal for ArcGIS looks and feels the same as ArcGIS Online, but uses ArcGIS Server on the back end for hosting any services published by portal users. The administrator of Portal for ArcGIS is responsible for making sure the portal and server have enough hardware to accommodate requests and uploads by portal users. You will learn more about Portal for ArcGIS in Lesson 9.
Exploring the ArcGIS.com website
The ArcGIS.com website provides a view into ArcGIS Online. Sometimes you might hear the terms ArcGIS.com and ArcGIS Online used interchangeably, but ArcGIS Online can be accessed through other Esri clients such as ArcMap and programmatically through any client using the ArcGIS REST API [95].
Take a tour of the ArcGIS.com website using the steps below.
- Open your Web browser to the following URL: arcgis.com [96] and log in using the Penn State Enterprise account you used in Lesson 2. ArcGIS Online is a cloud-based resource for viewing existing maps, creating new map products, and sharing maps with others. In ArcGIS Online, data services are presented in their map form, and the process of creating new maps and editing features is performed in a map interface.
The tabs across the top of the ArcGIS Online home page correspond to the site's primary capabilities:- Gallery - view existing maps
- Map - create new map products
- Scene - create new 3D map products
- Notebook - analyze data with Python
- Groups - share your maps with particular users or the public (shown when logged in)
- Content - manage map content that you have created (shown when logged in)
- Organization - manage users and other settings for the Organization to which your account belongs (shown when logged in)
- Browse some maps by clicking Content and clicking the Living Atlas tab. Choose one of the categories on the left, and click through some of the map thumbnails listed on the Gallery page. There are two primary kinds of things you can open here: maps, and apps. These represent products created by ArcGIS Online users and published for public access. Think of a web map as your working canvas for assembling a bunch of web services into a presentable view that can then be pulled into many different APIs or platforms. A web mapping application, in contrast, is a final view that is created with a single API and is hosted for consumption by end users only. We're going to focus on web maps right now, but in the next section of the lesson, you'll get a chance to make both a web map and a finished web mapping application.
- Choose a web map (try searching for Active Hurricanes, Cyclones and Typhoons), and click its hyperlinked title to open the Overview page. Please note the Layers section toward the bottom of the page. This section lists the source of each data layer included in the published map. You should observe that each layer specifies a URL, which corresponds to the internet map server from which this particular data service is published. The URL should indicate the host (e.g., services.arcgisonline.com) and type (ArcGIS Server, WMS) of the service.
- Now, click the Open (or Open in Map Viewer) link on the web map, and open it in the ArcGIS.com map viewer. Use the tabs on the left hand menu to explore the layer list and legend.
Think about how the physical location of the source data, the manner in which you are using it, and extent to which all of this is transparent to you fits the SaaS model of cloud computing. Have the underlying technical details of how and where the data are published been adequately hidden from you? You've seen that you can discover some of that information, via the services directory, but it isn't always necessary to know it, when using the client provided by ArcGIS Online.
This site is an example of a SaaS resource because all components of the infrastructure are managed by the cloud, from the underlying hardware and operating system, to the software and data. In fact, user-created maps in the ArcGIS Online Gallery are primarily generated by compiling and overlaying existing map layers already published to ArcGIS Online or other mapping servers. It is possible to create new data in this environment by drawing features as graphics (Add > Sketch Layer). But this is the extent to which data can be directly managed; the ArcGIS Online cloud manages the underlying data storage details.
Constructing a web map from different services
In this exercise, we will create a new web map using the ArcGIS Online map viewer. The SaaS service model specifically enables access to resources from a thin client (e.g., Web browser) and conceals the underlying cloud infrastructure, including network, servers, operating systems, and storage. The following example of building a map in ArcGIS Online takes this service model one step further by integrating not just the services of one cloud computing infrastructure (Esri), but also the underlying infrastructures of other cloud services as well (US Census Bureau, NOAA). You'll see how ArcGIS Server services can be mixed with other types of services, such as WMS, during this process.
Let's take this opportunity to review the Essential Characteristics of Cloud Computing and identify how services like ArcGIS Online achieve them:
- On-Demand self-service. Cloud computing resources should be accessible anytime and without the need for human interaction with the service provider. Like most websites, ArcGIS Online is accessible via a browser 24/7 without the need to request permission.
- Broad network access. The capabilities of ArcGIS Online are accessible from any location via the Internet, using ubiquitous clients, such as Web browsers.
- Resource Pooling, Rapid Elasticity and Measured Service. These characteristics are hidden from the client in a SaaS service model. In the case of ArcGIS Online, the allocation of resources to client requests is performed automatically by the underlying cloud infrastructure without knowledge of the user. This characteristic is of particular relevance to map services, like those you created using ArcGIS Server. The configuration of every map service specifies the maximum number of instances that service can instantiate. If multiple users request a service concurrently, additional instances can be generated to handle the simultaneous requests. If the server architecture includes multiple physical or virtual servers, map service instances can be created and destroyed on any of the available servers in a way that balances the processing load. This occurs automatically without any human interaction in the client or server.
To illustrate the flexibility and interoperability of cloud GIS, we will consume three map services from various service providers via different protocols (Esri GeoServices REST Specification and WMS). You can then add more services to this map if you wish, including any services you have published in earlier exercises. For now, let’s consume an Esri basemap service via REST, a glaciers layer via WMS, and a snow depth layer via REST. We’ll imagine that we are planning a hiking trip in Mount Rainier National Park, and we want to get an understanding of conditions.
First, download the data for this lesson [97]. Then, do the following:
- Open arcgis.com in your web browser, and log into the Penn State organization URL, pennstate.maps.psu.edu, with your Penn State access id. (You will not need your EC2 instance of ArcGIS for this lesson.)
- Click Map.
- Click Basemap, and select Dark Gray Canvas.
When you consume a map service, you often don’t get much control over the symbology, other than the transparency level. The layers we’re going to consume are lightly colored, so we’ll use the dark basemap. This particular basemap also tends to mute out most layers and this is a good thing for our map; it will keep things uncluttered.
Let’s start by adding a map served through the WMS (Web Map Service) specification. WMS is a vendor-neutral set of request and response syntax specifications defined by the Open Geospatial Consortium (OGC) for serving rasterized map images drawn on demand. Many government organizations (especially in Europe) make their web services available through WMS. - Open a new web browser page or tab, and browse the WMS services made available through the US Census Bureau TIGERweb [98] We’ll add the one for Physical Features, so take note of that one’s URL.
- In your arcgis.com map viewer, click Add > OGC WMS web service.
- Enter the URL, which should be something like, https://tigerweb.geo.census.gov/arcgis/services/TIGERweb/tigerWMS_Physic... [99]
Interestingly, you will often see “arcgis” in the URL of WMS services. This just means that the organization is using ArcGIS Server to power the service, but they have checked a box in the software to make the service available through the WMS specification in addition to Esri’s GeoServices specification. The back end data doesn’t change: just the way that it is requested and returned. - You may also need to add "WMSServer" to the end of the URL to indicate that you want to consume the service using that protocol instead of REST.
- Click Add To Map and wait a minute for the layer to appear on the map. It may take a few seconds to draw. Remember that this service is being drawn at the time you request it; it is not cached. Don’t zoom and pan around while you are waiting, as this will generate more requests and hold up the server even more.
If you don’t see anything at first, zoom in to a more local scale. - In the left hand Layer list, expand the WMS Service you added. Notice all the layers available and that some are only visible at certain scales. We’re just going to use this service to view glacier coverage.
- Turn off all layers except Glaciers and its parent node Hydrography.
- Zoom to the Mount Rainier area in central Washington state. Use the search box if you need to.
You should be seeing various glaciers covering the mountain.
Now, let’s add a current snow depth layer to understand where we might encounter snow in addition to the glaciers we’ve already viewed. This time, we'll consume the service via ESRI REST, rather than WMS. Figure 7.1: Glacier layer over Mount Ranier
 - Open a new tab or window in a web browser and examine this ArcGIS Services Directory metadata page for a snow analysis service made available through the National Weather Service [100]:
- In the arcgis.com map viewer, click Add > Web Service, and enter the NWS URL for the ArcGIS Services Directory page above.
- Click the Layer list button or the Properties button to examine the snow depth layer and to learn more about the color ramp symbology.
- Make the snow analysis layer somewhat transparent by clicking the Properties button and scrolling down to the Transparency section. You want to make it transparent enough that you can see the glaciers beneath.
 Figure 7.2: Glaciers with snow analysis layer overlay
 - Save your map as Hiking Conditions.
You just assembled a web map by combining web services from multiple sources. In the next section of the lesson, you'll add in some of your own data.
Adding your own data to an ArcGIS Online web map
So far, we’ve brought in web services from a few different servers in order to get a multidimensional picture of conditions around Mount Rainier. In many cases, you might want to add your own data to supplement whatever web services you find. Suppose you’re going to be hiking on a section of the Wonderland Trail, which encircles Mount Rainier. Let’s add this trail to our map by uploading a shapefile directly to our map in ArcGIS Online. This dataset was adapted from a file geodatabase feature class downloaded from the Washington State Recreation and Conservation Office public download page [101].
The functionality to add a shapefile directly from a .zip file is not yet supported in the new (current) version of the ArcGIS Online Map Viewer, so to perform this function we need to temporarily switch back to the Map Viewer Classic.
- In arcgis.com, open your Hiking Conditions map from the previous section of the lesson.
- If you haven't already, Save your map before proceeding.
- Click the Classic Map Viewer link at the upper-right of the window to change to the previous version of the Viewer, which supports the ability to add data directly from a file.
- Click Add > Add Layer From File.
- Browse to wonderland.zip, select the Keep Original Features option, and click Import Layer. Notice all the different data formats you can import.
This is just a zipped shapefile. After the layer imports, you’ll be prompted to define the symbol. You can style the layer based on some attribute or just define a single symbol to be used. - From the Choose an attribute to show dropdown, choose Show location only.
- In the Select a drawing style area, click the Options button and choose to symbolize your trail using a thick brightly colored line. Then click Done or OK to save your changes.
Your map will look sort of like this, although it will probably have more snow on it.
 Figure 7.3: Map with trail
 - Save your web map again.
Your data is saved inside the web map rather than being published as a regular, individual layer in your ArcGIS Online content. This works fine for small datasets that need to be used on a limited basis. However, there may be other situations where you want the data to be available to multiple web maps, or at multiple offices. In such a situation, you can publish the data as a service running directly on ArcGIS Online (with no ArcGIS Server needed). We will do this in the next section of the lesson.
Publishing your data as a hosted service on ArcGIS Online
When you saved your map in the previous section of the lesson, your trail features got saved with it. If you want your uploaded dataset to be accessible outside the map as a service to anyone who uses your ArcGIS Online organization, or the public in general, you must publish it separately as a “hosted feature service”. Let’s do that with a different shapefile.
Switch your mentality now to that of a park ranger who wants to share information with co-workers deployed in other stations around the park. You have a point dataset representing maintenance issues reported on the trail. You want your colleagues to be able to load this whenever they’re logged in to your organization.

- In arcgis.com, open your Hiking Conditions map from the previous section of the lesson.
- In the upper left of your map, click Home > Content.
- Click New Item > Your Device.
- Click Browse, and select the trail_issues.zip file included with this lesson’s data. This is a zipped point shapefile with a few points in it.
- Complete the Item from my computer dialog box, being sure to select the option to Publish this file as a hosted layer, and click Next to give your layer a name and save it to your ArcGIS Online content.
- When your service has finished publishing, examine the overview page that appears for your new trail_issues service.
- Click the Settings tab, and note that you can control editing and export functionality on this service.
- Click the Share button on the Overview page, and note that you can open access to the public or just people within your ArcGIS Online organization. Check the box for the organization, but not for the public (we don’t want the public to stumble across this practice service and think there are real issues on the trail).
- At the bottom of the Overview page, notice the Service URL. Clicking the View button will open the Services Directory page for your service where you can see that it is a bona fide feature service like the ones you’ve worked with elsewhere in this course. The URL has a token appended to it that shows you have entered the requisite ArcGIS Online credentials for viewing this service (i.e., you are logged in to your account).
Think about security for a minute. There are a variety of situations where you’d want to make this service public, and other situations where you’d only want it visible within your organization. If you make this service private to your organization, it won’t be visible in any web map that you share with the public.
In some cases, you might want to make the service publicly visible, but only allow internal people to edit it. Esri provides for this with something called feature layer views [102]. - Let’s move ahead now and add this service to our web map.
- Copy the URL from your own Services Directory page up to and including the FeatureService part (so that it looks something like .../arcgis/server/services/trail_issues/FeatureServer)
- Remember to specify your customized "trail_issues" service title.
- Return to your Hiking Conditions web map, and click Add > Web Service and paste the URL to your trail_issues feature service.
- Your trail_issues layer should appear symbolized by the default dots. Let’s symbolize it based on whether the issue has been resolved or not.
- Use the Properties pane for this layer to change the color and/or symbol for the issues points and save your changes.
- Experiement with any other options for layer symbology or funcationality, and when your web map looks awesome, go ahead and save it.
Sharing your work in a web app
We've done quite a bit of work in this walkthrough to construct a useful and nice looking web map with intuitive layer names and pop-ups. As a final step, it will be helpful for you to practice pulling this web map into an app. We'll do this using ArcGIS Online templates, a slightly different way from Lesson 3 that doesn't require the Web AppBuilder.
- Open a web browser, and log into arcgis.com as you did earlier.
- Open your Content page, and click Create App > Instant Apps.
- Choose the Basic template.
- Type a title, tags, and description, and click Done. The title can be something like Trail Monitoring App.
Now you have a chance to pull in your web map you just made. - Choose your Hiking Conditions map to display in the app.
Now you get all kinds of options for configuring this web app, similar to what you saw in the Web AppBuilder, although perhaps not as extensive. - Experiment with the settings until you get a web app that you're happy with.
- Publish and Launch your app.
- Continue refining your map and app until you're happy with how things look and behave.
Assignment: Considerations for designing web maps
Because we didn't make the trail issues feature service public, I am not confident that I will be able to view your web maps live. Therefore, I want you to take a series of screen captures demonstrating this app. I also have some questions for you to reflect on.
Please create a new document and insert the following things:
- A screen capture of the initial view of your web app.
- A screen capture of your web app zoomed in so that the glaciers, snow cover, hiking trail, and trail issues layers are visible.
- A paragraph describing some ways that you might use ArcGIS Online tools to bring together multiple services in some real world context other than hiking and outdoor recreation planning.
- A paragraph commenting on which parts of the design phase you can control when you are making a web app like this, and which phases you cannot control. Think about layer names, symbology, styling, and service reliability and uptime. How does this affect your approach to creating or using web mashups?
Cloud Computing Discussion: Practical Considerations and Cloud Vendors
This week's assignment is a little different, involving a bit less reading and a bit more research. I would like each of you to identify a cloud computing product and produce a short report. Please tell us:
1. Who is offering it
2. What essential cloud characteristics it exemplifies (remember NO-REM: Network availability, On-demand access, Resource pooling, Elasticity, Metered service), and
3. Which cloud service models (or mix of models) the product uses. Recall that these include Saas (Software as a Service), PaaS (Platform as a Service), and IaaS (Infrastructure as a Service).
4. Please comment on the services' suitability for GIS use. A GIS consists of a spatial data store, spatial data analysis, and spatial visualization (or mapping).
5. Finally, see if you can apply the concepts of SLAs and measuring operations to these providers. If you can, please explain how they apply, if not, then explain why not.
You must choose a cloud computing product that no one else is doing. So, if you are concerned that someone else might be interested in the same product, please post a short note when you have picked a product that identifies it as yours ("I'm reviewing XYZ.cloud.com" or something similar).
If you want to comment on other people's reviews, that would be good, and would help you if you had any deficiencies in your review. However, commenting on other people's reviews is not needed for full credit (unlike in other weeks).
If you have purchased the optional textbook, the chapter "Practical considerations" from The Cloud at Your Service may help you think of some discussion points.
Here's a list of cloud products to choose from if you don't have one in mind: ArcGIS Online, Mapbox, GIS Cloud, CARTO, Amazon EC2, Microsoft Azure, Google Maps, Google Earth, Heroku, CloudBees, Google AppEngine, GMail, Dropbox, OpenStreetMap, GitHub, SourceForge.
Deliverables for this week's cloud discussion:
- Pick a cloud service and review it based on the required points above.
- You must pick a service that no one else is reviewing.
Lesson 8: GIS as a service using ArcGIS Online
Overview
So far in our exploration of software as a service (SaaS) providers, we have focused largely on map design and construction. We’ve also seen how datasets can be uploaded and stored on the cloud. In this lesson, we’ll move forward and look at how GIS tools and algorithms can be invoked in a SaaS environment.
You got a taste of GIS as a service back when you used CARTO to aggregate farm dropoff points to neighborhoods. This required an algorithm to run determining the neighborhood where each point was located. The neighborhoods layer was then updated with a field showing the count of all points inside. If this were run locally, it would require you to install GIS or other spatial data processing software. Offloading this operation to the cloud requires you to solely focus on the input and output data.
Many other GIS operations are possible in the cloud; all that’s needed are some known input/output formats and some server logic that can then process the data. A popular input/output format is vector features. You’ve seen how there are lots of known formats for that, such as GeoJSON, CSV, KML, etc. Once the server receives these, it can perform operations such as buffering, intersection, routing, drive time analysis, etc., and send back the result in the form of more vectors, an image, or perhaps even textual reports. These analyses might incorporate sophisticated datasets from the cloud provider, such as road networks, address databases, or demographic information. Cloud providers can charge a metered fee, deducting money or credits for each operation performed, or they can charge flat monthly fees for different tiers of capabilities.
Although Esri is not the only company that offers GIS operations as a cloud service, it is clearly an area where they specialize. Esri ArcGIS Desktop software has hundreds of tools running all kinds of GIS operations. The challenge for Esri (and other cloud service providers) is to expose these kinds of tools online through an interface that’s intuitive to people who may have never used any GIS before. These users may know exactly what they want to accomplish, but would not be familiar with GIS terms like clip, union, buffer, etc. Companies offering GIS as a service must clearly define these terms or simplify them. Pause and spend a few minutes looking over the Perform analysis [103] page to see how Esri uses a combination of graphical icons and simplified terms to explain the spatial analysis capabilities in ArcGIS Online.
In this lesson, you'll use GIS services on ArcGIS Online to derive service areas, join demographic variables to those, and export data for further analysis outside the cloud. These are just a few of the many possible operations offered by ArcGIS Online, but they should give you a taste of how to invoke the analysis and manage Esri service credits.
Lesson Objectives
At the successful completion of this lesson, you should be able to:
- understand how spatial analysis tools can be exposed through software as a service (SaaS); and
- use analysis tools in ArcGIS Online to solve geographic problems.
Deliverables
- Become familiar with Final Term Project Requirements and Rubric
- Submit: L08: Final Project Abstract (summary) of Project Idea
- Complete: L08: Assignment
Preparing for this lesson's walkthrough exercises
Let’s get some practice with ArcGIS Online GIS analysis services. Imagine you’re working for a sushi delivery company that has made its way to fame via an app accessed from people’s smartphones. Customers use the app to order fresh-made sushi to be delivered to their home. Your company makes the sushi in small “stores” (similar to pizza delivery outlets) and delivers it from those locations.
Unfortunately, business isn’t doing too well, and the company has been forced to cut its number of stores. You are tasked with determining one of the four stores to shut down in the Yakima metro area. You’ve just learned about some geographic analysis that you could perform online to help you with your decision. You already know that you want to consider the area your delivery cars can reasonably reach from each store. You also want to find out about the customer base of each store, including how many people live near each store, how much they tend to spend on restaurants, and how many own smartphones.
The only data you have at this point is a spreadsheet containing the locations of your stores and the amount you pay in rent each month for the commercial space. Let’s start by getting that data into ArcGIS Online.
First download the data for this lesson [104]. Then do the following:

- Create a new empty map.
- Click the button to Open in Map Viewer Classic.
- Click Add > Add Layer From File. (If you don't see this option, click Modify Map.)
- Open delivery.csv in a spreadsheet program like Microsoft Excel. Examine the data, but then close it out without saving it as any other format. It needs to remain a .csv instead of an .xlsx.
- Log in to ArcGIS Online with your Penn State credentials as you did earlier.
- Browse to delivery.csv.
- Click Import Layer, and examine the resulting dialog box.
- Notice that the software is guessing that it should use the ADDRESS field to derive the location. This is what we want. (Be sure that United States is selected in the dropdown.)
- Click Add Layer. You should see four dots appear on the map in the greater Yakima area.
- Change the style of the dots to be Single Symbol. Click the blue Options button that appears, and adjust the symbol style to look how you want. If you click Symbols (next to the black dot), you’ll be presented with even more choices.
- Save the symbology settings, and then save your map with a name like Delivery analysis.
Deriving service area polygons
The first thing you want to do is find out what area is served by each store. The company has learned that customers demand their sushi within 20 minutes of ordering it. Twelve minutes are typically required to make the food, and eight minutes are allotted for delivery. Let’s find out the areas that lie within an eight-minute drive of each store.
- In the ArcGIS.com map viewer, open your Delivery analysis map from the previous section of the lesson.
- Click the Analysis button, which is up on the top menu next to the basemap selector.
- Expand Use Proximity and click Create Drive-Time Areas.
- Change the drive time to 8 minutes, and leave all the other default settings. Notice, however, that there are lots of options for taking into account live and historical traffic. With all this information available on the back end, you can imagine developers writing apps where a route could be calculated using current traffic conditions.
- Click Run Analysis, and wait for a minute for the result to be calculated. You should eventually see some irregularly-shaped polygons appear around each store, showing the area that can be reached within an 8 minute drive of each. These “service area” polygons were not derived from any street data we uploaded, nor did they come from the basemap, which is just an image. They did come from detailed street network data that Esri has assembled for use by its cloud services.
- Change the symbol of the drive time polygons to be about 35% transparent. Note that the layer itself is already 50% transparent, but we want to apply transparency on the individual polygons so that we can better see where there is overlap.
Another way to get a feel for the overlap is by selecting individual polygons. You can do this from the attribute table as described in the next steps. Figure 8.1: Adjusting symbol transparency in ArcGIS Online
 - Click the Show Table icon that appears if you hover your mouse underneath the Travel from delivery layer.
- Click a row in the table to see the corresponding polygon highlighted on the map. This table is also useful because it shows you the number of square kilometers covered by each polygon.
- Look through the table and the map, and consider the following questions: Which store covers the smallest amount of area, and how many square kilometers is this area? Which store covers the largest area? Where is there a lot of overlap between store coverage? Where are there gaps?
- Save your map.
Note that creating service area polygons in ArcGIS Online is not free. Your ArcGIS Online account was just charged some credits for using this service. Fortunately, the Penn State ArcGIS Online organization, of which we are members, is providing the credits to us and we don't need to worry about it. In your own production setting, however, it's good practice to be aware of how many credits an operation will consume before you run it. To learn how many credits all the different operations on ArcGIS Online cost, take a look at the Esri service credits [91] page. At the time of this writing, it says that it costs 0.5 credits per drive time. In the next part of the lesson we will use Data Enrichment, which is listed as 10 credits per 1,000 attributes (data variables).
The service area polygons we calculated were interesting and somewhat useful, but the raw area of the polygon alone is not enough to help us get a feel for the underlying population served. Parts of the city are much more densely populated than others. Also, people in some neighborhoods tend to eat out more than others. Some neighborhoods might also have a higher density of smartphone usage where people would be inclined to order using your app. We’ll explore these variables in the next section of the lesson.
Joining demographic data with service areas (Data Enrichment)
In this part of the walkthrough, we’ll try to learn a bit more about the customer base that lives within each 8-minute service area polygon we derived. We’ll accomplish this using what Esri calls “Data Enrichment”, in other words, joining and summarizing attributes from extensive demographic databases.
- In the ArcGIS.com map viewer, open your Delivery analysis map from the previous section of the lesson.
- Click Analysis, and choose Data Enrichment > Enrich Layer.
- Be sure your service areas polygon layer is chosen in the drop-down list.
- Click Select Variables, and make sure that United States is selected from the dropdown.
Here’s where you will be tempted to go crazy and add all kinds of interesting demographic and consumer information to your shopping cart of variables. Go ahead and add the following:
- Total Population (under Population)
- Total Housing Units (under Housing)
- Meals at Restaurants (under Spending)
- Have a Smartphone (under Behaviors)
- One other variable you think would be useful for our analysis - Ensure that you have just a handful of selected variables (in other words, make sure you didn’t accidentally click a whole category and get tons of variables added to your cart).
- Click Apply. This will close the variable selection dialog box.
- In the left menu of your viewer, scroll down and examine the other options for enrichment, but don’t change any of them. Then click Run Analysis and wait a few minutes for the enrichment to occur.
When the enrichment finishes, you’ll see a service area polygon layer just like the one you already have. The difference is in the attributes. - Open the attribute table for the Enriched travel time layer.
- Scroll over until you see some of the new attributes, such as Total Population.
Notice that some of the fields are more useful than others in their current state. We have a smartphone figure that isn’t normalized by anything. We could at least divide that by population to get some kind of an index of smartphone ownership, although it wouldn’t be perfect. - In your attribute table, click the Add Field menu item using the icon at the upper-right of the table.
- Add a field called PctSmartphone of type Double. (You may need to click the small plus icon to the right of the table to be sure all fields are visible.)
- After the PctSmartphone field is added to your table, click the field heading, and click Calculate using the SQL Option.
- Calculate the field as MP27002a_B/TOTPOP_CY as shown below. If the table goes blank after you calculate it, click onto another table and then come back to this one.
 Figure 8.8: Calculating a field in ArcGIS Online
 - Examine your new index of smartphone ownership to see which service areas have the highest ownership.
- Calculate another field called TotalRestaurantSpending that represents the monthly restaurant spending multiplied by the number of housing units (NOT population). This gives some idea of the amount spent on restaurants in each service area each month.
- Look over all the attributes and think about questions like the following: Did the service area with the largest area also have the largest population? Is there any relationship between smartphone ownership and restaurant spending?
- Save your map.
Exporting data
Since your boss only speaks Excel, it might be nice to get your stores spreadsheet back with all these enriching variables added. This can be accomplished via a simple table join from the enriched service areas back onto the delivery points.
- In the ArcGIS.com map viewer, open your Delivery analysis map from the previous section of the lesson.
- Click Analysis, and click Summarize Data > Join Features.
- Set up the join with delivery as the target layer and the Enriched travel time polygons as the join layer. Using the Choose the fields to match button, make sure you are doing an attribute join between the NAME and the NAME_1 fields (do not use “Name”--that was a field added by Esri which caused some clunkiness here with our joins). Take the defaults for all attributes not shown below, and click Run Analysis.
It may not always be a safe choice to do a join on a name field if there is the possibility of repeated names. In this case, it is fine because the name field contains a unique store number.
You might have wondered why we didn't do a spatial join. This is because a store location could conceivably fall within two or more service areas. Doing an attribute join ensures a one-to-one relationship between a store and its polygon. - Ensure that a join layer appears symbolized by points. You should be able to open the attribute table on this layer and see all your enriched variables.
Let’s make a map with this layer. How about total restaurant spending of each service area symbolized by proportionally sized circles? - In the left-hand layer list, hover over the layer name of Join Features to delivery and click Change Style (it’s the icon right next to the attribute table icon).
- Choose to symbolize the TotalRestaurantSpending attribute, and choose Counts and Amounts (Size). Then click its blue Options button.
- Play around with the symbol properties until you find something you like.
- Turn off the other layers, and examine your resulting map of restaurant spending within each store’s service area.
Remember that this spending pertains to all restaurants; the amount of spending on sushi at your company's stores could follow a quite different pattern. A choropleth map of the service area polygons might be a be an alternative choice, but it would have its own challenges due to polygons overlapping.
That’s enough mapping for the time being. Let’s get back to exporting this data to a spreadsheet. - Click Analysis, and choose Manage Data > Extract Data.
- Choose to extract Join features to delivery, and set the Study Area to be the same as display (just make sure your map is zoomed out to show all four stores).
- Leave the output format as CSV, and choose an output file name.
- Click Run Analysis.
- In the upper left corner of your ArcGIS.com map viewer, click Home > Content.
- Find your extracted CSV, and click on its name to see its item details. (If it's not there, wait a few minutes and refresh.)
- Click the Download button to save the CSV to your local computer.
- Open the spreadsheet in a program such as Excel, and verify that it contains all the original information about your four stores, plus the enriched variables. As a bonus, you’ll notice the data also comes with Lat and Lon fields since it was geocoded by your software.
Assignment: Making a decision based on your analysis
For this week's assignment, please create a single document containing all of the following:
1. Unfortunately, there is no button on any GIS, cloud-based or otherwise, that says “Give me the answer”. All the same, you were able to use ArcGIS Online services to learn quite a bit more about the potential customers of your stores. Given what you learned, make a decision about which store should be cut that would minimize the overall financial impact on the franchise.
Write a justification for your manager of about 500 words detailing your decision. This should contain evidence using the enriched variables you derived and any maps you want to make with ArcGIS Online. Discuss the impact and usefulness (or lack thereof) of each variable. If you’re at a loss about what else to include in your report, try adding a map of what the service areas would look like with your selected store cut out.
There is no “right” answer to this question (although there may be questionable or unsupported answers). I am mainly looking for evidence that you’ve thought about the data and the analysis performed in the walkthroughs, and that you can use the output to address a spatial problem.
As you perform any additional analysis and make your maps, keep an eye on your credit usage. You want to leave enough ArcGIS Online credits in your account for your final project (if you are going to use ArcGIS Online in that project).
2. In this lesson, you observed how Esri has tried to put a very user-friendly face on some complex analysis tools in order to make them approachable to people without formal GIS training. What is gained and/or lost under this approach? Are there dangers that the tools might be misused if they are overly "dumbed down", or is the simplification of the tools helpful for everyone?
Study at least two (2) of the ArcGIS Online analysis operations and find their corresponding tools in ArcToolbox. Paste screenshots of both in your report here, and provide some commentary on (1) how the user interfaces have been changed for an ArcGIS Online audience, and (2) how their user interfaces are helped or hindered through this simplification.
Term project overview and abstract assignment
The final week of this course will be dedicated to a term project that each of you will complete to integrate and apply your understanding of Cloud and Server GIS in the context of an application scenario you choose. You will select ONE project option from the list below and submit an abstract in week 8 describing your project idea. To a large degree, you will have the freedom to shape the specifics of your term project around a cloud GIS project that interests you. I hope that this allows you to either focus on a topic related to your day-to-day work or choose an area that sparks your curiosity.
Term Project Options
Here are the options you have for your term project. You should choose ONE of these options:
OPTION 1: Set up an ArcGIS Server-based website using your own data, using EC2 as a hosting service.
OPTION 2: Solve a GIS problem using multiple cloud machines.
OPTION 3: Use ArcGIS Online, Carto, or Mapbox technology to solve geographic data handling problems.
OPTION 4: Design a cloud-based infrastructure that complements an existing GIS. Since this option will deliver a design rather than an example of a working system, the written component will need to be much larger than under the other options.
OPTION 5: Develop your own topic using Cloud GIS. You will need to receive approval from your instructor.
Deliverables
The term project includes the following deliverables:
- Lesson 8: Final Project Abstract (summary) of Project Idea
- 1 paragraph project abstract indicating which project option you chose and describing in general terms what you will do and what the budget is for your project. This is due at the end of Week 8. (10 points)
- Lesson 10 Final Project Video Demonstration
- 5 minute video demonstration of Term Project, due at the end of Week 10. (30 points)
- Lesson 10: Final Term Project Report
- 500 - 1000 word final term project report, due at the end of Week 10. (60 points)
Please use the Term Project Rubric [105]as a guide for implementing your project. It describes all the pieces that need to be present in order to earn an A, such as discussions of cost and security considerations.
Abstract submission
By the end of week 8, you need to submit an abstract (summary) of your project idea. Submit this to the corresponding drop box on Canvas in the form of a document of 200 - 300 words. The instructor will review immediately and post any concerns or needed modifications.
Lesson 9: GIS on your own cloud using Portal for ArcGIS
Overview
In this course, you’ve seen how specialized server-based software such as ArcGIS Server can be used to distribute GIS resources and processing throughout an organization and, more broadly, to the public. This software is powerful, but requires advanced administration and usage skills. You’ve also become familiar with a number of providers who offer mapping and GIS services on the public cloud. The simplified and often browser-based interfaces of these SaaS providers are very attractive to organizations that want to put spatial data and analysis in the hands of users who aren’t trained in GIS. At the same time, some organizations may feel hesitant about how much of their data and operations they want to transfer onto a third-party cloud service. Concerns can include security of data, control over service uptime, and the amount of fees paid to the cloud provider.
For these reasons, organizations sometimes desire to build a cloud locally (i.e., “in house” or “on-premises”), so they can offer the simplified SaaS user experience while maintaining complete control over hardware, software, security, infrastructure, and related costs. Some SaaS cloud providers make their software available to install locally for this purpose. You’ve already seen how CARTO is an open-source project that can be installed in a local environment [106]. Most people would rather pay CARTO for a subscription than go to the trouble of setting up and maintaining a local instance; therefore CARTO continues to operate successfully as a business, however, the option for an on-premises deployment exists.
In this lesson, we’ll discuss how a local implementation of ArcGIS Online can be deployed using an Esri product called Portal for ArcGIS. We'll also take a deeper look at Esri's means for organizing maps and data through its ArcGIS Online organizational subscription services.
Lesson Objectives
At the successful completion of this lesson, you should be able to:
- describe how organizations could deploy software as a service (SaaS) solutions on their own internal clouds;
- understand the relationship between publicly available ArcGIS Online organizational pages and internal deployments using Portal for ArcGIS; and
- Perform some administrative tasks on your Server and Portal installations.
Deliverables
- Complete: L09: Assignment
- Participate: L09: Discussion
The role and context of Portal for ArcGIS
To understand Portal for ArcGIS, it’s helpful to examine how Esri server-based GIS products evolved. Years ago, Esri customers had to deploy ArcGIS Server onsite in order to publish web services. Eventually, ArcGIS Online was released with an interface that allowed people to publish feature services and (rasterized) tiled map services in the cloud without owning ArcGIS Server.
These ArcGIS Online hosted services were popular with customers that needed to make basic mashups with basemaps and thematic overlays but didn’t want to implement a full-blown ArcGIS Server. Other useful features included the ability to create, save, and share web maps using the map viewer tools you’ve been exercising in the past few lessons. This was done within the umbrella of an ArcGIS Online “organization” that Esri customers could create and administer.
In order to allow their customers the option to run such a solution on premises, Esri introduced Portal for ArcGIS. This gave organizations a basic browser-based interface where employees could upload data, make GIS web services, create maps, and share them with others at their workplace. It had the same features as an ArcGIS Online organization, but a connection to the Internet was not required.
This new Portal for ArcGIS product could be connected or “federated” to an ArcGIS Server site to give greater exposure to ArcGIS Server web services throughout the organization. The ArcGIS Server could further be configured as a “hosting server” in order to power the feature services and tiled map services published by portal users. Thus, the ArcGIS Online and ArcGIS Server functionalities were brought together. At version 10.5, Esri rebranded the ArcGIS Server + Portal for ArcGIS and their supporting components as ArcGIS Enterprise and developed a more integrated installation experience.
Esri now encourages customers to install Portal for ArcGIS as a user-friendly interface to their ArcGIS Server deployment. Think about the way you have been looking at your own ArcGIS Server site so far: because you are an administrator, you have access to ArcGIS Server Manager. That's easy enough to navigate, but your server users would just see the REST Services Directory, a very minimalist application that was built with developers (i.e., programmers) in mind. Portal for ArcGIS gives a nicer looking face to these services and can also function as a collaborative tool for internally sharing GIS services, maps, and data.
At this point, stop and read the following article very carefully, paying attention to the graphical figures. It describes in detail the different levels of integration you can configure between a portal and an ArcGIS Server site.
About using your portal with ArcGIS Server [107]
When learning about Portal for ArcGIS, be aware that the term “portal” is a term broadly used across the web that can mean several different things. Even in GIS contexts, a portal is traditionally a site where a person can go to find data downloads. Indeed, Esri still makes available software called GeoportalServer for building these types of sites. Portal for ArcGIS, however, is broader than these traditional portals in the sense that people can publish items to a back-end server. They can also use interactive tools on the portal to make and share maps. In this way, the portal goes beyond being a data catalog to acting as a multi-purpose GIS platform.
Touring ArcGIS portals and organizations
This lesson provides a tour of some public facing ArcGIS Online organizational pages while also describing how Portal for ArcGIS is configured and used.
Exploring some ArcGIS Online organizational pages
Organizations wanting to share access to maps and data links with the public will often do this on ArcGIS Online using “organizational” pages that are similar to look and function to Portal for ArcGIS. It is rare or unlikely that you will find a Portal for ArcGIS implementation open to the public because, in most cases, portals are isolated to internal environments for security and resource management purposes; however, looking at these organizational pages on ArcGIS Online can give you an idea of how a portal interface feels and behaves. Esri sometimes even refers to ArcGIS Online as a type of portal (lower-case "p"), not to be confused with the Portal for ArcGIS (upper-case "P") software product meant to be installed on internal infrastructure. We will keep this distinction between a lower-case portal and upper-case Portal in mind and use it throughout the lesson.
See this article for Esri’s official take on the difference between ArcGIS Online organizational subscriptions and Portal for ArcGIS deployments: Understand the relationship between Portal for ArcGIS and an ArcGIS Online subscription [108].
The first page we'll explore is a portal for City of Aurora, Colorado Maps [109]. The page looks somewhat like the default ArcGIS Online site, but it’s been customized with the city’s logo image and some local maps. Click the Gallery link, and you’ll be taken to some web maps that the city has shared with the public. Try a few of them. If you’re a small government, this is a real simple way to get some maps online without having someone with a ton of JavaScript experience on staff.
The Groups link is a place where collaborative groups can be configured for different purposes. Later, we’ll take a look at an organization with some extensive groups. Aurora is not heavily using this feature.
Now, take a look at this portal for City of Rio de Janeiro, Brazil [110]. It uses the same sort of layout and concept, except everything is in Portuguese. Explore around a little bit with a few of the maps in the gallery.
Here’s one more example from the International Joint Commission [111]. Go to this page and explore. Then click the Groups link. The International Joint Commission is a large governmental organization made up of US and Canadian offices. The groups page allows maps and other resources to be organized around local sub-jurisdictions. Click a group name, and then click the Content tab to see some of the maps shared in each group.
The three pages we’ve looked at all have a similar look and feel, as they have just undergone some minor customization from the default style. An example of a page with a bit more customization is Boston Maps [112]. Navigate around this page for a while and you’ll see that although the style on the surface looks a bit different, underneath you have the same core links and structure.
Finally, take a closer look at our own organizational ArcGIS Online instance at Penn State [113]. In this case, you can sign into the site to get access to more content and functionality than you had in the other cases. In the Penn State organization, you can create content (maps, apps, etc.) and upload data, all of which are hosted by esri's servers in the cloud (likely running on AWS or Azure infrastructure). As the sites are utilized, apps developed, and data uploaded, credits are consumed. Credits cost real money, and the amount can add up very quickly, particularly when uploading large quantities of data (imagery can be a culprit) or running geoprocessing tasks repeatedly (think of running a geocoding operation on addresses across the country). As we discussed earlier, these personalized ArcGIS Online organizations are a quick and easy way for you to create your own portal, but they aren't free. Being thoughtful about how they will be used and if restrictions should be put in place to prevent users from consuming excessive credits (intentionally or accidentally) is a good idea.
Tour of Portal for ArcGIS
Because most Portal for ArcGIS deployments are not public facing, this lesson does not offer an interactive tour; however, please watch this video segment [114] from the 2016 Esri International User Conference where product evangelist Derek Law demonstrates an example portal. This link starts at about 28 minutes in, and you should watch it until at least minute 32.
Notice that the user experience of Portal for ArcGIS is nearly the same as with an ArcGIS Online organizational page. The main difference is that the back end hardware is managed by your organization, not Esri. The name and password that you use when you log into the portal is also managed by your organization; Esri does not store or do anything with those credentials, and something like your ArcGIS Online developer account would not work for logging into someone's portal.
If you are still not entirely certain of the purpose or functionality of the portal, or if you are confused about the difference between Portal for ArcGIS and ArcGIS Online, I recommend watching the entire presentation in the above video link. The beginning part of the video is introductory chatter, and the technical material starts at about 7 minutes in.
Setting up a portal
Back in Lesson 2, we installed ArcGIS Enterprise. Per the Esri help topic What is ArcGIS Enterprise [115], the product comes with:
- ArcGIS Server
- Portal for ArcGIS
- ArcGIS Data Store (this holds data used by the portal)
- ArcGIS Web Adaptor (this is a small application that allows the portal and server to hook onto your organization’s existing web server)
Up to this point, we've only really interacted with the ArcGIS Server portion of the Enterprise suite of products. And that's perfectly reasonable, because Server is the backbone of Enterprise, and is the component that does the heavy lifting of publishing your data and services. There are many use-cases in which only an ArcGIS Server is utilized in a production setting. Portal is an optional component and one that may be very useful in some cases. A very common setting for a Portal installation is an organization that has a collection of datasets to manage and some number of users that need to interact with the data with varying levels of access and editing privileges. Portal provides a way to interact with Server through a GUI that presents functionality, like users, groups, permissions, and sharing, in a perhaps more user-friendly manner. Read more about Portal on the esri website [116].
As we saw earlier, installing and configuring ArcGIS Enterprise requires close collaboration with IT staff in your organization. In particular, if you recall, there were a couple things I needed to set up for you before you could run the CloudFormation installation. The installation requires a fully-qualified domain name and an SSL certificate that will allow for encrypted connections. These are things that we typically don't acquire on our own; instead, we work with our local IT folks or other organizations to set them up for us. Let's revisit these items and talk about why they are necessary for an Enterprise installation.
Internet Protocol (IP) Addresses
Every computer that's on the Internet, whether a physical machine like your desktop or laptop computer, a physical computer server in a server farm somewhere in the world, or a virtual machine like the ones we created in AWS, has a unique number that identifies it on the network. This is its IP number (or address). IP numbers typically have the form of four sets of values separated by periods, and the values can be between one and three characters. For example, 123.4.56.789 is a possible IP address.
(In order to expand the range of possible IP numbers, a new style of IP addresses with much longer values has been developed. This is called IPv6, and you may see computers with such numbers, particularly when connecting to wi-fi networks hosted by large Internet Service Providers (ISPs) like Verizon or Comcast. But we won't get into that here and just focus on IPv4.)
When we created our EC2 Instances in AWS, they were assigned a local IP number that's only unique within the Amazon ecosystem. So, we created an Elastic IP number and attached it to our Instance so that our machine is now uniquely identified on the Internet. Organiaztions, like Penn State and Amazon, are allocated a specific range of IP numbers that it is allowed to use for its computers, and those IP numbers are unique and do not exist in any other place on the Internet. By creating an Elastic IP (and paying a fee to reserve it for ourselves), Amazon assigned each of us one of its allotted IP numbers, which assures us that our IP address is, in fact, unique.
Domain Name System (DNS)
At this point, our virtual machine (EC2 Instance) is uniquely identifiable on the Internet. You could open a web browser and type the IP number into the address bar and connect to your computer's web server. But, as you know, it's rarely the case that you enter an IP number to visit a website. Rather, we use a more friendly-looking address to reference a server. These fully-qualified domain names (FQDN) consist of a specific server name, like baxtergeog865xxxx, and a domain, like e-education.psu.edu. In Geog865, we all have addresses on the same domain (e-education.psu.edu), but we each have our own individual name in front of it. Like IP numbers, these FQDNs are unique on the Internet and are a more convenient way to specify a web address. However, for that to work, the FQDN must be associated with the IP number of the machine it's intended for.
DNS is the resource that registers domain names and their corresponding IP addresses on the Internet. DNS entries must be made by an authoritative provider to be sure that the information is properly registered on the Internet, so that anyone typing the name into their browser will direct them to IP address of the correct server. In Geog865, I asked the IT department to register our names in DNS, since they have authoritative access and ownership over the e-education.psu.edu domain. Amazon has it's own mechanism called Route53 [117], which may be used for some domain names [118]. When we began this semester, I asked you to send me your Elastic IP. I then created a FQDN for you (using your last name and semester with geog865xxxx.e-education.psu.edu). Finally, I provided your domain name and corresponding IP address to the Penn State IT folks to register then in DNS.
Secure Sockets Layer (SSL)
Another reason it is important for us to utilize a FQDN (and why it is required by ArcGIS Enterprise) is that we need to enable Secure Sockets Layer (SSL) on our servers. SSL encrpyts all traffic to and from our webserver to make it more secure and harder for hackers to intercept. You know that SSL is enabled on a website when you see the https prefix on its URL instead of http. Most web servers, ISPs, and software products (like ArcGIS Enterprise) are now requiring SSL to be enabled. Similar to DNS, SSL is enabled by generating a certificate from an authoritative provider that is specific to a particular domain name. SSL certificates aren't associated with IP addresses, which is one reason why it is neccessary for us to utilize FQDNs on our ArcGIS Enterprise installs.
The SSL certificate verifies your web address’s identity and is usually obtained for a fee from a certificate authority. IT departments typically manage the acquisition and distribution of these certificates throughout their organizations. In the case of our Geog865 installations, I asked the Penn State IT department to request an SSL certificate containing all of our domain names from an authoritative provider, in our case, an organization called InCommon. I provided this certificate, in the form of a .pfx file, to everyone to supply to the CloudFormation template. You can inspect your SSL certificate by visiting your ArcGIS Server or Portal website and clicking the lock icon next to the https url and browsing its contents.
CloudFormation
Deploying ArcGIS Enterprise on clouds like AWS or Microsoft Azure might be simpler in some ways than doing it on-premises because Esri has automated parts of the configuration process with tools like Cloud Formation [119]. This is possible because all the software and configuration on the AMIs are well known. Installation in your on-premises environment could become complex if you are running some kind of software, scan, or policy that doesn't "play nicely" with one of the ArcGIS Enterprise components. Furthermore, if you're not on the IT staff, you might have greater control over cloud accounts and environments than you typically do in your on-premises environment. Tools, like Enterprise Builder [120], exist to facilitate the installation of Enterprise on an existing machine.
Since we used the Cloud Formation template to install Enterprise on our AWS machines, Portal was installed as well. You should be able to connect to your Portal with a URL like namegeog865####.e-education.psu.edu/portal. You should see a default-looking ArcGIS Online page, which illustrates essentially what Portal is: your own local, stand-alone instance of ArcGIS Online.
Sign in using the ArcGIS Site Admin username and password you created in the Cloud Formation template. You will see options to manage Members (users), view your software licenses (esri software like ArcGIS Pro and other extensions have the option to be licensed through Portal in some cases), monitor the usage of your Enterprise installation, and configure the Settings of your Portal. Explore the Settings options that are available and check out esri documentation to learn more about options like configuring your home page [121] with a custom look and feel, managing your Servers, and specifying default settings.
Administering ArcGIS Enterprise
For this week's assignment, we're going to perform a few admistrative tasks to be sure our Server and Portal sites are running smoothly. Return to your AWS Console and start the EC2 instance you used in Lessons 2 - 4.
There a number of ways to access configuration options for ArcGIS Enterprise. Two of these options are via a web browser. Depending on how your Enterprise installation is configured, you may need to use a browser on the EC2 instance itself through a Remote Desktop connection rather than from your local computer. In these cases, administrative access has been disabled from remote client machines. This is a setting you could change on your server, as well as confirming the appropriate firewall ports are open. For now, visit these sites from a browser on your EC2 machine:
- ArcGIS Server Manager (e.g., baxtergeog865####.e-education.psu.edu/server/manager), which allows us to manage map services but has limited administrative control of the underlying site.
- ArcGIS Server Administrator Directory (e.g., baxtergeog865####.e-education.psu.edu/server/admin), which provides access to many of the underlying configuration settings of the Server, WebAdaptor, DataStore, and Portal installations. Be careful when exploring this site, as one erroneous alteration could render your Enterprise server unusable.
- ArcGIS Pro (or ArcGIS Desktop), from which you can make a connection to your server and explore its properties and contents.
Let's explore the ArcGIS Server Manager site. Visit your Manager site with a url like, baxtergeog865####.e-education.psu.edu/server/manager.
Under the Services tab, you should see the various services you've created so far in the course lessons. Click the pencil icon next to one of your services to see the options you have to administer them. Explore the various sections by clicking the tabs along the left of the window. A few things to look for in particular:
- Under Paramaters, you'll see a setting for Maximum Number of Records Returned by Server. This is a setting for vector services that will limit the number of individual features rendered for a client request. For example, if you have a large roads layer, with hundreds of thousands of individual line segment features, the server will stop rendering the map when it reaches the number of features specified in this setting. If a client zooms out sufficiently far when viewing the service, not all of the road features will appear on the map. This setting can be useful in preventing the server from getting overloaded by a client request that inadervtently calls for the rendering of so many features that the server maxes out its CPU capacity trying to draw everything. Setting this number low protects the server from becoming overwhelmed and slowing down any other requests, but does so at the expense of all features being displayed on a requested map.
Similarly, the Maximum Image size settings put a limit on the size of the map image the server will generate for a client request. If a client with a very high resolution monitor and large pixel dimensions, a map image of that very large size will be requested of the server; the larger the image, the longer it takes the server to process the request and the more resources (CPU, RAM, etc.) will be utilized. Capping image size at a certain pixel range will guard against excessively large images being requested and bogging down the server.
- Under Pooling, your service is probably set to utilize a Shared Instance Pool. Check out this documentation page to learn about Pooling and service instances [122]. Basically, each client request for a service is processed by a service instance on the server. By default, ArcGIS Server creates a set of shared instances that can process a request for any service that is configured to use the shared pool. These instances can be seen on your server using the Windows Task Manager. When connected to your EC2 instance via Remote Desktop, open the Task Manager by right-clicking the task bar along the bottom of the screen and choosing Task Manager. Activate the Processes tab, and expand the ArcGISServer EXE background process.
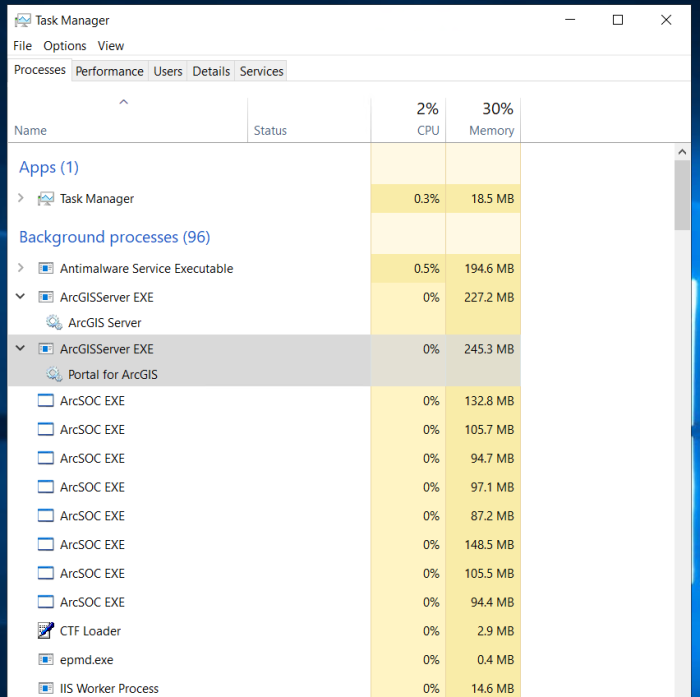
Each of the ArcSOC EXE items you see listed represents one service instance. Some are part of the default pool of shared instances, and others are dedicated to a specific map service. Let's configure a service to utilize its own dedicated instance(s) and see how it appears in Task Manager. First, count the number of ArcSOC EXE processes you see in Task Manager. Next, back on the ArcGIS Server Manager site, change a service's Instance Type setting to Dedicated Instance Pool. After doing this, you will be able to specify the maximum and minimum number of instances for the service. Set the minimum to 5 and the maximum to 10. Return to the Task Manager on your EC2 machine and you should see several more ArcSOC EXE processes listed. Initially, you'll probably see 5 new ArcSOC processes. Your server can now process 5 concurrent client requests for this service in parallel. If, say, there is a time when there are 8 concurrent client requests for this service, ArcGIS Server will spin up three more ArcSOC processes to handle the requests. This can continue up to the maximum number of processes you allow (in our case 10). Beyond that, concurrent requests in excess of 10 will need to wait until prior requests are processed before being addressed. There are tradeoffs of changing these settings and there's no configuration that is ideal for every scenario. It depends on how many client requests you expect services to receive, how long it takes requests to be processed, and how much CPU and RAM resources your server machine has when deciding how to configure things. In any case, you can see some of the options you have for tuning your particular server environment.
For this week's assignment:- Take a couple screen grabs of your Task Manager and ArcGIS Server Manager before and after changing a service's instance type settings and include them in your assignment submission.
- Also, write a paragraph that describes a scenario in which you might configure services with different pooling options and what the ramifications of those setting might be.
Under the Site tab in the ArcGIS Server Manager, you'll see a few sub-sections that contain many of the properties of your Server's configuration. Among these are:
- Directories: paths to the folder locations on your server where various files are stored.
- Machines: a list of all of the physical or virtual machines in your architecture. In this class, we have only set up a single machine, but you may have an architecture that includes several machines that help distribute heavy loads from clients.
- Data Stores: a list of all the folder and database locations where the data behind your map services are stored. You should see the Data folder and Geodata database we set up in an earlier lesson. You'll also see the default Data Store locations for relational (raster and vector) and tile cache data.
Another useful page on this site is the Software Authorization sub-section. Click that heading and you'll see the licensing information for you installation. This can be useful when determining when you need to renew licenses or remember which extensions you have access to.
- For this week's assignment:
- Take a screen grab of your Server Authorization page.
Finally, click on the Logs tab of the ArcGIS Server Manager site.
The View Logs sub-section is a place you can go to view error logs generated by your ArcGIS Server. This can be a very useful place to look when services aren't working properly. You can change the level of log detail to view by changing the Log Filter dropdown; the Debug option will show you the most information. You can also change the way logs are generated and stored on your server by clicking the Settings button. The Debug option will result in the most comprehensive log files, which you can filter any way you'd like when viewing, but it's not recommended to leave your logs configured to Debug for very long because the log files stored on your server will get very large and take up a lot of space. But when troubleshooting a problem it's good practice to set the log setting to Degub temporarily to investigate the problem and to then revert it back to Warning or Severe afterwards to save space.
The Statistics sub-section is a very useful resource for monitoring the client usage of your server. You will see graphs of a few default reports on the statistics page that you can click and interact with. Click on the Total Requests for the Last 7 Days graph. You will see all of the services running on your server listed along the left. You can toggle the visibility of them individually to see their usage on the graph. You also have the option to specify the timeframe of the statistics report. Often, when running your own ArcGIS Server installation you will want to understand how your services are being utilized by clients, or you may need to generate numbers for other people in your organization to demonstrate the value of the services you provide. These dynamic graphs are a useful tool, and you may export the data as a .csv spreadsheet and extract information using a tool like Excel. Back on the main Statistics page, you can click the New Report button to create a custom view and save it as a thumbnail. You might create a custom report of a handful of your services and a relevant timeframe for your organization, maybe the last month, and export a report regularly to monitor usage over time.
You can also generate reports using a custom toolbox in ArcGIS Pro. This can be useful if you need to create a report that the web-based interface won't support. For example, the Statistics page in the ArcGIS Server Manager will only list a limited number of services in the toggle list. If you need to generate a report of more services, you'll need to run a custom tool in ArcGIS Pro to create and save the report. Below, we will see where custom reports are stored in the adminstrative section of ArcGIS Server.
- For this week's assignment:
- Create a new report, save it to your Statistics page, and take a screengrab of the Statistics page showing thumbnails of the default reports and your new custom one.
Open a new browser tab and visit the ArcGIS Server Administrator Directory (baxtergeog865####.e-education.psu.edu/server/admin). Log in with your siteadmin credentials. I don't recommend making any changes here, but feel free to explore the various sections to see the types of information that's available.
From the root page, click on the usagereports link. You will see a list of some default reports; if you create custom reports using ArcGIS Pro, they will appear on this page. You have the option to export the data from any of these to an .html, .json, or .csv file.
Back on the root page, click on the System link. From here you can view the licensing information of your installation, web adaptor configurations, and the directories where logs, tile caches, and other files are stored, among other things. Click on the webadaptors link. You will probably only see one web adaptor, with a long alpha-numeric name, listed. Click on the web adaptor name and you'll see that it specifies the name of the machine, its IP address, and the port (80 or 443) that it uses. In a production setting, the web adaptor will specify the fully-qualified domain name (e.g., baxtergeog865####.e-education.psu.edu) of your server and its public IP address (your Elastic IP). Recall that the web adaptors link our ArcGIS sites with the machine's web server, which in our case is IIS (Internet Information Services). There will be a separate web adaptor configured for the server and portal portions of your site. In the cloud formation template, we specified a name for our server site ("server") and our portal site ("portal"). The cloud formation template didn't do that for us here (although our sites still work), but in a production setting, you will have web adaptors listed here that link both the server and portal urls to your installation.
Finally, let's open our web server to see that both the server and portal folders have been created for us. From the desktop of your EC2 instance, click the Start button and type IIS. Click on Internet Information Services Manager when it appears in the list. Expand your server to view the contents of the Default Web Site. You should see two virtual directories listed: server and portal.

Virtual directories link a url folder name to a physical folder location on our server. The urls for these two directories take the form:
- https://baxtergeog865####.e-education.psu.edu/server
- https://baxtergeog865####.e-education.psu.edu/portal
Enter each of these in a new browser window and you will see that they take you to your server and portal sites. Back in IIS, right-click on either the portal or server virtual directory, choose Manage Application, and click Advanced Settings. You will see a path on your server's C: drive that contains the web content for each site. You can use Windows Explorer to browse to those folders and see their contents. In summary, the web adaptors link the two urls above to the virtual directories in the web server. When installing ArcGIS Enterprise in a production setting or using tools other than cloud formation, there is a post-install setup procedure to get this all configured. Esri provides documentation [123] detailing how that process works. Not something we want to mess with here, but something you'll need to do when configuring ArcGIS Enterprise in your production environment.
Assignment: Administrative Tasks
For this week's assignment, please create a single document containing all of the following:
- Screen grabs of Task Manager.
- A screen grab of the Server Authorization page.
- A screen grab of the Statistics page showing your custom report.
- A paragraph discussing the implications of different service pooling configurations.
Cloud Computing Discussion: The future of cloud computing and cloud GIS
For this week’s discussion, we will think together about the future of cloud computing, and by extension, of cloud GIS. Please read The Cloud as a Tectonic Shift in IT: The Irrelevance of Infrastructure as a Service [124]. This blog post by the CTO of CloudBees contains some interesting predictions about the future of IaaS, PaaS, and SaaS.
If you have the optional textbook, you can supplement this with the chapter titled “Cloud 9: The future of the cloud.”
Please pick one of the predictions from the article or book chapter that you find interesting, and write about why you found it interesting. For example, you could find one of the predictions thought-provoking, or you might disagree with the authors. Also, please make your own prediction about how the advent of cloud computing will effect GIS. One way to approach this would be to extend the prediction you reacted to into GIS. Then, respond to one of your classmate's predictions.
Deliverables for this week's technology trend:
- Post a comment in the Canvas L09: Discussion addressing one of the predictions from the book chapter or article for this week. Also, please write your own prediction on where cloud GIS is headed.
- Then I'd like you to respond to one of your colleagues' predictions.
- Brownie points for linking to other technology demos, pictures, blog posts, etc., that you've found to enrich your posts so that we may all benefit.
Lesson 10: Term project
Overview
This is the final week for our course in Cloud and Server GIS. There is no new content from me this week, instead, you will spend the week working on your term projects and producing a written report and video demonstration.
Lesson Objectives
At the successful completion of this lesson, you should be able to:
- complete a comprehensive project addressing a real challenge or problem using cloud and server GIS technologies; and
- share findings from the project using visual and written communication.
Deliverables
- Submit: L10: Final Project Video Demonstration
- Submit: L10: Final Term Project Report
- Complete: SEEQ Student Evaluation
Term project video instructions
As part of your term project, you're required to submit a video demonstration that you record using screen capturing software such as Zoom, Screencastomatic, Adobe Captivate, etc.
Please review the Term Project Rubric [105] to get an idea of what elements are required in the video.
Please attempt to host this online somewhere in a location such as a Box folder, blog, or website so that the instructor can view it using a simple URL. If all else fails, you can send the instructor a compiled .mp4 or other similar video file compatible with common media playing software.
If you are really happy with your video, I encourage you to make it public on YouTube or a similar video sharing site. A demonstration of what you can do with cloud and server GIS can be an excellent part of your portfolio. One of its advantages is that it remains accessible even when the server instance is not.
If you have questions about how to make videos, please post them on the Technical Discussion Forum in Canvas.
Work on term project and submit this week
This week is dedicated to working on the term project. When you have finished, please post your writeup to the appropriate drop box on Canvas. Your writeup should contain a hyperlink to your video demonstration. If that is not possible, you can make a separate upload of a video file onto your term project submission. Canvas allows for multiple uploaded files.
The writeup should be about 500 - 1000 words. If it is any shorter, you'll have trouble covering all the required elements in enough depth.
Please review the Term Project Rubric [105] to understand what is required, and post to the forum or use email if you need any clarification.