Cost Control and Earned Value Management
Cost control includes monitoring cost, task completion, and time. If the total cost of a project at a given time is over the cost baseline, cost control measures may be necessary. Such project management actions may range from ensuring that only tasks within the scope of the work are being performed to alerting stakeholders of potential cost overruns. As a project manager, it is important, professional, and ethical to identify and report on these issues as soon as they are identified. Effective techniques exist to help you in this matter.
Earned value management (EVM) is an effective technique for tracking costs and examining project expenditures relative to completed work. Its strength is that it looks at cost, time, and task completion within the scope of the project simultaneously. It uses a WBS and budget created during the development stage, but tracks these metrics during the implementation stage of a project life cycle. The basic measures in EVM are explained in Figure 6-1.
Click for a text description of Figure 6-1: Earned Value Management Measures
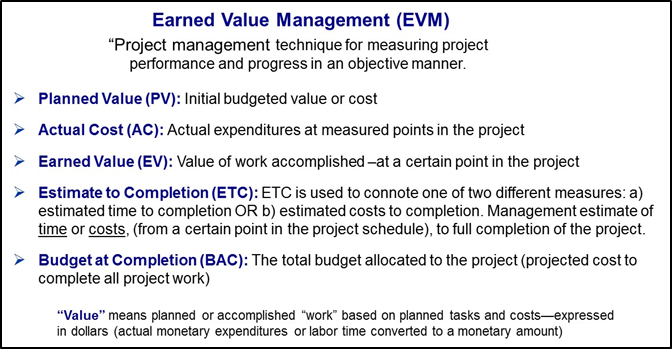
This figure is mainly text and explains Earned Value Management concepts. The title, centered at the top with a centered text, reads, “Earned Value Management (EVA)”. Below this title line is a text explanation below the title with the text, “Project management technique for measuring project performance and progress in an objective manner”. Bullet points below this text lists the following five left justified bullet points defining key EVA terms:
- Planned Value (PV): Initial budgeted value or cost
- Actual Cost (AC): Actual expenditures at measured points in the project
- Earned Value (EV): Value of work accomplished –at a certain point in the project
- Estimate to Completion (ETC): ETC is used to connote one of two different measures: a) estimated time to completion OR b) estimated costs to completion. Management estimate of time or costs, (from a certain point in the project schedule), to full completion of the project.
- Budget at Completion (BAC): The total budget allocated to the project (projected cost to complete all project work)
A definition of “Value” is shown at the bottom. Value means planned or accomplished “work” based on planned tasks and costs—expressed in dollars (actual monetary expenditures or labor time converted to a monetary amount)
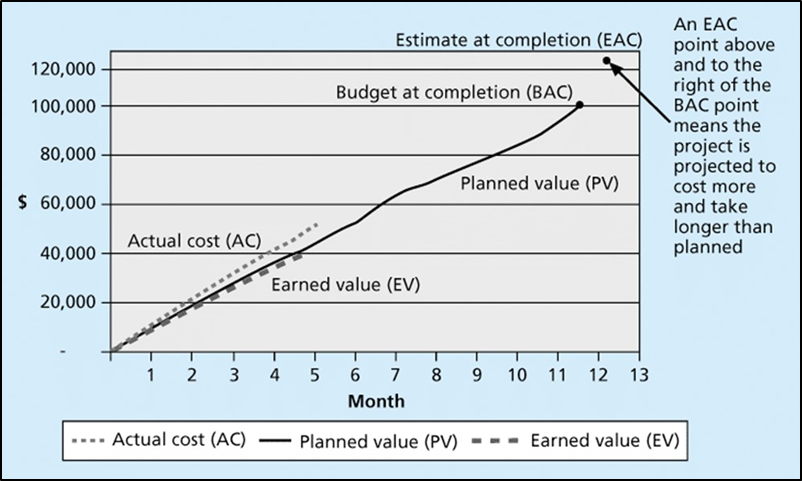
EVM uses tables and charts, such as is shown in Figure 6-2, below. The y-axis of the chart represents cost and the x-axis represents time. The planned value throughout the project can be plotted from values of cost and time contained in the project plan's WBS. In other words, if you plan to complete Tasks 1, 2, and 3 by the end of Week 4, the planned value at that time is the budgeted cost associated with these tasks. As the team implements the project, the actual cost can also be graphed. At any given time during the project, the actual cost is the total of direct and indirect costs incurred to complete tasks. If Tasks 1, 2, and 3 take more time or resources to complete than planned for, the actual cost will exceed the planned value, which, of course, is not good. On the chart, the actual cost line will begin to track above the planned value line.
Click for a text description of Figure 6-2: Earned Value Management (EVM) Concepts
Another way to express this is that the value your team has earned is below the value that you as project manager planned. If Tasks 1, 2, and 3 are 90% complete after four weeks, you have earned 90% of the value you planned to earn. Earned value--the value of the tasks completed, can also be graphed on the same chart. In this bad news example, the earned value line would track beneath the planned value line. Because multiple tasks may be occurring simultaneously within a given project, it is necessary to track actual cost and earned value for all tasks to accurately access the earned value of the project.
Earned value and actual cost give different but complementary snapshots of how a project is going. For example, say your organization takes on a project that requires twice the resources planned for. Earned value could still track planned value if twice as many person-hours are assigned to the project. Actual cost, however, would be twice as high as planned value. Alternatively, the planned person-hour resources could be assigned to the project. In this case, actual cost would track planned value, but earned value would only be half of planned value.
Once a project goes awry, it is difficult to get actual cost or earned value back on the planned value baseline. Usually, the best that can be accomplished is that EV and AC will cease diverging from PV. By making necessary adjustments in resource allocation and scope, a project manager can lower actual costs from a specific project point to minimize the difference between the planned value (PV) and actual cost (AC).
EVM is important in that it synthesizes the planning, executing, and controlling process groups of project management. EVM is impossible without a project plan with a detailed WBS and budget. EVM also requires regular tracking during the implementation phase of the project life cycle. It can identify problems or issues early, when intervention or clarification from the project manager can be most useful to team members. It can be an aid to project managers required to file status reports. It is an important control management tool that a project manager has at her disposal during the critical part of the project life cycle when work is being completed.
A summary of important EVM project performance measures is provided in Table 6-1 below.
| Performance Measure | Formula | Description |
|---|---|---|
| Schedule Variance (SV) | EV-AC | Indicates the difference between the budgeted cost and the actual value of work completed at a given point in the project. A positive number indicates that project expenditures are less than expected. |
| Cost Variance (CV) | PV-AC | Indicates the difference between the budgeted cost and the actual cost at a point in the project. A positive number indicates that project expenditures are less than expected. Note: This performance measure does not necessarily indicate a project that is under budget or over budget, just the financial status relative to the project's schedule. A CPI or SV greater than "1" would indicate an under-budget project. |
| Cost Performance Index (CPI) | EV/AC | Compares expenditures to actual value at a point in the project. Values greater than 1 indicate a positive situation in a project with expenditures below budgeted amounts (under budget). |
| Schedule Performance Index (SPI) | EV/PV | Compares the expected value, planned work, and project results at a point in the project to the actual value of work achieved. Actual value at a point in the project. Values greater than 1 indicate a positive situation in a project, with the volume of work (productivity) exceeding the plan. |