LESSONS
Module 1: Science!
Welcome to Module 1
Welcome to Module 1
Before we get started, did you complete the Course Orientation?
“... when people thought the Earth was flat, they were wrong. When people thought the Earth was spherical they were wrong. But if you think that thinking the Earth is spherical is just as wrong as thinking the Earth is flat, then your view is wronger than both of them put together..”
Note: The Earth is almost but not quite spherical because it bulges a little around the equator in response to the planet’s rotation, and it has mountains and other bumps, but the Earth is still much closer to being spherical than to being flat!
Science!
We will explore geology (broadly, the study of the Earth), and some related issues (evolution, biodiversity, climate, and energy). But first, we will take a quick look at science. What is it? Why do we pay for it? Why do it? Why do most of us trust it? What do we learn from it? Why bother? Most of you have been forced to sit through some version of this about ten times in elementary and high school, so we’ll try to give it a slightly different twist here and make it worthwhile. (Plus, we promised Penn State we would do this when they approved the course, so you need to do it to get a good grade.)
Module 1 will introduce you very briefly, to science, and then to the field of geology, giving you an overview of what it's about, why it's important, and how it benefits people. And finally, Module 1 is our entry point to the magnificent environmental legacy that is our National Parks—a system of parks and monuments designed for us to enjoy today, and to preserve for the future, society's very best geological, biological, cultural, and historical records, and artifacts.
Learning Objectives
- Explain how science works, including how useful it is and its limitations.
- Understand that National Parks must preserve important features for future generations while allowing people to learn from these features and enjoy them today.
- Recognize the many contributions that geologists make, helping us find valuable things, avoid hazards, get along with the Earth better, and enjoy what we learn.
- Understand a few basic science results that many of you learned in middle school but some of you may need because your schools didn't teach them, so you are ready to understand our fascinating journey through the parks.
What to do for Module 1?
You will have one week to complete Module 1. See the Canvas Course Calendar for specific due dates.
- Take the RockOn #1 Quiz.
- Take the StudentsSpeak #2 Survey.
- Begin Exercise #1.
So, What is Science?
Science is the most successful way humans have ever developed to learn how things work and to use that knowledge to do things we want to do and predict things we want to predict.
Science is not a magic path to the ultimate truth. Instead, science is humans keeping track of what works and what doesn't and trying not to fool ourselves, in the process. The “scientific method” is common sense, dressed up with fancy words and expensive machines. Science doesn't tell us what we should do or why we're here, but if we use science efficiently, it makes us healthier, wealthier, and more comfortable while we figure out those big issues.
Questions?
If you have any questions, send an email via Canvas, to ALL the Teachers and TAs. To do this, add each teacher individually in the “To” line of your email. By adding all the teachers, the TAs will be included. Failure to email ALL the teachers may result in a delayed or missed response. For detailed directions on how to do this, see How to send an email in GEOSC 10 in the Important Information module.
This course is offered as part of the Repository of Open and Affordable Materials at Penn State. You are welcome to use and reuse materials that appear on this site (other than those copyrighted by others) subject to the licensing agreement linked to the bottom of this and every page. Students registered for this Penn State course gain access to assignments and instructor feedback and earn academic credit. Information about registering for this course is available from the Office of the University Registrar.
Main Topics: Module 1
Main Topics: Module 1
Overview of the main topics you will encounter in Module 1
Science
- Science is a human activity—it isn’t Truth, but it works.
- Science is the best way to answer many questions (How does something work? How can we use that information to help ourselves, by curing disease or finding clean water or in other ways?).
- Science cannot answer many questions we care about (What should we do? Why are we here?), but it gives us important background information.
Scientific Method
- Get a new idea (hypothesis) from somewhere (genius?).
- See if the new idea beats old ideas in predicting what will happen (experiment).
- If yes (after many tests), use the new idea; if no, we still use the old one.
- Repeat—there’s always more to learn.
- Ideas that work better might be True, Close, or Lucky, so science is never sure.
- Science can prove ideas wrong, but cannot prove them correct.
- But, if we act as if science finds truth, we succeed in doing many things...If we follow the scientific method.
Why National Parks?
- National Parks were a U.S. idea; Yellowstone was the first (1870).
- Take a quick visit to Yellowstone, and imagine what we would have lost if it had been developed as a power plant or a shopping mall.
- Problem: parks are for both “conservation unimpaired for future generations” and “enjoyment” for this generation.
- Doing both is not always easy.
Why Geology?
- Find valuable things (oil, water, ores, gems).
- Avoid hazards (earthquakes, volcanoes, landslides).
- Learn how Earth works to keep it and us happy and healthy.
- Have fun (Why are the parks so pretty? What were dinosaurs like?).
Some Geological Background
- We WILL cover the evidence for all of this during the semester, but we must start somewhere.
- Earth is 4.6 billion years old and formed from pieces that fell together from space under gravity.
- Earth heated as it formed (natural radioactivity, and the heat from stopping those falling pieces—think of the hot-brake smell after stopping a truck on a steep hill).
- This heating melted Earth and allowed it to separate into layers (think of a car-bottom clump on a snowy day—ice, rocks, and dead-squirrel parts are all lumped together but separate when they melt in the garage).
- The layers include the iron-rich core, the iron-silica mantle, and the more-silica/less-iron crust. Refer to the Chemistry Sidebar in this module if this seems unfamiliar.
Science, Geology, and National Parks
Science, Geology, and National Parks
Your Geosc 10 instructional team loves Science, Geology, and National Parks. We hope you do, too, and if not, we'll try to show you why we do. These “big-picture” issues are probably more important than anything we cover in this class.
Humans have always had a love-hate relationship with our “tools.” Cars are great, but getting run over by one isn’t. Television is great until you want to have a heart-to-heart discussion with someone deeply engrossed in a playoff game. Science collects the wisdom of the world’s peoples, experiences, and insights, then tests that wisdom repeatedly, revising and improving, to help us learn to understand and to do things we want. This may be humanity's greatest tool... but that also means that occasionally someone may not like it.
Sometimes, a person becomes unhappy when their idea loses to a better one. In the early 1600s, when Galileo advocated the idea that the Earth orbits the sun, Pope Urban VIII saw conflict with certain verses in the Bible (e.g., Psalm 93, “The world will surely stand in place, never to be moved”, or Psalm 104, “You fixed the earth on its foundation, never to be moved”; both quoted here from the New American Bible, although Urban VIII would have read them in Latin.) Some religious authorities of the time did not see any conflict between these verses and Galileo’s ideas, and the Pope had initially been at least somewhat open to Galileo’s ideas. However, the Pope eventually turned Galileo over to the Inquisition due to this supposed heresy, and the Inquisition forced Galileo to recant, sentenced him to house arrest, and banned his book and future publications. Fortunately for Galileo, the Inquisition did not have him tortured and executed. (It is an interesting question whether the problem was Galileo’s sun-centered view, or whether the Pope got mad because Galileo's book featured a dialogue in which the Pope's favored views were spoken by the "loser.")
The papacy subsequently decided that the reality of the Earth orbiting the sun did not undermine scripture, and astronomers could do their job while the religious leaders did theirs. Indeed, important scientific discussions have been hosted by subsequent popes.
It remains that sometimes conflict arises between some members of some religious or other groups and some aspects of science. In 2005, for example, the state school board in Kansas changed their definition of science, apparently to enable teaching in science classes of ideas that repeatedly have been rejected as being nonscientific by courts and scientific organizations. After a 2007 election that changed the membership of the school board, the board restored its definition that science is a search for natural explanations for what we observe in the world around us. We will have a chance to discuss these ideas later in the course because Kansas and other states have continued to fight over the issues. Such discussions have been ongoing for centuries and we can be confident that they will continue far into the future. Environmental and public health issues often face similar disagreements.
So, let’s look a bit more carefully at what science is, and isn’t.
Why Science?
Why Science?
One important reason for science is clear—tightly coupled to engineering and technology, science works. The products of scientists and engineers are tested in the real world every day. Oil companies hire new geologists, geophysicists, and petroleum engineers when the old ones retire because those scientists and engineers do find oil and make money for the oil companies. Congress funds biomedical research because it keeps lengthening our lives and curing diseases. You read this on a computer or phone, which was designed using the principles of quantum mechanics and the remarkable discoveries of materials scientists and engineers.
High school teachers like to expound on the scientific method. Scientists do have a method of sorts, and it helps them achieve their results. But lots of people—astrologers, palm readers, telephone “psychics”—have methods that don’t get funded by industry and Congress. The typical industrial officer is likely to be more interested in the results of science than in the details of how those results were achieved.
Across campus, scientists are sometimes viewed as just another group for sociologists to study. Scientists have their tribes and other social interactions. Scientists occasionally seek fame and fortune, lie, and steal in much the same way that other humans do. The extremists in sociology have gone so far as to argue that science is only a social construct, one of many possible ones. This, however, is the kind of intellectual exercise that gets a few academics in trouble with the real world. Anyone with a little common sense knows that it is possible to have a cruise missile deliver a small exploding device to a selected building in another continent using some clever applications of Newtonian physics and that no other human social construct can make a similar claim. Mere social constructs do not design new antibiotics that save millions of lives, either. (If you’re still not convinced, or you just want to know how Einstein is in your pocket, you might watch this short Geomation on do-it-yourself cell phone kits.)
Video: GPS in Phone (5:40)
This is a true story. Many years ago I had been resisting getting a newfangled cell phone I was scheduled to give a talk in Baltimore. There was a bit of snow but I just drove the 170 miles down from University Park. If you saw the 1964 nuclear war film Fail-Safe with Henry Fonda as the president, nuclear bombers were dispatched and they couldn't be recalled. That was me. They called my wife Cindy at home about 20 minutes after I left and said it was too dangerous to drive. She couldn't call me, so I drove the whole way down. I arrived, I found the venue locked. I called Cindy and she said, "You are getting a cell phone.", which I did.
What is a cell phone, really? It's just some sand for the glass, and the Silicon that goes in the computer chip, some oil or other organic material for the plastic, and the right rocks, the ones with the palladium and the rare Earth elements, and other things. Plus science and engineering and design and marketing. There's a computer chip. It's based on the transistor that was invented by Bell Labs. That was a private industry with a government-granted monopoly and Air Force money to develop it. It was designed with quantum mechanics from professors such as Bohr and Feynman, who taught at universities. It connects to the internet. When I first logged onto the internet it was the Arpanet, with Department of Defense funding to UCLA, Stanford, and Wisconsin, to improve communications among researchers for national security reasons.
When Cindy first got her GPS, the voice was a guy with a great Australian accent. My phone has a friendly-sounding lady in it. So here is a very light-hearted look at how the GPS works. And, if you're bored, you can think about how to redo this for the Australian guy. But for my phone.
Singing: There's a lady in my phone, so I never drive alone. She tells me where to go, so we get home, that nice lady in my phone. She relies on GPS, so we never get into a mess. It tells her where we are without a guess, as she relies on GPS. She listens to each satellite that she can get into her sight. They tell their time and place for day and night, as she listens to each satellite. Distance from each is time times rate, so she can triangulate, four-time differences give our place, and that works great. Distance from each is time times rate.
When I first met GPS my advisor, the late great Ian Whillans at Ohio State, was using it to survey the motion of Antarctic Ice streams. He had to bring the data home from Antarctica and post-process because the military was dithering them. It was called selective availability. GPS started as a U.S. military program, and then, precise positioning was a secret for national security reasons.
Singing: But there is complexity, space-time is warped by gravity. To get it right she needs relativity. For there is complexity. Einstein got that figured out. His equations work without a doubt. We're never lost when Albert is about, for EInstein got it figured out.
Special relativity and general relativity are required because the satellites move faster and are farther from Earth's gravity than clocks on Earth. It's about a 10-kilometer, six-mile, correction per day, or enough to degrade the accuracy of the phone in about two minutes. Without relativity, we'd start to get lost in two minutes. And fortunately, Einstein helps the nice lady or the Australian guy in my phone. Back in the dark ages of my youth, I suspect most people would have said that quantum mechanics and relativity are the most esoteric and useless of sciences. So now they're in our pockets and modern life as we know it would not be possible, without the technologies they enable. They come from public-private partnerships, building on university research, and based on the fact that science really works.
Science differs from other human endeavors in that its disputes are appealed to nature. With Art, you cannot judge whether Picasso or Rembrandt was a “better” painter. You can study the brushwork, perspective, social context, or whatever else, and learn about art from the discussion. However, you cannot reach an objective decision regarding who was the better painter. But, if asked whether Aristotle’s or Newton’s physics works better, we can answer the question with extraordinarily high confidence.
This is where the scientific method comes in. We study Aristotle’s ideas and Newton’s ideas until we figure out some way that they differ. This allows us to propose an experiment: if we do experiment A, Aristotle expects B to happen, and Newton expects C. Then, we do A and see what happens. If it comes out C, Aristotle is wrong. In reality, one test is never definitive—the fans of Aristotle might claim that the experiments were rigged, or the experimenters didn't really understand Aristotle's ideas and so did the wrong test, or that statistically there is still a slight chance that Aristotle is right. But after many tests, the answer becomes obvious. Science has then progressed—we’ve gotten rid of something that was wrong.

Science remains an exercise in uncertainty, though. If Newton “beats” Aristotle, that means Aristotle is wrong, but it does not mean that Newton is right—maybe he’s just lucky, or pretty close, but not quite right. As it turns out, Newton’s ideas fail for things that are really small, really large, or moving really fast, and we must turn to quantum mechanics and relativity. (But all that fancy physics reduces almost exactly to Newton’s description for things of size and speed that we usually deal with—bigger than atoms, smaller than galaxies, and much slower than the speed of light—so, Newton was and is fantastically useful. Our buildings and airplanes were designed using only Newtonian physics—quantum mechanics is not important for football stadiums or massive jets—although they were designed on computers that were designed using quantum mechanics.) Science thus cannot give the ultimate answers to anything because we are never sure whether we are right, close, or lucky. We can only say that, if we act as if the scientific results are true, we succeed (in curing diseases, finding oil, making cell phones that work, etc.).
Science is an expensive way of learning about the world. Suppose you are a farmer, and you are trying to feed yourself. You try an idea (say, burying fish heads with your corn seeds, or planting during the dark of the moon), and the corn grows well. So, you do that every year. If it works, great. If it does not work but does not hurt, it is no big problem. If it makes things worse, you might starve, but few others are bothered.
Now, suppose you are a modern farmer trying to feed 100 people. If you try something that makes things worse, many people may starve, and some may get mad at you before they do. So, you start asking whether the fish head works, and whether two fish heads would work better, or whether other parts of the fish would be better, and then you get serious and ask what is it in the fish head that works and how can you get a lot of that without killing fish, and so on. One test does not do it—crops grow well much of the time, so most things you test (such as planting in the dark of the moon) will seem to work even if they do not help.
The modern solution is to have a scientist helping the farmer, trying things carefully, and trying them many, many times, figuring out which ones work better, and communicating those results to others who are interested. All that testing takes a lot of effort, but it is cheaper in the long run for important things. Rather than 100 people each trying to feed themselves, and some failing and starving, we have a scientist, a farmer, a tractor manufacturer, a trucker, and a grocer feed all one hundred, freeing 95 to do something else. (Enjoy! You probably don’t have to spend the summer hoeing corn to keep from starving over the winter.) So, although science is expensive, for important things it is cheaper than ignorance. For unimportant things, living with a little more uncertainty may be easier.
Science has been wildly successful on simple questions: If I drop a rock, how fast will it fall? If I put a lot of a certain isotope of uranium in a small area, what will happen? If I use steel beams this big, in this pattern, how heavy a truck can drive over the bridge without breaking it? Most of physics, much of chemistry, and some of medicine fall in this “simple question” part of the world. For a little more discussion on the uses of science, see this short video on Silly Putty.
Video: Silly Putty (1:40)
This is Silly Putty. You get it by mixing silicone oil and boric acid. It may not be the greatest triumph in the history of science, but it's fun! Occupational therapists have used silly putty for exercises for people recovering from hand injuries. NASA used it to stick down tools so they wouldn't float away in zero gravity. Scientists have mixed silly putty with graphene and made sensors that are so sensitive that they can measure the footfall of a spider. Look around you at all the applications of science through engineering, design, and marketing. The medicines and computers and phones and televisions and microwave ovens, like that one. The physics of how radiation interacts with water to heat a pizza in a microwave oven has a little bit to do with the physics that the Air Force uses to design sensors on heat-seeking missiles so that carbon dioxide doesn't block the view of the enemy bomber that you're trying to shoot down. And those physics are the same ones that climate scientists use when they're calculating how much warming we will get from the CO2 we release from fossil fuel burning. Science works. Science helps us. And science can be fun.
Science is gaining ground on some harder questions. Predicting weather or earthquakes, understanding and curing cancer, understanding and managing ecosystems and biodiversity—these are more complex, involve more interactions, and may have limits on predictability (chaos), but real, useful progress has been made, and improvement continues. The research frontiers often lie in these complex systems. Much of geology lies in complex systems, and we are in the midst of some great advances in geology.
Science has a long way to go on really tough questions, such as predicting how various actions will impact the working of society and the health and happiness of people. And, science cannot address many questions — “How should society work?” is a value judgment, not a question of reality, and is not part of science, although science is central in the discussion.
Science is restricted to the search for natural explanations of the world around us. This does not mean that science opposes religion or claims that there is no God. (Some scientists may do such things, but many other scientists do not.) Quite simply, no experimenter knows how to guarantee the cooperation of an omnipotent deity. A miracle, by definition, cannot be repeated reliably by anyone in any lab anywhere in the world, and so must fall outside of science.
In short, science is a human social activity but differs from other human social activities in that the ideas of science must be tested against reality. Science enjoys a special place in society because science is so successful. Science shows which ideas are wrong and identifies ideas scientists cannot disprove. If we act as if these not-yet-disproven ideas are true, we are successful in doing things. These not-yet-disproven ideas remain conditional because we might find better ideas in the future. Science keeps track of what works and what does not, to save future workers trouble. Science is a meritocracy—good ideas tend to rise to the top, no matter who originated those ideas. (This may take a while because scientists are human with human failings, and scientists certainly have a history of dismissing some ideas because they came from the wrong people, but the triumph of merit is more likely and faster in science than in most human activities.) Science tests the structure of knowledge continually—a good scientist does not tiptoe around the tower of knowledge put up by earlier scientists but tries to tear that tower down. Only those ideas sturdy enough to survive such attacks are saved, so the scientific edifice is exceptionally sturdy.
Why National Parks?
Why National Parks?
Societies have tried many ways to deal with private versus group ownership. Private ownership often raises ethical questions—did you come by that piece of land fairly? Can you claim for your king some land that was already occupied by other peoples? Do other species have land rights? Public ownership often raises the “tragedy of the commons”—if I can sneak a few more of my sheep onto the public green, I’ll gain in the short term, even if, in the long term, we all lose because the extra sheep kill the grass.
The U.S. tradition has focused on private ownership, but we have also recognized the benefits of public ownership. The idea of a National Park—taking the choice pieces of the country and placing them under public control—is a U.S. idea, developed by the Washburn expedition to Yellowstone in 1870 and eventually enacted by Congress in 1872.
Since then, the idea of national parks has spread across the nation and worldwide. This is surely one of the great ideas of the modern world, to save key scenic environments in the public domain.
However, the national parks of the United States, and the world, face a grave dilemma. The act establishing Yellowstone and the concept of national parks specified “conservation... unimpaired for...future generations” and “to provide for the enjoyment” of the parks. Saving a wild region for the future while having it enjoyed by millions of visitors each year is perhaps the largest of many difficulties facing the parks today.
Most of the national parks were founded to preserve geologic features—the geysers of Yellowstone, Crater Lake, the Grand Canyon, the Badlands, etc. Many national parks were founded when they were, biologically, small pieces of a vast, unbroken wilderness of similar habitats. Today, the parks are often becoming islands of the natural environment in a sea of human-controlled and human-altered land. Thus, much focus on the parks today involves biodiversity. We will revisit the questions of biodiversity and island biogeography later. (Yes, this is a geology course, but some things are too important to pass up just because they belong in a different department.)
What is Geology?
What is Geology?
Geology, broadly, is the study of the Earth. Geologists and friends—geophysicists, geochemists, geobiologists—study the rocks that make up the Earth, the history of the Earth as recorded in those rocks, and the processes that change those rocks. This includes oil and ores, landslides and volcanoes, dinosaurs, meteorites, and much more. Most geologists are involved in one of four areas: i) finding valuable things in the Earth (gold and silver, diamonds, oil, building stone, sand, and gravel, clean water, etc.); ii) warning of geological hazards (volcanic explosions, earthquakes, landslides, groundwater pollution, etc.); iii) building an operators' manual for the Earth (Earth System Science); and iv) informing/entertaining (What killed the dinosaurs? How has the Earth changed over time?). Many geologists do more than one of these, or even all of them, at the same time, and there surely is a lot of overlap.
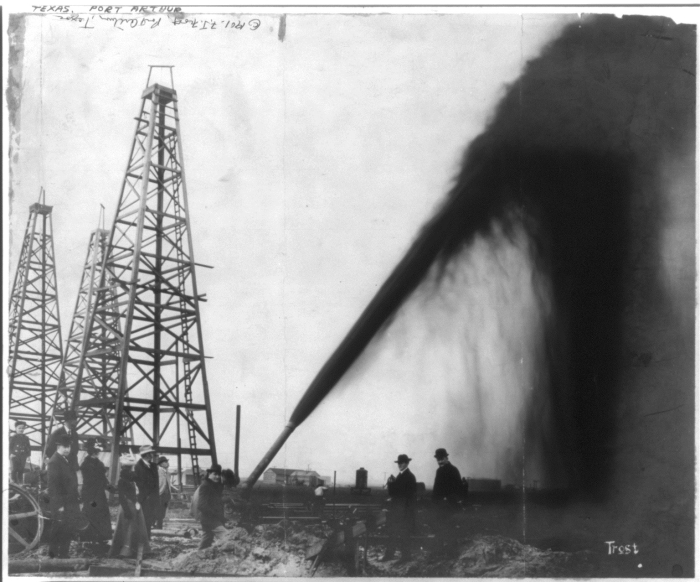
Historically, most geologists have worked at finding valuable things. These geologists have been truly successful, too successful for their own good, in fact. Some of the things we extract from the ground are very cheap today (after you subtract inflation and taxes), so there have been fewer jobs for geologists with companies mining some things than in years gone by. Oil prices have fluctuated a lot over time, with boom-and-bust cycles occurring over and over, but there still are some good jobs in this area. The US used to spend a lot more money on cleaning up groundwater pollution than we have recently, but it turns out that an immense amount of that money was spent on lawyers arguing about paying for cleanup rather than on scientists and engineers cleaning up. A lot of geologists are not happy with this situation and hope that finding and restoring clean water will be more vigorously pursued in the future.
Warning of geological hazards is also a growing field. As more and more humans build houses on floodplains, debris-flow deposits, and other indicators of past disasters, these people become more dependent on someone to tell them if and when the trouble will return. Many geologists favor a different approach—find out where the dangers are, and then don’t build in those places—but real estate developers often don’t listen. (In the spring of 2012, a bill was introduced to the North Carolina legislature—although not passed in its original form—to make it illegal to use the best science to tell coastal people the regions that might be attacked by the sea. This echoed efforts a century before by developers in San Francisco to discredit scientists who correctly argued that the earthquake that had just devastated the city meant that additional earthquakes were possible or even likely. Other such efforts to ignore or downplay large dangers have occurred and continue to occur.)

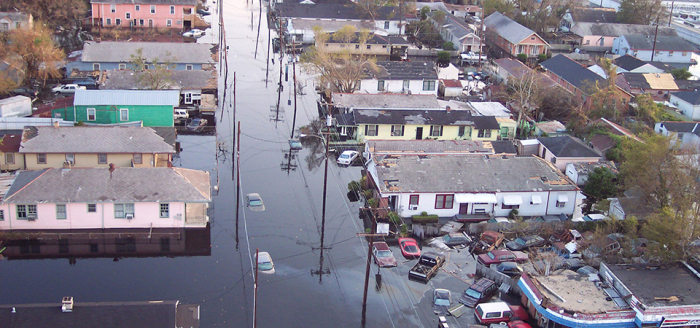
The disaster of Hurricane Katrina in New Orleans and its surroundings in 2005 showed the dangers of building in harm's way. With almost 1400 dead, and over $100 billion in damages (that is $300 for every person in the US!), Hurricane Katrina definitely caught the attention of many people. Interestingly, geologists had known of the impending disaster, and warned of it, for decades, as the city slowly sank beneath river level and sea level. Thousands of Geosciences 10 students had studied this issue in the years before the storm struck (and you will get to look into the issue soon). Fortunately for New Orleans, the storm’s strength had ebbed before it hit the city, or the damage could have been even worse.
The operators’ manual for Earth is a new idea. It may be the most important thing geologists can do for the future of humans. We, humans, are everywhere today — living on every continent, tilling more and more of the land, claiming as our own more and more of the productivity of the planet. We have changed the forests, changed the soils, changed the atmosphere, changed the waters—nowhere on Earth remains free of our imprint. A scientific analysis from the year 2023 found that all the humans on Earth together weigh about 390 megatons, our domestic animals outweigh us at 630 megatons, and we dwarf all the wild mammals on Earth together at only about 60 megatons—add up all the whales and elephants and wildebeest and moose and mice and…, and the number is still small compared to us. Credible estimates indicate that we and our close friends—cows and corn and chickens and house cats and Chihuahuas—are using more than half of everything made available by the planet, leaving less and less for all other species. We are managing to support roughly 5 billion people pretty well (out of the 8-plus billion of us here), with the population projected to reach 9 or 10 billion in a few decades, so we are planning on greatly increasing, perhaps even doubling, the number of people we support well.
Given that we are doing this, and we will continue to do so, many thinkers believe it would be wise to have a better idea of how this works and what we are doing. You would not try to repair a fine watch or a cell phone without knowing how it works—take a few pieces out and you may never get it running well again. We are doing precisely that to the planet, changing a lot of things we do not understand. Earth System Science is the attempt to understand the planet, its water, air, ice, rock, and life, well enough to learn the consequences of our actions so that we can make wise decisions. Earth System Science is still a new science, providing much that is useful but with much more to learn, and many of us believe that it is an incredibly important effort.
And there is always education and entertainment. Some people like to know things, and geologists have some of the most interesting stories to tell. We hope you agree after taking our class!
A Brief Overview of Geology
A Brief Overview of Geology
Throughout the course, we will explore not only what geologists learn, but how we learn it. For the first few Modules, however, we ask you to take our word for some things. You will see statements such as “The Earth is 4.6 billion years old.” Before we’re done, you will also see where that number comes from, how good it is, and much more about it. But we can’t do everything at once.
Anyway, we believe that the universe started in the “Big Bang” about 14 billion years ago. The Earth is “only” about 4.6 billion years old. We live in a second-generation solar system because the planets and the sun contain abundant chemicals such as iron that were first formed during the death of older stars. So, there were some stars, and they exploded and generated gases and dust, and something (another nearby star exploding?) caused that gas and dust cloud to be compressed a little. Once the dust and gas started falling together, gravity took over. Eventually, most of the mass went to form the sun, which was squeezed enough under gravity that the sun’s hydrogen began fusing to form helium, in the process releasing energy—sunlight! Some of the gas and dust collected into planets.
Assembly of the Earth involved the falling together of lots of big and little chunks. The largest chunk was probably about the size of Mars. It hit the Earth after most of the assembly was finished and blasted enough material off the Earth to make the moon. (Note that there is still a little discussion in the scientific literature about the details of this Mars-sized moon-forming collision, so stay tuned...)
The falling-together of pieces makes heat, as the pieces give up their energy as they stop. (If you have ever smelled the burning brakes on a large truck that has had to stop suddenly on a steep hill, you know that stopping gives up heat. Something similar happened to the Earth.) That heat partially or completely melted the planet. The melting allowed the planet to differentiate or become layered. The denser material sank to make a core, mostly of iron with some nickel and a few other elements. The lowest-density material rose to the top to form a silicate scum, or crust, floating on a vast mantle of denser silicate (see the sidebar on chemistry). The Earth is hottest in the middle and coldest on the outside. Heat favors melting, but higher pressure tends to make most liquids turn solid. These two effects compete in the Earth, so you find both solid and liquid down there. Going down in the Earth, the crust and the upper part of the mantle are solid (together forming the lithosphere) except in special places where volcanoes occur; the deeper part of the mantle is solid but soft and has a zone of about 100 km (60 miles) down in which a little melting occurs. The soft zone in the mantle is the asthenosphere--we will not learn a huge number of new words in this class, but we do get a few great ones! The core has two layers, a solid inner core, and a liquid outer core.

Some of the Earth’s heat is left over from when the planet formed, and a lot comes from the decay of naturally radioactive materials in the Earth. As the early heat has escaped and the radioactive materials have decayed, the Earth has slowly been cooling off, but plenty of heat remains to drive geologic processes. The Earth has developed an atmosphere, oceans, and life, and a rich sedimentary history of how those developed. The atmosphere and oceans spend their time wearing down mountains, but the heat of the Earth keeps driving processes that build mountains up, so there is a near-balance. And all of this should become clear as we tour the national parks.
Sidebar: A Brief Chemistry Lesson
Sidebar: A Brief Chemistry Lesson
Most students reaching the university have taken a chemistry course somewhere along the way, but a few of you haven’t. Here is a BRIEF summary of chemistry, as a refresher for those who have had a chemistry course and as a teaser for those who have not. We do not use a lot of chemistry in this course, but it comes up often enough that you may find a summary to be helpful.
If we pick up anything around us (water, chewing gum, rocks, whatever) and try to divide it into smaller and smaller pieces, we will find that it changes as it is divided. A tree becomes a log as soon as we cut it down. If we dry the log before burning it, we find that it contains lots of water, plus other things that are not water. If we then use fire to break the log into smaller pieces, we find that we can do so, while releasing energy. Using tools and energy levels that are easily available to us, we will find that we can continue dividing something until we get to elements, but that we cannot divide the elements.
The “unit” of an element is called an atom. There are 93 naturally occurring elements, plus others that humans have produced. If we use even higher energies, such as those achieved in nuclear accelerators, we find that we can take atoms apart.

Each atom proves to have a dense nucleus, surrounded by one or more levels where electrons are found. It may prove helpful to think of electrons circling a nucleus the way planets orbit the sun, although this simplified model doesn't capture all the features of an atom.
The nucleus contains smaller particles called protons and neutrons. Protons have a characteristic that we call positive charge, electrons have an equal-but-opposite negative charge, and neutrons are uncharged or neutral. A neutral atom of an element contains some number of protons and the same number of electrons, with their positive and negative charges just balancing each other.
The type of atom, or element, is determined by the number of protons; add one proton to a nitrogen atom, for example, and it becomes an oxygen atom. (Breathing nitrogen without oxygen would cause you to die quickly; they are different!) The positively charged protons packed tightly in a nucleus tend to repel each other, but the neutrons act to stabilize the nucleus. Some elements come in different “flavors,” called isotopes, which have different numbers of neutrons and so different weights. Slight differences in the behavior of isotopes allow us to use them to learn much about certain processes on Earth, as we’ll see later. All atoms of an isotope are identical, and all atoms of an element are nearly identical.
Chemistry includes all of those processes by which plants grow, we grow, wood burns in a fireplace, etc. Chemistry involves changes in how electrons are associated with atoms. An atom may give one or more electrons to another, and then the two will stick together (be bonded) by static electricity, the attraction of the positive charge of the electron-loser for the negative charge of the electron-gainer. An atom that gains or loses one or more electrons is then called an ion. Atoms may also share electrons, forming even stronger bonds and making larger things called molecules.
Most Earth materials are made of arrays of ions, although some are made of arrays of molecules. The ions or molecules usually form regular, repeating patterns. For example, in table salt, a lot of sodium atoms have given one electron each to a lot of chlorine atoms, making sodium and chloride ions. Then these stick together. One finds a line of sodium, chloride, sodium, chloride, sodium, chloride, and so on, and a line next to it of chloride, sodium, chloride, sodium, ..., and above each sodium there is a chloride, and above each chloride a sodium, in a cubic array. A grain of salt from your saltshaker will be a few million sodium and chlorides long, a few million high, and a few million deep.

The properties of the grain of salt—how it tastes, dissolves, breaks, looks, etc.—are determined by the chemicals in it and how they are arranged. We call such an ordered, repeating, “erector-set” construction a mineral. Almost all of the materials in Earth are minerals. Liquid water is not a mineral because the water molecules are free to move relative to each other, but liquid water becomes a mineral when freezing makes ice.
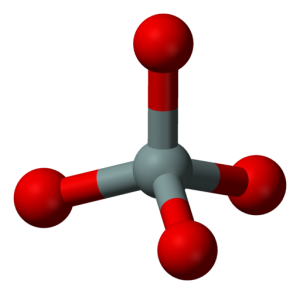
When the Earth formed, we received a few elements in abundance and only traces of the other naturally occurring elements. More than half of the crust and mantle are composed of two elements–oxygen and silicon. Most minerals and rocks thus are based on oxygen and silicon, and we call these rocks silicates. In silicates, the silicon and oxygen stick together electrically, with each little silicon surrounded by four oxygens. Silicon, oxygen, and six others–aluminum, iron, calcium, sodium, potassium, and magnesium–total more than 98% of the crust and mantle. Geology students used to be required to memorize the common elements, and their abundance, in order; for our purposes here, know that only a few are common, and we’ll come back to them later.
The silicon-oxygen groups form minerals either by sticking to each other by sharing oxygens, or by sticking to iron, magnesium, or other ions. Minerals that contain a lot of iron and magnesium are said to be low in silica, even though they may still contain more silicon and oxygen than iron or magnesium. In general, minerals high in silica are light-colored, low-density, have a low melting point, often contain a little water, and occur mostly in continents; minerals that are lower in silica usually are dark-colored, high-density, melt at high temperatures, and occur on the sea floor or in the mantle more often than in continents. You may hear “basaltic” used for low-silica because basalt is the commonest low-silica rock at the Earth's surface; similarly, “granitic” means high-silica because granite is a common high-silica rock.
Just for Fun—Rockin' Around the Silicates
We've seen that most of the Earth's crust is made of minerals with silica (silicon and oxygen) in them. Melting these minerals feeds volcanoes, and freezing the melt clogs volcanoes and makes new minerals in new rocks. When we get to the Redwoods and the Badlands in a couple of weeks, you'll see how the weather attacks the new minerals, and you'll meet a few of the minerals being attacked. Here, just for fun, you can see some truly beautiful minerals, and learn a bit about the wonderful ways they are put together—Lego blocks and erector sets have nothing on nature! Meet the main minerals of the crust, in a parody of Bill Haley and the Comets' Rock Around the Clock. This Rock Video has a bit more detail than we'd ever ask in this class, so don't worry about actually learning the difference between nesosilicates and inosilicates unless you're interested.
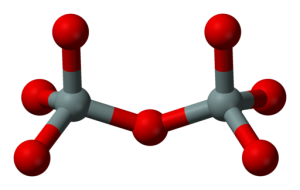
[MUSIC PLAYING] PRESENTER: (SINGING) Definite chemical composition. Repeating order, each in position controls the growth of the faces crystalline. Minerals, silicates are commonest here. Silicon plus 4 has a friendly face, gets 4 oxygens to share its space. Then little silicon is really hid in a tetrahedral pyramid, SiO4 -4 won't balance out. So put a silicon on the other side, of an O -2 that's nice and wide. Then one extra O electron counts each way, with the O in two tetrahedra to stay, sometimes it pays to share, there is no doubt.
But shared oxygen's not the only way to balance out the charge today. Put a +2 ion in between two oxygens from the pyramid scene. Give iron or magnesium a shout. Share all four oxygens, that's great. You've made a tectosilicate. And half of four with each Si makes SiO2 coming by. That's quartz, but crystals don't work at the bar.
But there's lots of aluminum plus 3 that needs a space where it can be. Take four SiO2 then place one Al in an Si space. K or Na plus balance alkali feldspar. Or kick out Si for two Al that happen by, and balance with Ca +2, Na to Ca solid solution, and then that is plagioclase feldspar.
But if your tetrahedra just won't share, a nesosilicate is there. When each tetrahedron can be found with iron or magnesium all around. SiO4, it's olivine you'll see. Share some oxygens but not each one, so many ways to mineral fun. Share 3 in sheets, the phyllosilicate way, Si2O5s in mica, serpentine, clay, with some other things, gives cleavage that's flaky.
Share one O, tetrahedra form a pair. Si2O7 in the equation somewhere. Sorosilicate, epidote, you know, but we've still a little way to go 'cause some other tetrahedra want to join up, you will see.
Share 2 in a ring, Si6O18, cyclosilicates beryl, and tourmaline. SiO3 sharing two in a line, or Si2O6, that's also fine. Pyroxene, single-chain inosilicate, baby. Join two ions side by side, is it rings or chains? Si8O22 gives you amphibole grains. It's a double-chain inoslicate. Learn the hornblende formula, just can't wait. Half the tetrahedra share 2 Os half share three. Neso, soro, ino, cyclo, phyllo, tecto, silicates-o, tetrahedral Si, and O form the minerals commonest below with Al, Fe, Ca, Na, K, Mg.
This Course
This Course
It would be fun to take a tour of all the national parks and learn a little about each. But Penn State would not award you General Education credit for such a course—you are supposed to be taking a tour of a field of knowledge, in this case, geology.
So, we will take a tour of geologic ideas. But some of the best geological features of the world are enshrined in the U.S. (and other!) national parks. We will use national parks as illustrations, delving into park history and culture when we can, but concentrating on those things that illustrate how the Earth works.

Scientific Literature: An Introduction to Exercise 1
Scientists communicate in a lot of ways, but the most important is through refereed scientific literature. Any scientific paper is first submitted to a learned journal, and the editor sends the paper out for peer review. In this, several recognized world experts read the paper and make sure it is “good.” Are the methods described well? Are uncertainties given? Is proper credit assigned to other sources? Do the equations make sense? Are substantive conclusions reached? If there are obvious errors, then the paper is sent back to the author or authors for revision. If the paper is unclear, or can’t be read well, or information is omitted, if unsubstantiated claims are made, or if anything else is wrong, the paper is sent back for revision. Only when the paper clearly and logically presents new results, will it be published.
Peer review takes a lot of time and effort. Peer review also slows down the publication of important results. (The papers authored by Drs. Alley and Anandakrishnan which have been of greatest use to other people were also the ones that had the hardest time gaining approval from reviewers, who check especially carefully on the big stuff.) And, there is no guarantee that the reviewers will get everything right; errors do sneak by. However, peer review raises the quality of the scientific literature above the quality of other sources that are available to you.
You can find information in many places—books, magazines, newspapers, the Web, speeches by public officials, graffiti in restrooms, etc. Some of this information is more reliable than others. In general, the more permanent a publication is, and the more expensive it is to get you the information, the better the information. (So the Web, which is cheap and has a huge turnover in websites, includes an immense amount of nonsense as well as some good stuff.) But, there are surely exceptions to this “rule.”
If something matters, the refereed scientific literature, with its long traditions, its focus on accuracy, and its appeal to nature to test ideas, is the most reliable source available. Textbooks, lectures by professors, and other ways we give you information aren’t bad, but the refereed scientific literature is still better. You’ll have the opportunity to explore this in Exercise 1.
Virtual Tours
Virtual Tours
Throughout this course, you will have the opportunity to join Dr. Alley and the Geosc10 team for "virtual tours" of National Parks and other locations that illustrate some of the key ideas and concepts being covered. For the rest of the course, VTrips will present important material that may show up on the quizzes. In general, the slide shows start with pretty pictures to introduce you to a park and end with pictures focused on scientific ideas. The more scientific, the more likely to be on a quiz! Next, mostly for your enjoyment, are pictures of the world's largest national park (Northeast Greenland). Have fun!
Take a Tour of Northeast Greenland National Park
Preserving the best of the landscape in national parks is a U.S. invention that much of the world has adopted. The largest national park, Northeast Greenland National Park, is in NE Greenland and was founded in 1974. Both Dr. Anandakrishnan and Dr. Alley have conducted research there. Most of the pictures were taken by Richard Alley in or just outside of the national park, during a research expedition to Scoresby Sund in the autumn of 2005. Enjoy!
A Rocking Review
A Rocking Review
We’re off on a great journey through the National Parks, around the world, and deep into history. Here’s a preview of some of the things we’ll visit before the semester ends. These "Rock Videos" are mostly parodies of famous songs. Later in the semester, they really will be useful reviews of the units.
Video: Geoman "Piano Man" Parody (5:14)
4.6 billion years, as the story starts before our new crowd'll shuffle in; the ones who can learn from the scary parts, and enjoy that the ball's still in spin. Falling meteorites hit with energy bringing radioactivity. And the melt from that heat, gave us layers, discrete the core, mantle crust, air, and sea. Then a Mars-sized one blasted the moon out to make tides and to shine down on us from on high.
Sings us a song, you're the GeoMan. What was, and what is, and will be, On this blue-green ball spinning as fast as we can, with rocks, water, air, you and me.
No living thing softened that Hadean scene. No oxygen blew through the sky. 'Til photosynthetic bacteria, blue-green gave us something to breathe by and by. That oxygen changed the Earth's chemistry and broke down so much greenhouse gas that the new O2 breeze gave a Snowball deep freeze 'til volcanic CO2 made it pass. Now, while Venus melts lead, and Mars shivers This ball that we love is fine-tuned in between.
Sings us a song, you're the GeoMan. What was, and what is, and will be, On this blue-green ball spinning as fast as we can, with rocks, water, air, you and me.
Precambrian microbes, then trilobites in Paleozoic warm seas led to sauropod-Tyrannosaurus fights across Mesozoic countries. 'Til one fateful day of the meteorite, just 65 million years past, in that fire-ice hell the great dinosaurs fell, while a few mammals weathered the blast. And, the jobs that the dinos left open have slowly been filled by those mammals' offspring.
Sings us a song, you're the GeoMan. What was, and what is, and will be, On this blue-green ball spinning as fast as we can, with rocks, water, air, you and me.
There's a pretty good crowd here on Saturday. Procreation for mammals a thrill. Cenozoic's long scene becomes Anthropocene, and we wonder if we have the will. 4.6 billion years of just nature, Then 6 billion of us join the mix (2012 update -7 billion and counting). Some are thinking quite clear, but some smell like a beer, and there's lots of things here we should fix. But as long as the ball keeps on spinning, and as long as the music keeps playing, we're in.
Sings us a song, you're the GeoMan. What was, and what is, and will be, On this blue-green ball spinning as fast as we can, with rocks, water, air, you and me.
Optional Enrichment Article
Optional Enrichment Article
We ask you to learn a lot of material for this course, but there is MUCH more to learn. Sometimes, we will give you a little extra material in an Optional Enrichment Article. These are not required; they are optional. The additional material they cover will not be on the RockOn Quizzes or in the Final. But, in discussing science with former students, we have found many students want answers to certain questions, and we have tried to answer those especially common questions in the Optional Enrichment Articles. Here is one discussing some of the reasons why some people resist some of the ideas of science
Babies, Big Ben, and the Age of the Earth
In this course, we will deal with several ideas—the age of the Earth, the occurrence of evolution, the prospect of global warming, and others—about which there are sometimes heated public debates in the US. These debates have persisted in the US, and in some other places, long after scientists reached a consensus and moved on, using science to help people. These debates have persisted here long after most people in many other countries accepted the scientific results, and began helping the scientists use the information to help people. Why is this? Are scientists and people in some other countries just stupid, ignoring common sense? Are many regular people in the US just stupid? Are US politicians cynically exploiting subjects for personal gain? You will get many different answers to these questions from different people!
Here, we’d like to give you something to think about. The discussion here in no way proves that scientists are right about the age of the Earth, evolution, or global warming—we’ll discuss the evidence about these later in the course. But, the discussion here may help you to think about thinking about these issues and to examine your own ideas on the topics. So…
Have you ever visited an old European city and tried to drive through the downtown? Or have you watched from the sidewalk, or in a movie, while others tried to drive the winding streets of Rome or London? People who have done so quickly form opinions about the experience, and those opinions are very seldom, “Wow, what an efficiently designed road system, ideal for moving traffic.” Far more common is “Wow, what a mess!” And yet, although almost everyone knows that the roads are a mess in the downtowns of major old cities, those roads are still there. Why?
The answer is fairly simple. The roads were built when the city was tiny, centuries or even millennia ago, to serve that proto-city. Then, as the city grew, it grew around those roads. Buildings went up, and museums and castles and theaters and sewers and all the other stuff of a city. Would you move Big Ben, or tear down the Louvre and start over, to straighten out a winding road? When faced with that choice, people usually keep the old roads. Careful checking will show you that people actually have put a lot of effort into improving the roads over time, moving things, tunneling under or bridging over, adding subways to take off some of the strain, patching and fixing and repairing, spending billions of dollars (or Euros, or pounds, or whatever), but always starting from the existing system rather than starting over.
There is a useful analogy here in considering how humans learn things, and in particular how we learn science. I (this is Dr. Alley writing) have had the joy of watching closely as our two daughters grew from babies to toddlers (and on to remarkable young women), and there is a good chance that you have either closely observed growing babies or will. Scientists watch babies, too, and are learning a lot about learning.
By the time a baby is a year old, he or she knows an amazing amount about the world. The baby knows that some things are inanimate and others animate—rattles don’t walk away, but parents do. Many things are predictable for a baby—a rattle released in midair always falls down, not up, unless grabbed by a mother or father or other living things. A rattle placed properly on the railing of a crib will stay there.
In gaining this knowledge, the baby is putting down “roads” in the brain, wiring in the information that later will be called “common sense”. When artificial intelligence researchers have tried to get computers to do human jobs, perhaps the biggest difficulty has been that the computers lack this “common sense”—teaching the computer all the things that a baby learns proves to be quite difficult because the baby learns so much.
Notice, however, that this “common sense” is often not correct. For example, babies do not start with a modern view of the shape of the Earth and the physics of gravity. Whatever a baby does think, a “round, round world”, with people and rattles pulled toward the center by the warping of space-time by mass that causes gravity, is not in the original common-sense picture.
Careful studies show that, when children are finally told about gravity on the spherical Earth, they initially resist the idea. They may deny it, or they may try to modify it to fit with their “common sense”. (If asked to draw the world, they may add a flat spot or divot just where they live in an otherwise spherical Earth, or they may draw people living inside a sphere.) Often, it takes until age nine or so before children say that they accept the idea that they are held to a spherical Earth by gravity, and they draw pictures properly illustrating the idea.
Furthermore, studies show that children show this sort of resistance to most or all new ideas that conflict with the “naïve physics” or “naïve psychology” formed in the cradle. Like a city preserving its old roads, a child preserves the initial ideas—perhaps adding or patching, building new paths in the “suburbs” of the mind, or building “subways” that take the new idea around the old ones, but get rid of the old idea only when necessary.
Now, almost all children eventually come to accept the spherical Earth. (There are a few people out there who still argue against the spherical Earth, just not very many.) But, typically all of the authority figures in a child’s life agree in telling the child that the Earth is spherical—teachers, parents, preachers, TV, books, and more—with almost no disagreement. (And yes, even young children have a ranking of the reliability of information sources, picking which “authority figures” to believe more.) Yet with all of the authority figures agreeing, years may still be needed to convince a child to replace the old “road” in the brain with a new one (and that old road might even still be in there somewhere).
What about, say, the age of the Earth? The scientific evidence indicates that the Earth formed about 4.6 billion years ago. But 4.6 billion years is not “common sense” to most people—we don’t imagine such large numbers very well. If you ask a very young child how old the Earth is, you are almost guaranteed to get an answer that is not “4.6 billion years”.
In many parts of the world, all of the authority figures in a child’s life agree in telling a child that the Earth is 4.6 billion years old—teachers and parents and preachers and politicians and more—and almost all children in those places eventually come to believe that the Earth is 4.6 billion years old. But in some places, including the USA, many authority figures do not agree on this. Some preachers, some parents, some politicians, and even a few teachers express doubt about this scientific idea, and some may be actively hostile to it, claiming a very different answer. When faced with a scientific idea that runs against the “common sense” developed at a young age, and with a split opinion among authority figures, a typical child will keep the old “road” through the “city” of their mind. And that child is likely to grow up into a parent, preacher, or politician who disagrees with the science.
As noted above, this does not in any way prove that science is right and young-Earth politicians are wrong, or that young-Earth politicians are right and scientists are wrong. We’ll address those questions later, after looking at how the Earth works. But, lots of evidence (and common sense!) shows that people do arrive at ideas much as described here, and you can go watch babies, visit other places, and convince yourself. (You might also look at the article listed at the end of this text for a little more information; some of the ideas and examples given here were taken from that article, which provides additional insights.) So, when you visit Paris or Madrid, please safely enjoy walking the narrow, winding streets. Then, on the plane home, ask yourself what the “roads” look like in the mind of the person in the seat next to yours—or in your seat.
Reference
Childhood Origins of Adult Resistance to Science
Paul Bloom and Deena Skolnick Weisberg
Science, 2007, v. 316, p. 996-997
Module 1 Wrap-Up
Module 1 Wrap-Up
Review Module 1 Requirements
You have reached the end of Module 1! Double-check the list of requirements on the Welcome to Module 1 page and the Course Calendar to be sure you have completed all the activities required for this module.
Reminder
Exercise #1 opened this week. You have two weeks to complete it, but please start early to avoid technological difficulties. See Course Calendar for specific dates.
Comments or Questions?
If you have any questions, send an email via Canvas, to ALL the Teachers and TAs. To do this, add each teacher individually in the “To” line of your email. By adding all the teachers, the TAs will be included. Failure to email ALL the teachers may result in a delayed or missed response. For detailed directions on how to do this, see How to send an email in GEOSC 10 in the Important Information module.
Module 2: Making Mountains and Earthquakes
Welcome to Module 2
Welcome to Module 2
Plate Tectonics I: Making Mountains & Earthquakes
“If they’d lower the taxes and get rid of the smog and clean up the traffic mess, I really believe I’d settle here until the next earthquake.”
“We learn geology the morning after the earthquake.”
“It’s snowing still,” said Eeyore gloomily. “So it is.” “And freezing.” “Is it?” “Yes,” said Eeyore. “However,” he said, brightening up a little, “we haven’t had an earthquake lately.”
As you may recall in the beloved Christmas special about Rudolph, at a key point in the story, Yukon Cornelius hacks off a chunk of sea ice—frozen ocean water—so that he, Rudolph, and Hermey the dentist elf can drift away over the ocean and escape from the Abominable Snowman. If you've ever neglected to check the spaghetti sauce you were heating on the stove while watching Rudolph because you were just dying to know whether 'Bumbles bounce', you may have noticed that the stiff scum that forms on top can break into chunks and drift around on the liquid beneath—much like Yukon C's ice block.
In this module, and the next two, we'll explore the equivalent activity in the Earth, with the hard-frozen upper layer breaking into drifting chunks, melted lava leaking up in cracks to feed volcanoes (vaguely like the water in the crack that the Bumble fell into when trying to catch the heroes), collisions causing earthquakes when blocks run together ("Land, Ho"), and more. Hold onto your teeth, and let's get started for the land of misfit plate boundaries.
Learning Objectives
- Explain how the Earth is layered, based on composition and physical behavior.
- Understand that the Earth is heated inside, especially by radioactive decay, and that this energy drives the convection of soft rocks.
- Discuss how convection can lead to the formation of new sea floor from volcanoes leaking up the pull-apart cracks.
- Understand how rocks moving on convection cells can produce damaging earthquakes.
- Explain how knowledge of earthquakes can be used to help people even if exact predictions are not yet possible and may never be.
What to do for Module 2?
You will have one week to complete Module 2. See the course calendar for specific due dates.
- Take the RockOn #2 Quiz
- Take the StudentsSpeak #3 Survey
- Continue working on Exercise #1
Questions?
If you have any questions, send an email via Canvas, to ALL the Teachers and TAs. To do this, add each teacher individually in the “To” line of your email. By adding all the teachers, the TAs will be included. Failure to email ALL the teachers may result in a delayed or missed response. For detailed directions on how to do this, see How to send an email in GEOSC 10 in the Important Information module.
This course is offered as part of the Repository of Open and Affordable Materials at Penn State. You are welcome to use and reuse materials that appear on this site (other than those copyrighted by others) subject to the licensing agreement linked to the bottom of this and every page. Students who register for this Penn State course gain access to assignments and instructor feedback and earn academic credit. Information about registering for this course is available from the Office of the University Registrar.
Main Topics: Module 2
Main Topics: Module 2
Overview of the main topics you will encounter in Module 2
The Earth: It's HOT Inside!
- Evidence showing the Earth is hot inside includes higher temperatures in deeper parts of mines and oil wells, and volcanoes bringing up heat from below.
- Most of the Earth’s heat is made by the decay of natural radioactive atoms in rocks, but some of the heat is made in other ways.
- How materials behave depends on what they are made of (their chemistry - iron, silica, etc.) and on the conditions they are placed in (heat, pressure).
The Earth: It's Layered by Composition & Behavior
- The Earth has an iron core, a mantle with silica added to iron, ocean crust with more silica, and continental crust with still more silica (the details are way more complex, but this is a start)—going up, each layer is less dense and floats on layers below, except that cold, old ocean crust can sink into hot mantle.
- The core has a solid inner part (the very high pressure deep in the Earth squeezes the iron to solid) and a liquid outer part.
- The crust plus the upper mantle together make a layer called the lithosphere, which tends to break, not flow; deeper in the mantle, the rock tends to flow rather than break (Just below the lithosphere is the asthenosphere, as well as deeper layers with other names we won't worry about) (hot solids can flow—think of the behavior of a chocolate bar in your pocket, or of a horseshoe that a blacksmith is shaping).
- The mantle and crust are almost entirely solid but with a little melted rock in a few places.
Convection: Currents Move the Mantle's Heat
- Heating causes soft rocks as well as liquids and gases to expand and rise, and cooling causes contraction and sinking; together the rising and sinking flows organize to form convection cells (in spaghetti pots on the stove, and in soft parts of Earth’s mantle).
- The lithosphere is broken into a few big plates that raft around on the convection cells like scum on a spaghetti pot.
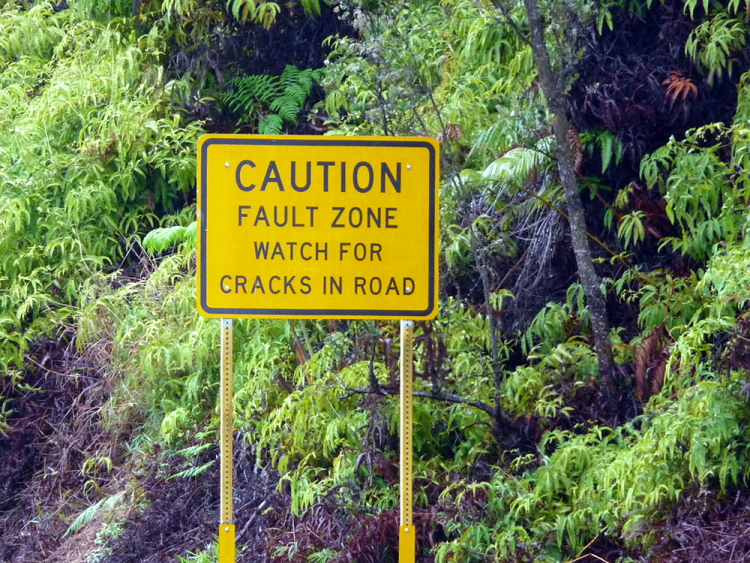
- Where the lithospheric plates are pulled apart, they tend to break. Breaks, in places such as Death Valley, often are angled rather than vertical, and one side slides down along the other, making an earthquake fault.
- Death Valley is a great example of the effects of convection!
Nevada is Getting Wider (with Death Valley)
- Lake Tahoe (California) and Snowbird (Utah) ski areas are moving apart about as rapidly as your fingernails grow (an inch or so per year)— this is measured with GPS and other techniques, as well as reconstructed from the geology.
- This motion has offset layers of rock across earthquake faults, and earthquakes still happen and increase that offset.
- Lava may leak up the faults to feed volcanoes.
- If this process continues long enough into the future (many millions of years), it could tear the western U.S. apart to make an ocean basin.
Death Valley: Tear-Apart Makes Oceans
- The Gulf of California was formed by spreading and tearing Mexico apart.
- Baja California is drifting away from the mainland.
- The breaking of the rocks has focused along a crack down the middle of the Gulf.
- As the rocks move away from the crack, their weight no longer squeezes the hot mantle beneath the crack.
- For most rocks, squeezing tends to make them solid, and “unsqueezing” (a pressure drop) favors melting.
- So, the hot mantle under the crack melts a little, and the melt leaks up the crack and freezes.
- The sea floor of the Gulf of California (and of all other oceans!) is made of frozen crack-filling lava.
- The sea floor is hottest, and thus highest in elevation, near the crack, forming a mid-oceanic ridge.
- Such ridges wind through Earth’s oceans like the seam on a baseball.
- Ocean-floor rocks are youngest near the ridges and oldest farthest from the ridges.
- Sediment (wind-blown dust, fish poop, etc.) is thicker away from the ridges because older rocks have had more time for fish to poop on them and wind to drop dust on them.
- Where ridges come up on land, they are ripping continents apart, as at Death Valley and in the East African rifts.
Earthquakes!
- An earthquake is the ground shaking from any cause.
- A few big, deep ones may be from pressure-squeezing minerals until they suddenly switch to a new, smaller form.
- Most earthquakes happen when one body of rocks moving past another body gets stuck for a while, bends, then breaks loose, and the bend snaps back like a broken rubber band.
- The break between the two bodies of rocks is called a fault, or sometimes an earthquake fault.
Earthquake: Seismic Waves
- During an earthquake, rocks shake neighboring rocks, which shake their neighbors, making seismic waves moving away from the quake.
- P (or push) waves in the rocks are the same as sound waves that go through air and liquids.
- S (or shear) waves are slower and don’t go through liquids or gases (the liquid outer core was discovered because P but not S waves go through it).
- Seismic waves shake buildings and may knock them down.
Earthquake Size
- An increase of 1 in Richter magnitude means an increase of 10 in ground motion, and an increase of 30 in total energy (a magnitude-3 quake moves the ground 10 times more than a magnitude-2 quake, which moves the ground 10 times more than a magnitude-1 quake).
- You can just feel a nearby magnitude-1 quake, a nearby magnitude-5 quake is big enough to damage buildings, and the biggest natural quakes from moving rocks (about magnitude-9) release far more energy than atomic bombs.
Earthquake Occurences
- For each increase of 1 in magnitude, quakes become about 10 times less common.
- But because an increase of 1 in magnitude means an increase of about 30 in energy, most energy is released (and most damage is done) in a few big, rare quakes.
- Quakes occur especially where big blocks of rock are moving past each other.
- There are not many big quakes in Pennsylvania or other central regions of lithospheric plates; big quakes mostly occur near plate edges.
Earthquake Damage
- Damage from the worst earthquakes can be HUGE (the worst ever is estimated to have killed about 800,000 people, in China in 1556).
- We can predict where big quakes are likely.
- We can’t (yet) predict whether a quake is about to happen.
- Rocks may give hints they’re about to break, but we're not sure we can "read" them reliably.
Plate Tectonics I: Death Valley
Plate Tectonics I: Death Valley
Death Valley is Growing Wider
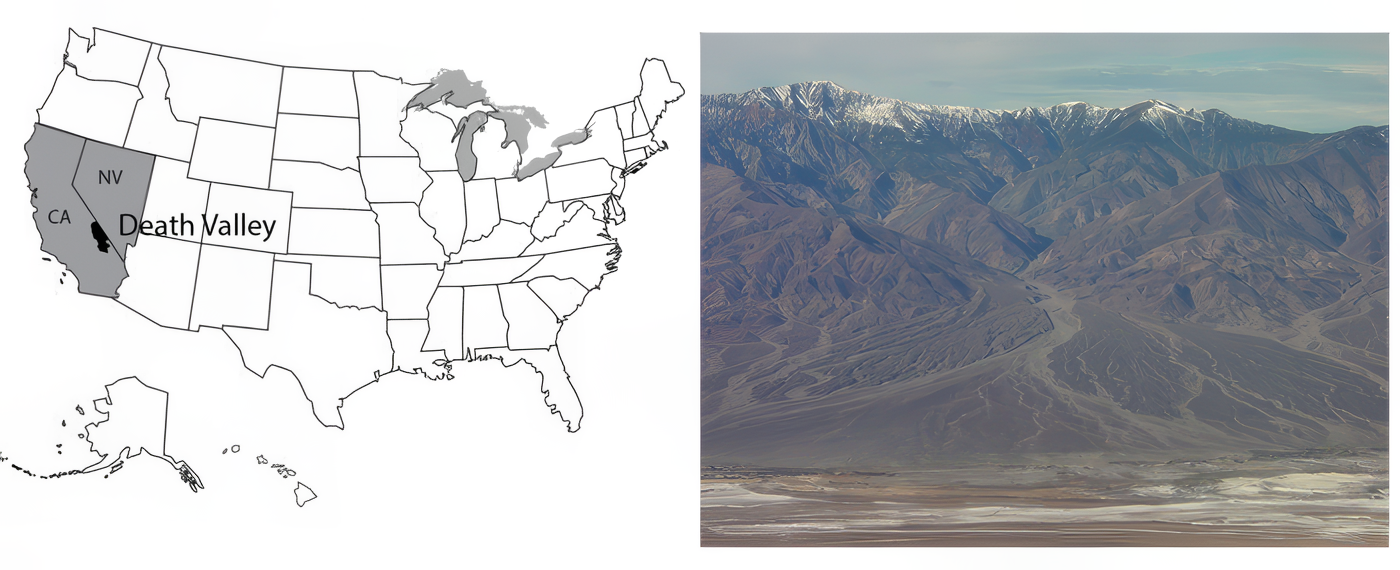
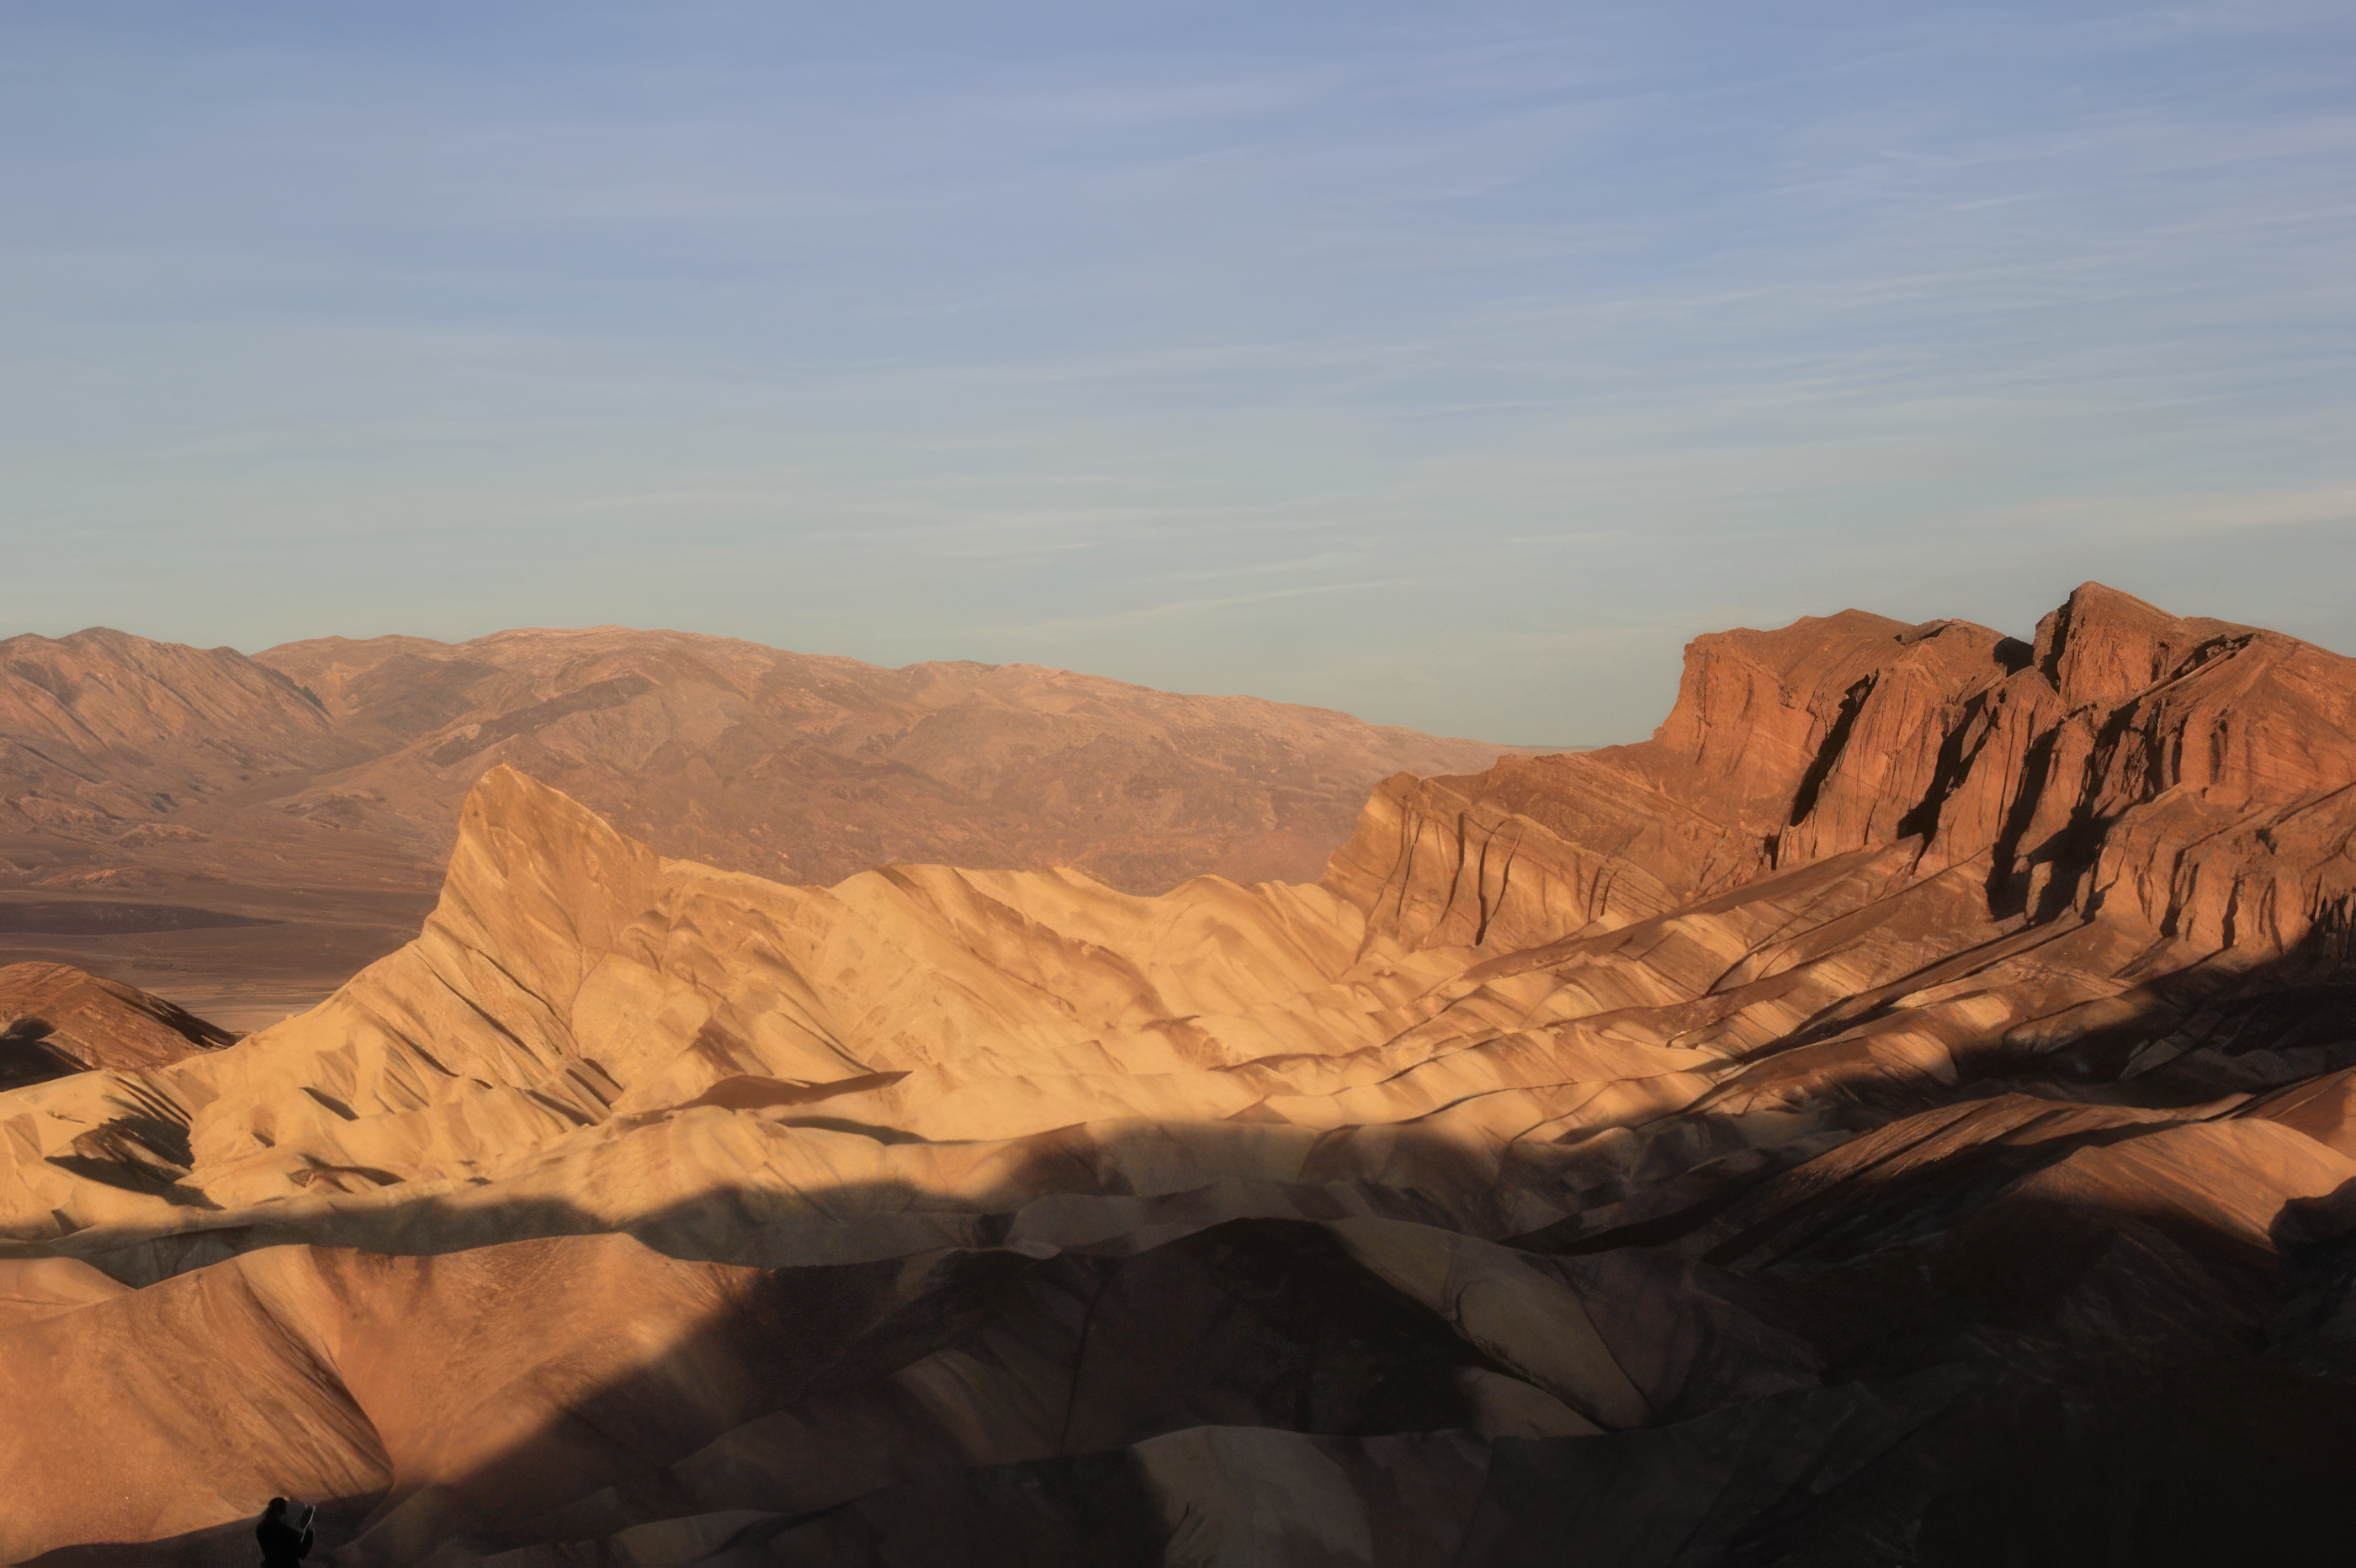
Death Valley National Park of California and adjacent Nevada sits as deep as 282 feet below sea level near Badwater, the lowest land in the western hemisphere. Yet, Telescope Peak in the Panamint Range, 11,049 feet high, is in the park less than 20 miles west of Badwater, and Mt. Whitney, at 14,494 feet the highest peak in the continental United States, is only about 80 miles away.
Death Valley is the hottest, driest place in the United States. The hottest air temperatures ever recorded reliably in the world were reached in 2020 and 2021 in Death Valley. (130oF or 54oC), and 125oF is common. All of the rainfall (about 2 inches or 5 cm per year) evaporates quickly.
Occasionally, water will sit on mud flats for a while (especially in the colder winter) before evaporating to leave salt deposits. Sometimes in winter, the water freezes on top, and strong winds blow the ice, dragging rocks that are frozen in it. The tracks of such rocks, at the Devil’s Race Track (see the great pictures in the vTrip), long puzzled people before the answer was discovered. (And you’ll still find people who argue about the tracks and rocks out on the flat surface—no one has ever watched the rocks when they were moving!) During the ice age, more rain and cooler temperatures than today caused the valley to fill with water, forming Lake Manly, which was about 90 miles (150 km) long and almost 600 feet (200 m) deep at its deepest.
Salts left on mud flats by evaporating waters often contain boron, a rare element that has leached from volcanic rocks nearby and been carried into the valley by streams. Boron is used in soaps, water softeners, pottery glazes, and other things. Mining of the boron-bearing borax salts began in the early 1880s, and they were hauled out by the famous 20-mule teams. Mining was allowed to continue in the park after it was established (as a national monument in 1933, and a national park in 1994), but has ended now. Copper, gold, silver, lead, and talc have been mined in or near the park.
The great depth of Death Valley was not excavated by a steam shovel or an atomic bomb, nor were the rocks ground down by rivers, wind, or glaciers. The bottom of Death Valley was dropped downward, as the sides of the valley were pulled apart, playing their role in the great motions of the planet’s tectonic plates. This animation provides a brief description.
Video: Death Valley Animation (2:24)
Sierra Nevada Mountains, a big, beautiful mountain range sitting way the heck up there. Got gimongous trees growing on top of it, and so you're going to tell that this is a slice that I am showing you through the mountain range, and then bang, down into Death Valley, way down, deep, hot, starkly, gloriously beautiful place. Place you desperately do not wish to be in the summer without your water bottle. But then there's another range, and another valley, and another range, all the way across Nevada, many more than shown here. And, eventually, up in the Wasatch in Utah, end up where you'll find all these skiers standing around. That's Snowbird, so here's a skier so you can remember that this is Snowbird.
And so this is a picture of the West. If, however, you could see underground, what you would find is that there's a break along the front of the mountains. And that break continues on down. And all of these things have breaks sitting underneath them, running down underground. They're earthquake faults.
Furthermore, what you would find is that there has been motion, that the mountains have been raised and the valleys have been dropped, the mountains raised and the valleys dropped all the way across here. And for this to be happening, there has to be space made for the valleys to drop into. And so, in fact, the west is getting wider, and that creates the space into which the valleys drop and the mountains raise.
If you were able to find a particular layer of rock that you cared about, you might find it up here, and then you would find it way down below somewhere. And then you'd find it up, and then you'd find it down below, and so on across. And so it's a fascinating thing that the West is getting wider. You can measure this with GPS. It's actually there. It's shown in the geology, and there's a big story here.
In addition, one thing that one finds in the West is that there are volcanoes, as well. And those volcanoes tend to come-- that blue line-- it really should be a red line there-- the volcanoes come up, and they often leak up along the cracks, and spout up along the sides like this. And you get pretty little volcanoes growing. And that's part of the important story of how the West works, as well.
Take a Tour of Death Valley National Park
Take a stroll through one of the lowest pieces of land in the Western Hemisphere (282 feet below sea level), a place that, strangely enough, also happens to be adjacent to the highest point of land in the lower 48 states of the U.S., the 14,494-foot mountain peak of Mt. Whitney. Below are two virtual tours of Death Valley. In the first one, most photos are from a visit by former Penn Stater Peter Fawcett, who has gone on to be a professor at the University of New Mexico. The second is from a visit by former Penn Stater John Fegyveresi, who has gone on to be a professor at Northern Arizona University.
Optional: Want to see more?
- Death Valley National Park - Provided by USGS, the 3D version requires red/cyan stereo viewing glasses.
- Plate Tectonic Movement Visualizations - Watch the NSF-sponsored video on Plate Boundaries.
Pull-Apart Faults
Pull-Apart Faults
Fault Types
You can push things together, pull them apart, slide them past each other - or some combination of pushing or pulling while sliding. Nature does the same, giving different types of faults, which are found in different geological settings. Here’s a quick look.
Video: Fault Type Animation (3:46)
There's three major fault types that correspond to the three major plate boundary types. And we're going to look at these. They're push-together, pull-apart, and slide-past. And so right now, we're looking at a block of rock. And this block of rock is being squeezed by great tectonic stresses that are pushing on it from the sides. And this block of rock happens to be the place that you decided to build your giant, multi-million dollar McMansion that's just sitting up there on a hill.
Underneath your beautiful McMansion, there is an interesting yellow layer of rock, which you can follow. Now, we hope that you were smart enough, when you built your McMansion, that you didn't fail to account for the earthquakes that happen in the place that you built it, because otherwise, you're going to be an unhappy camper. Because when the earthquake happens, you shove one side above the other in the push-together environment, and then your house tends to fall down, and then you'd better know your insurance agent very well. And the layer of rock will be offset in the earthquake. So that is a push-together plate boundary.
We also know that there are pull-apart plate boundaries that are going to do a different motion pattern. There is a block of rock again. You have gotten the insurance settlement on your McMansion, and you have built a new one, which is sitting up here on the hill. But uh-oh, you didn't check with your geologist friends, or you didn't remember your GEOSC 10, and so now you have a fault underneath you.
But it's a slightly different fault in this case, in the sense that rather than being pushed together, now this one is being pulled apart. If you have a pull-apart fault going on, then what you will find is that sometime later, you're in a Death Valley situation. The earthquake happens. It drops the valley relative to the mountain, and you get an offset that looks something like this.
Your yellow layer of rock is still there. It has still been offset. And again, if you haven't been careful in your construction, or you haven't worried too much about things, your house has fallen down and your insurance agent would be a good phone call.
Now, there's a third possibility. Suppose that you've now gone broke because you didn't have good insurance. You're flying over the San Andreas Fault, and as you look down at the San Andreas Fault, you see the highway that's crossing the fault, and you're very pleased to see your new gas station where you're working because you have to raise money somehow. And in the middle of your highway, there are these beautiful, really fat dashed yellow lines that you see.
Now, unfortunately, if you're not careful, you may have problems yet again, because the San Andreas Fault has motion going on. And so you come back sometime later and the road has been offset, and the offset of the road is not a good thing for you. It came about because of the tendency for the west side of California to move north and the east side of California to move south.
And when it did what it was doing, the cars come driving along. And if a car comes driving along this particular highway and isn't careful what the car is doing, why, the car will run over the rubble that is left of your gas station after the earthquake. And so these are the three possibilities, the push together, the pull apart, and the slide past earthquakes corresponding to those plate boundaries.
The great depth of Death Valley was not carved by a river, glacier, or wind and is not from a cave, like Mammoth Cave, collapsing. Instead, as shown in the diagram below, labeled Pull-apart fault at Death Valley (which is more-or-less what you would see if you could take a slice across the valley from the air at the top down into the Earth at the bottom), Death Valley has been dropped along faults as the region has been pulled apart. Similar down-dropped and upraised blocks extend across much of Utah, Nevada, and neighboring areas, forming the Basin and Range region. A little bit of such faulting even extends up into Wyoming, and the great front of the Teton Range is geologically a close cousin to the west side of Death Valley.
The geologic evidence of faulting is clear—layers of rock and even recent stream deposits are offset across the faults, as you'll see in a VTrip at the end of this module. The faulting occurs in fits and starts rather than smoothly, producing earthquakes. The Basin and Range regions remain active in producing earthquakes. (More about earthquakes is coming soon.) (If it bothers you that the faults in the diagram would cross at great depth, congratulations. This bothered early geologists, too. Most commonly for really big features such as Death Valley, one of the two faults stops at greater depth, and the other continues on but becomes flatter and becomes a nearly horizontal fault. For smaller faults, both may stop before intersecting. This isn’t a course in the details of structural geology, but if you’re really interested, the USGS and Wikipedia have a lot of information on faults.)
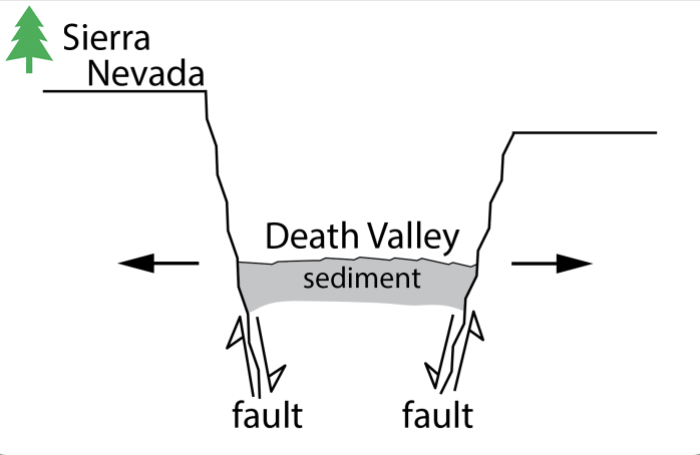
Because of the way that the faults are angled, the dropping of blocks requires that the region is getting wider! (Look again at the diagram above, labeled Pull-apart fault at Death Valley.) It is possible to measure this widening directly using GPS or very-long-baseline-interferometry techniques. The widening is not fast—maybe an inch or two (a few centimeters) per year across the whole Basin and Range—but the widening is occurring.
Go south from Death Valley and you will splash into the Gulf of California. The geologic record shows that all of Baja California was attached to the main part of Mexico, but has been moved out to create the Gulf, and is still moving out. Eventually, the Gulf may extend up into Death Valley as the spreading continues and the west “unzips,” although the unzipping may stop before the whole west is opened up (see figure below — Pull-apart fault in the Gulf of California).
Next, if you take a boat across the Gulf of California with a depth-finder running, you will learn that there is a ridge down the middle of the Gulf. Get in your submarine and dive on that ridge, and you will find that it is a volcano. Lava leaks up along a crack in the middle of this ridge volcano, hardens, and then moves slowly away as new lava leaks up along the crack. Interestingly, lava also leaks into Death Valley along its faults, with eruptions within the last 200 to 300 years.
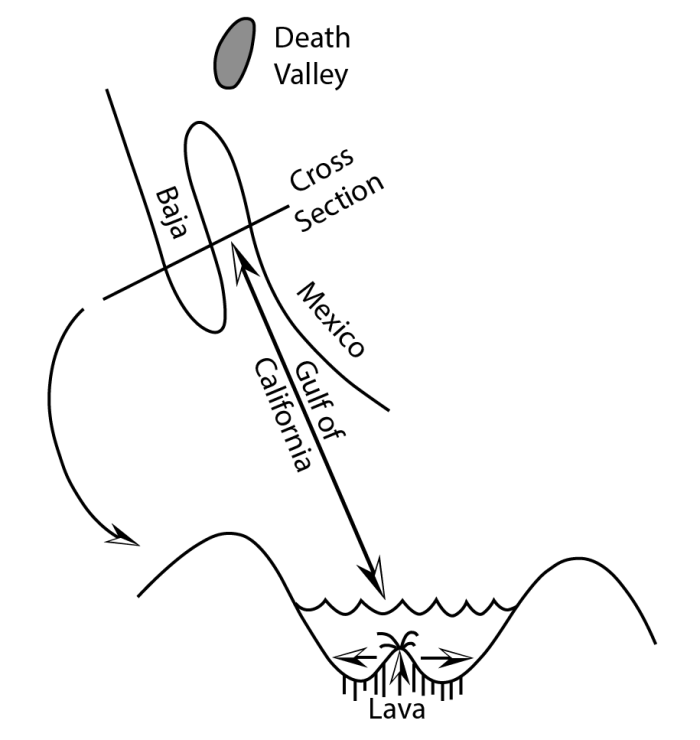
Baja
Clothes packed into a too-tight suitcase may leak out as the zipper is opened. Baja California is being unzipped from the mainland of Mexico, and the leak is a volcano making new seafloor. If the unzipping continues, the sea might someday extend up toward or into Death Valley. Get a good grip on the zipper pull of your luggage, and let’s go see.
Video: Baja Animation (2:08)
So, we're going to slice our way through the earth. We're gonna drive off of Baja, California, down undersea, and across. And out in the middle, we find this big bridge. And then sitting out there is Death Valley. And then we're going to come on across and back up onto the coast of Mexico.
And just to make sure it's clear, this is all underwater. So, here's the waves of Baja. If you're really keen about SCUBA diving, this is a good place to go. And there's birds flying over the top, and there's little boats that are floating in the water, so you can see what the thing is.
Now, if you were to measure the motion of this stuff, we're going to find that it's doing what we've seen elsewhere, which is, there's a motion going away from this ridge. If we could look very carefully, we would find that there is a volcano underneath this, and so material is leaking up into the cracks and making little volcanoes. And as it comes up in the cracks here, it hardens.
Looking at what's undersea, you find that there are lots of rocks that hardened in the cracks. And so the whole seafloor is made of these rocks that hardened in the cracks, and the oldest ones are farthest away from the center. So, they get older if you go out on either side.
If you were interested in fish poop and wind-blown dust, and things of that sort, you'd find there's almost none of them on the seafloor very close to the center. And then as you go away, they become more and more common. And that's because there's been more time for them to pile up, and very close to the center of the ridge, they just have not had very much time to pile up at all.
Now, you might imagine that this is related to other things. Then you remember that way down in the earth, one finds convection cells. And so you get the convection cells coming up and then spreading aside, and a little bit of leakage is coming up into the crack that it makes, making seafloor. And all of the world's sea floors are made in this way.
Dave Janesko, a geologist, was one of the students on the CAUSE trip. Here, he and Dr. Alley explore the great Sevier Fault just west of Bryce Canyon in Utah. The pull-apart action that opened Death Valley affected a lot of the West and is responsible for the Sevier Fault. The red limestone of Bryce was deposited in a lake. Much later, black lava flowed over the top and cooled. Then, the faulting occurred, and the black rocks were dropped to lie next to the red ones. Where the two meet along the nearly vertical, although slightly inclined fault, the red rocks show no sign of having been heated by the lava, so they must have been put together after the lava cooled. The red and black show near-vertical scratches formed when the rocks slid past each other to get where they are now. So, join Dave on the fault.
Video: The Fault Hunters (2:51)
OK, so we're standing on the Sevier Fault right now. This side over here is basalt. You can see the dark, black color. Over here, again, is the Eocene pink member of the Claron Formation, and it's the red rocks. So right now, I'm going to show you exactly what was going on here, what a normal fault means.
So, all right, let me figure this out. Richard, how do you think I should do this?
What I would probably do is something like this. I'd do this one's deposited in a lake, later the lava flows came out and they were deposited on top and across in various places. And then after that, the fault broke and this one has dropped down so now that it's next to it rather than being on top of it.
Sounds good.
Something like that.
All right. Maybe I should just use that.
This rock right here is 40 million years old. This is from the Eocene Claron Formation, and it's a lake deposit. This is what we saw earlier. And this right here is a piece of the basalt, which is Miocene, which is 10 million years ago.
And what this would look like in cross-section, something like this. The Claron, some more rocks, and then the basalt was deposited on top of it. Now when the fault occurred, these rocks would drop down along it like that. And now they're sitting right next to the Claron Formation, which they really didn't have any association with before.
Right now, we're on this basalt here. I'm on the south side, and if you can look in the distance there, you can see how this line of this fault moves right along into the distance. So again, the red rocks on that side, and the basalt on that side.
Richard, why does the basalt have more trees than the red side?
The soil probably?
It erodes faster on the right.
It will erode faster, and it's probably more minerals and nutrients in it.
In basalt?
Yeah.
Yep, doing great. Just be careful out there.
Then just take a pan from this.
Sea-Floor Spreading
Sea-Floor Spreading
Think back to the ridge volcano that has formed in the Gulf of California south of Death Valley. If you follow this ridge volcano south, you will find that it runs into the open Pacific Ocean and then wraps around the globe through all of the world’s oceans, like the seam on a baseball. The ridge runs right up through the middle of the Atlantic (coming to the surface in Iceland). (Because the ridge is in the middle of the Atlantic, the middle of the Gulf of Mexico, and the middles of some other ocean basins, it is often called a mid-oceanic ridge, although in some places the ridge is far from the middle of the ocean.) Study the seafloor, and you will see that it is made of rocks that are young near the ridge—they hardened as the lava cooled recently - with older rocks farther away, that hardened as the lava cooled a longer time ago. We will discuss how we learn the ages of rocks later; for now, please accept that the rocks, and the sediments just above the rocks, are progressively older with increasing distance from the ridge.
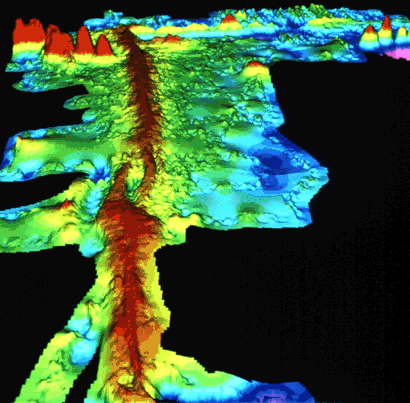
Everywhere we meet the ridge, it is relatively shallow and hot. The rocks that form at its volcano slowly cool as they move away, contracting and sinking. The ridge is a bizarre place in many ways—water circulates through cracks in the hot rocks, dissolves many chemicals in the rocks, and emerges at “black smokers” where the minerals reprecipitate or “rainout” in the colder ocean as a sort of black dust or as a cone around the emerging water. Many valuable ore deposits were originally formed from the chemical precipitates around these black smokers. An entire ecosystem of tube worms, clams, etc., lives on bacteria that use these chemicals for a fuel source, rather than relying on the sun for energy, as do most living things.
Video: Hydrothermal Vents: 2016 Deepwater Exploration of the Marianas (1:05)
So, right now we are at a depth of 3,275 meters. Looking at an incredible black smoker hydrothermal chimney. that black fluid coming out there is likely between 300 and 400 degrees centigrade. These ecosystems, literally islands, or oases, amongst what is - I mean it's really cliche, and the deep sea is definitely not a desert - but relatively, islands of abundant fauna, islands of life, in what is usually a desert-like deep sea floor. Oh, this is so cool. What is that 27 meters high? 30 meters high.
Text on screen: 2016 Deepwater Exploration of the Marianas, NOAA Office of Ocean Exploration and Research, Okeanos Explorer, May 1, 2016.
Heat Inside the Earth
Heat Inside the Earth
We just discussed a lot of observations—a baseball-seam volcano through all the world’s oceans that is making seafloor and splitting and spreading continents and ocean basins. Explaining these observations will tell us much about the Earth and how it works.
The existence of volcanoes, bringing melted rock up from below, tells us that the Earth is hotter inside than at the surface. We learn the same in deep mines and drill holes—the Earth is warmer towards the center (once you get below the top thirty feet or so that are warmed a little by the summer and cooled by the winter). All rocks contain radioactive elements (mostly uranium, thorium, and radioactive potassium, but with some others). Radioactive decay of these makes heat in the Earth, much as radioactivity produces heat in nuclear power plants. Most of the Earth’s heat comes from this radioactive decay, although some heat is left over from when the Earth formed, or is being released as the core freezes, or as the core, mantle, and crust continue to separate and denser materials sink and give up heat from friction.
Heat is just the vibration of the atoms (or molecules, or ions; the little pieces) of which everything is made. More heat causes more vibration. Temperature is a measure of these vibrations; more vibration gives a higher temperature. Heat is moved around in three main ways: radiation, conduction, and convection.
Radiation
Vibrating atoms give off electromagnetic radiation. The electromagnetic radiation that comes from very hot atoms is visible to us and is called light; cooler atoms give off infrared or other electromagnetic radiation we cannot see. When an atom gives off electromagnetic radiation, the atom cools and slows down, unless it receives other energy to speed it up again. You soak up electromagnetic radiation if you lie out in the sun (and may get skin cancer as it damages the DNA in your skin, so doctors advise you to cover up with clothes or sunscreen), and you can feel electromagnetic radiation if you hold your hand off to one side of a hot stove burner. Electromagnetic radiation is a very efficient way to move heat from the sun to the Earth through space and our atmosphere, but radiation is a very inefficient way to move heat through rocks—the radiation doesn’t get very far before it is absorbed. (Thus, you cannot see far through most rocks.)
Conduction
If a rapidly vibrating atom (a hot one) sits next to a slowly vibrating atom (a cold one), collisions between the two will tend to slow down the fast one and speed up the slow one. This process is called conduction and moves heat energy from atom to atom. Conduction is a very rapid process over short distances. (If you foolishly touch a hot stove burner, you will almost instantly realize how quickly it makes the atoms in your skin vibrate rapidly, and how much damage can be done if they vibrate too rapidly and jump out of those places where they are supposed to be in your skin.) Conduction is a very slow process over long distances. Think of 1000 people standing in line. If one person accidentally bumps their neighbor, the response is almost immediate. But, it is rare indeed that the bumped neighbor will bump their neighbor who bumps their neighbor, rapidly moving the disturbance down the line. For the Earth, the distance from the center to the surface is roughly 10,000,000,000,000,000 atoms. The Earth is not old enough for a lot of the heat trapped at its center when it formed to have been conducted to the surface by this neighbor-bumps-neighbor-bumps-neighbor mechanism.
Convection

Convection is the third option for moving heat. Take something hot and move it from here to there. To get heat from the stove to your dinner table, you cook things on the stove and then carry them to the table, which is much more efficient than putting the food on the table and waiting for conduction or radiation to bring heat from the stove.
Nature has a special way of arranging this motion in many things. Heating causes almost all materials to expand because hotter molecules vibrate more rapidly and tend to bounce farther away from each other. This lowers the density of the material; its mass is the same, but it takes up more room. Low-density materials tend to rise, and high-density materials to sink. This leads to convection currents—a material is heated, rises, cools, and sinks. Typically, rising occurs in one place, then the material flows horizontally while it cools, and then it sinks and flows back to the rising point (see the convection figure above). (Technically, "convection" is used when the hot material moves because it was heated and expanded, and "advection" is used when the hot material moves for some other reason, such as you carrying the hot food from the stove to the table, but we follow most introductory texts in simplifying and letting you call it all "convection.") You may have seen the effects of convection currents in the air (we’ll talk about them later, but they produce wind, rain, etc.), and in the boiling water of a pot of spaghetti on the stove. Scientific evidence shows that convection currents occur in the Earth as well. This may seem odd at first because most of the Earth is solid rather than liquid. (Volcanoes come from a depth where there is a little bit of melted rock, but even there most of the rock is solid.) However, sufficiently hot rocks are soft enough to flow slowly. Again, we will discuss this later, but it is the same principle that allows a blacksmith to work hot iron into horseshoes or allows a chocolate bar to droop on a hot day.
Our modern picture of the Earth, then, is that it is heated inside, mostly by radioactivity. That heat cannot escape easily by radiation or conduction. When the Earth was young, the heat stayed in and warmed the planet. When the rocks became hot enough, they began to convect. The planet probably melted completely and convected vigorously, followed by solidification that slowed but did not stop the convection.
In convection, the hotter rocks rise and then spread. Rising occurs beneath the ridges in the oceans. There, the new seafloor is made and then rafted away on the spreading convection cells. Where a spreading zone passes under a continent, the continent is thinned and stretched and may be torn apart to make a new ocean. This is occurring under East Africa in the rift valleys, and in the Basin and Range of the western United States—including Death Valley—and occurred to open the Gulf of California, moving Baja away from the mainland. (There may be convection cells stacked on top of each other in the mantle, and other complexities, including much of the upward flow from deep in the Earth occurring as the hots spots we will meet soon—if we tried to cover all of the wonderful complexity at once in an introductory course, some of you would be overjoyed but many of you would be unhappy—but this is a good start.)
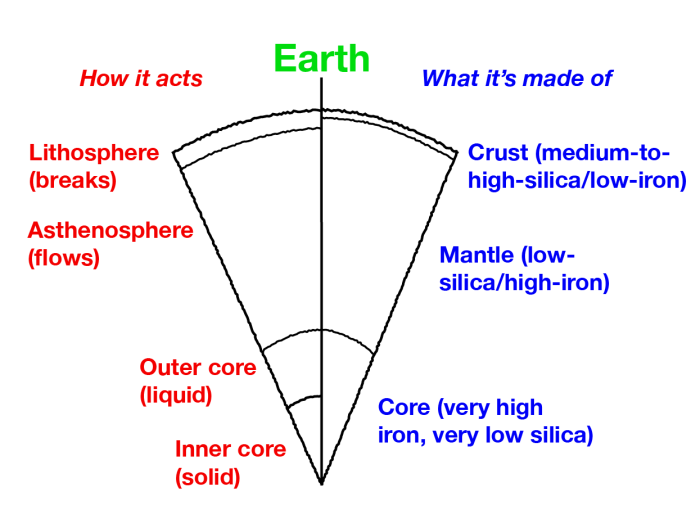
The Earth is layered chemically into a medium-to-high-silica crust, a low-silica mantle, and an iron core (well, there’s a good bit of nickel in the core, too). The Earth is also layered based on its ability to flow rather than break (see the Cross section of the Earth figure above). The lithosphere includes the crust and upper mantle. The lithosphere can flow a little in some places but usually breaks rather than flows if you hit it, squeeze it, or pull it with sufficient vigor. Below the lithosphere in the mantle is the asthenosphere, which generally flows rather than breaks, and from which many spreading-ridge volcanoes come. The mantle also has deeper flows-rather-than-breaks layers that we don't make you learn. And, the core has a liquid outer part and a solid inner part.
The lithosphere is broken into a few big pieces called plates. These float around on the convecting, soft asthenosphere. A plate may include just continental rocks, just the sea floor, or some of each. A plate map is given in chapter 3, in section 3.2 on Olympic National Park. The study of these plates and how they move and interact with each other is called “plate tectonics.”
Plate Tectonics II: Yellowstone
Plate Tectonics I: Yellowstone
Yellowstone is Shaking - Real-world Applications: Yellowstone and Earthquakes
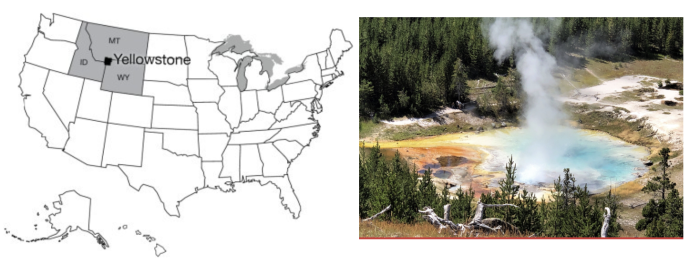
For many people, the name "Yellowstone" is synonymous with national parks. Here is a little background material about Yellowstone, and then an introduction to earthquakes, which are common in the Yellowstone area.
Yellowstone was the first national park, for a while it was the biggest (at approximately 60 miles by 60 miles—100 km by 100 km—it is still a big one), and it is widely considered to be the best. You could probably identify a dozen features or more in Yellowstone that, separately, would merit protection by a national park. The Grand Canyon of the Yellowstone is a great chasm cut through volcanic rocks that have been “cooked” by hot water and steam circulating through them, in the process gaining the yellow color that gave the park its name. The Canyon contains two large waterfalls (rather unimaginatively called the Upper and Lower Falls), where the river plunges over more resistant rocks. Mammoth Hot Springs is a mountain being turned inside-out, with acidic hot-spring waters dissolving caves underground, bringing the dissolved limestone to the surface, and depositing some of it as gleaming terraces. Specimen Ridge is home to at least 20 petrified forests complete with petrified roots, standing one on top of the other, from roughly 40 million years ago. Volcanic ash and debris flows buried the standing trees, and chemical reactions caused the silica in the ash to move into the wood, replacing it (a subject for much later in the course). A new forest grew and was buried, and this was repeated 20 or more times.

Yellowstone is especially famous for its thermal features. Various lines of evidence indicate that there is a body of melted rock (magma) under the park, now centered beneath the northeast side of the park. The rocks under most of the park are anomalously hot at shallow depths. In addition, the park receives abundant rainfall and snowfall. The water from rain and melted snow circulates deeply through rocks broken by numerous earthquakes, and the water is heated from below. In some places, the water is heated all the way to steam, which emerges from holes known as fumaroles. In other places, hot water bubbles to the surface in beautiful springs. If the bubbling action mixes in enough mud, then paint pots, mud pots or mud volcanoes develop.
Sometimes, cold water on top holds hot water down, with the pressure preventing the boiling of the hot water in a pressure-cooker effect. Eventually, a little boiling manages to expel a little of the water above, reducing the pressure, and allowing more boiling, and a geyser erupts. Geysers require heat, water, and a tight, tough plumbing system to hold the hot water and withstand the high pressures. The volcanic rocks of Yellowstone are rich in silica, which is dissolved and re-precipitated by the hot waters to seal cracks in the rocks, helping produce geysers. Perhaps half of the world’s geysers are in Yellowstone, including the largest and most spectacular ones. Yellowstone also is noted for many waterfalls besides those in the Canyon, for several other interesting features, and abundant wildlife, which we'll visit later in the course.
Yellowstone itself is centered on the Yellowstone Caldera, a collapse feature related to three great volcanic eruptions, or periods of eruptions. The caldera, roughly 50 x 30 miles (80 x 50 km), includes Yellowstone Lake but extends well beyond it. (No lake in the nation is both higher and larger than Yellowstone Lake, yet it is only a piece of the caldera.) The eruptions occurred roughly 1.8, 1.2, and 0.6 million years ago. Each of these eruptions moved roughly 1000 times more material than was moved by the Mt. St. Helens eruption of 1980 we will discuss soon; thick deposits of ash that were erupted from Yellowstone are found in the Badlands region of South Dakota. The erupted material that spread across South Dakota was removed from a magma chamber, and after removal, the “top fell in” to create the large depression that is the caldera. (Note that it is easy to take the timings of the eruptions...1.8 million years ago, 1.2 million, 0.6 million...and think that it is about to explode again. There is no evidence that an eruption is imminent, though. Dr. Alley recalls a worried tourist asking a ranger when the volcano would erupt, with the ranger replying that as long as he was not running away, the tourist didn’t need to worry!)
Yellowstone has many lessons to teach us. (It would be fun to have a course on the geology of Yellowstone alone, and we certainly could fill a semester.) The size of the Yellowstone eruptions is of considerable interest, especially considering the likelihood that they will recur sometime. Here, we wish to use Yellowstone to introduce earthquakes.
European exploration of the Yellowstone region probably began with “mountain man” John Colter during his return from the Lewis and Clark expedition in 1806, although Native Americans had used the region for thousands of years before. Colter brought back fantastic tales of the region, which were largely dismissed because they seemed impossible. Other travelers, and especially Jim Bridger in the 1850s, returned with similar tales, which also were discounted, in part because Bridger was a bit of a tall-tale teller. He is credited with stories of petrified birds sitting on petrified trees singing petrified songs (an exaggerated description of Specimen Ridge), of rivers that ran so fast they became hot on the bottom (the Firehole River, which has hot springs on the bottom), of trying to shoot an elk and missing because a mountain of glass was in the way (Obsidian Cliff, where rapidly-cooled volcanic rocks have made a glass called obsidian, which was mined, shaped into tools and decorations, and traded by the native Americans), and more.
To separate fact from fancy, the Washburn expedition from Montana (Washburn was surveyor-general of the Montana Territory) visited the region in 1870, and first developed the idea of a national park. The government-sponsored Hayden expedition of 1871 provided scientific documentation of the wonders of Yellowstone, supported by the artwork of Thomas Moran and photography by W.H. Jackson, which convinced Congress to found the park in 1872.
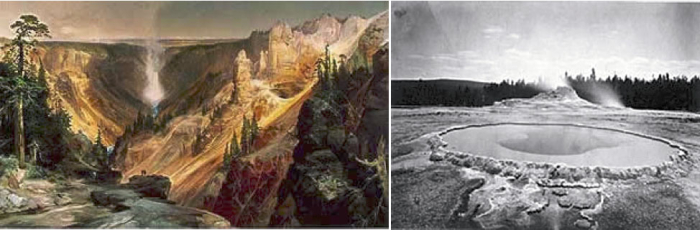
While in the park, the Washburn party felt earthquake activity. Breaks in recent stream and glacier deposits showed the geologists of the party that faulting had occurred recently, and those geologists already knew that motion on faults can produce earthquakes. Since then, modern monitoring equipment has detected numerous quakes in the area. (The United States Geological Survey identifies about 2000 earthquakes per year in Yellowstone, although with much year-to-year variability, and many smaller ones occur that the USGS doesn’t highlight.)
On August 17, 1959, a Richter-magnitude 7.5 quake occurred, centered near the northwestern boundary of the park. Many of the geysers were changed, and at least 289 springs suddenly erupted as geysers, including 160 with no prior record of eruption. The ground over the quake (at the epicenter—the place above the center of the quake) was broken, with one side dropping roughly 6 feet (2 meters) relative to the other side, and with a little twisting and turning causing even larger drops in some places. A large landslide was triggered, burying a campground, damming the Madison River to form Quake Lake, and burying many highways. 28 people were killed. Some survivors had their clothes torn off by the immense blast of wind pushed out of the way by the huge landslide. The Old Faithful Inn was evacuated, and the west entrance to Yellowstone closed. The University of Utah’s Seismograph Station has a nice summary of the press reports. You may find it interesting to search for and read the report from the Billings Gazette that a beauty pageant was going on in the historic Inn with 800 people watching, and that “Moments after the queen had been crowned and she was walking down the aisle to the plaudits of the crowd, the first, mighty shock hit. Everyone in the place dashed for the door.”
Take a Tour of West Yellowstone, Earthquake Lake
Take a quick virtual tour with Dr. Alley through the U.S. Forest Service Madison River Canyon Earthquake Area.
Want to see more?
Here is an optional virtual tour you might also want to explore. (No, it won't be on the quiz!)
The Original Iceland Geyser - Yellowstone has roughly half of the world's geysers, but there are geysers in New Zealand, Iceland, and elsewhere. The original "geyser" is Geysir, in Iceland. Here is a short film clip of Geysir erupting, just for fun. Filmed by Vicki Miller.
Elastic Rebound Theory
Elastic Rebound Theory
An earthquake is just the shaking of the ground, and many things can cause earthquakes. Much effort has been devoted to detecting underground nuclear tests by identifying the earthquake waves produced. Mining cave-ins, conventional explosions at quarries and mines or other places, and other events can cause earthquakes. The deepest earthquakes, which are very rare but often among the biggest ones, may have a phase-change or "implosion" origin, which we'll discuss later.
However, most earthquakes are produced by elastic rebounds. We’ve already seen that rocks are moving around on the planet and that the pull-apart action has allowed Death Valley to drop down. We will see that other motions occur as well, with one group of rocks moving past another. Where rocks are warm and soft, they flow. When cold and hard, they cannot flow.
Consider, for example, two large pieces of rock, such as southwestern California and the rest of the state. The southwestern part of the state, from Los Angeles to San Francisco, and the adjacent ocean floor are moving northwest relative to the rest of the state. The break separating the different parts is called the San Andreas Fault. (Both sides are moving westward, but the southwest side has an additional bit of northwesterly movement relative to the northeast side. Faults may go east-west, north-south, or any other direction, may be vertical or angled, and the rocks may move vertically or horizontally or in-between across the fault.) The forces that move the rocks are huge and applied over large areas so that far from the fault the motion is smooth. But at the fault, rough patches can get stuck against each other and become locked for a while. The rocks then bend. This bending is elastic—it can spring back. Eventually, the stress on the rough spots becomes too great, the fault “let's go”, and the bent rocks “spring back”. The springing back is very rapid, in the same way as for a spring or a rubber band. Displacements of several feet (more than a meter) or more are possible in much less than a second. A building sitting on the rocks near the fault can be subjected to very large accelerations and may fall apart.
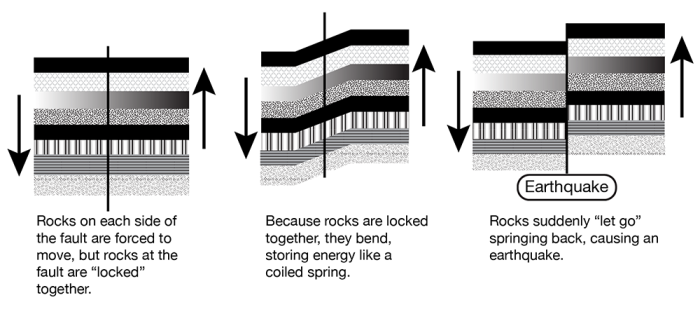
Such an earthquake will shake rocks beyond a fault. This is achieved through seismic waves—one piece of rock pushes another next to it, which pushes one next to it, and so on. Two major types of seismic waves are P or push, and S or shear. The P-wave is an ordinary sound wave. It represents a push-pull in the direction the wave is moving. A P-wave moving to the north will shake a mineral grain north-south-north-south. An S-wave moves slower than the corresponding P-wave. When an S-wave moves to the north, the mineral grains are shaken east-west-east-west or up-down-up-down (or some combination). A shear wave is similar to the wave you generate by shaking a rope. A piece of the rope moves up and down or back and forth, but the wave moves along the rope. The “wave” at football games is the same way—you stand up and sit down, but the wave moves along the bleacher bench. A P-wave may start a building shaking in one way, and then the S-wave hits the building and starts shaking it a different way, making the building more likely to break and fall down. (Earthquakes also make surface waves, which move more slowly than shear waves and go along the surface of the Earth like wind-driven waves on the ocean, rather than going through the Earth the way P- and S-waves do. The surface waves can also contribute to breaking buildings.)
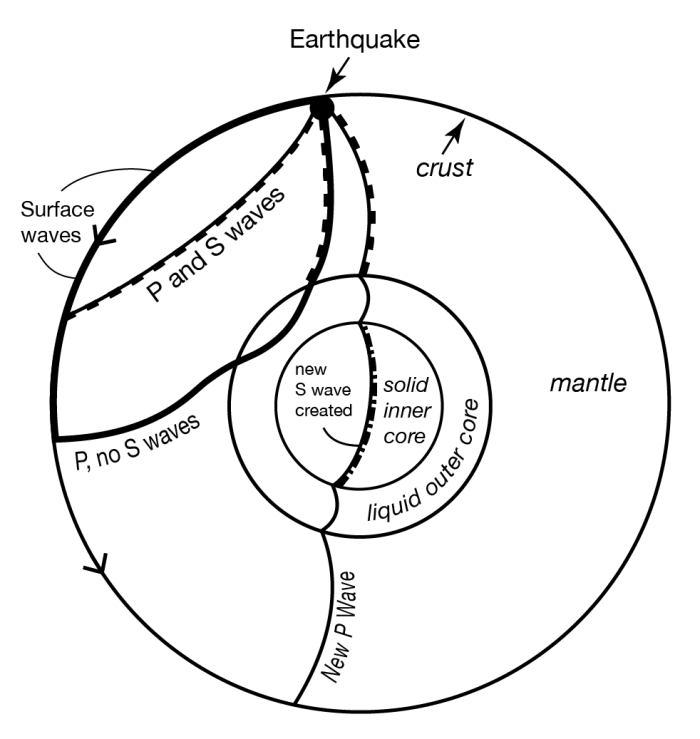
S-waves don’t travel through liquids at all. (Wiggle one piece of liquid to the side, and the moving piece slides freely past the next piece rather than wiggling it.) Recall that earlier we claimed that the outer core of the Earth is liquid. You may have asked, “How does anyone know that?” The answer is that, after a really big earthquake, P-waves can be detected all over the Earth. But S-waves are missing across the Earth from the quake, in places reachable only by passing through the core, as shown by the figure. So, we know that the outer core is liquid because it transmits P-waves but not S-waves. And, the outer core is nearly spherical because no matter where an earthquake occurs on the planet, there is a zone on the other side of the Earth in which S-waves are absent. (Learning that the inner core is solid is tougher; one of the pieces of evidence is based on wave conversions. The P-wave that passes through the outer core loses some energy in making an S-wave when the P-wave hits the inner core; this S-wave passes through the solid inner core, makes a new P-wave when it hits the liquid outer core again, and that P-wave travels on to the surface. The delay associated with the slower motion of the S-waves allows this to be figured out. But don’t worry about wave conversions, or the other evidence for a solid inner core, in an introductory course such as this one.)
Where Quakes Occur
Where Quakes Occur
Earthquakes, as noted above, occur where rocks are moving past other rocks. We have seen that this happens where rocks are being pulled apart, as in Death Valley, because the breaks often are angled rather than vertical, and the upper side slides down over the lower. We will see that there are other situations in which rocks are being pushed together, or that rocks are sliding past each other as at the San Andreas Fault, and these also can make quakes. This mostly occurs near plate boundaries. Volcanoes can cause small to medium-sized quakes as well when moving melt pushes rocks aside or leaves spaces into which rocks fall.
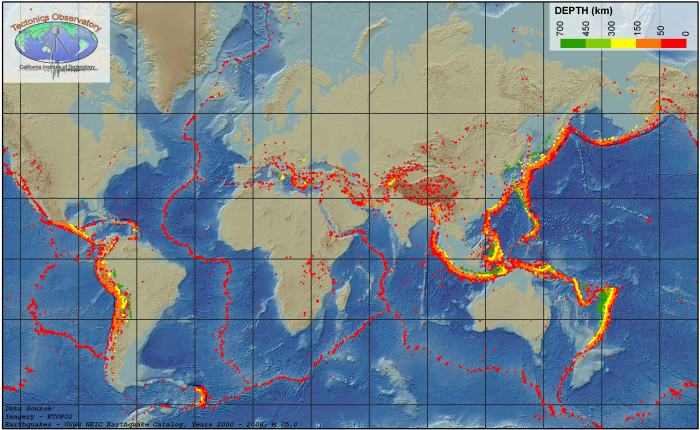
Quakes also occur at weak spots in continents. Often, when a continent is splitting open at a spreading ridge, the tear assumes a 3-armed form, something like many large wind turbines. (Poke your finger through a piece of paper and you’ll often get the same thing.) Two arms then grow into a spreading ridge that forms an ocean, and the third arm fails. Major rivers often form in such failed rifts. When the Americas split from Africa and Europe as the Atlantic Ocean grew, failed rifts became the river beds of the Amazon, the Niger, and the Mississippi. You open a fast-food ketchup packet by tearing at a little notch cut in the foil because the notch weakens the foil. If the notch isn’t there, you may have to poke a fork through or end up saying bad words, because the packet is much harder to tear without the pre-existing notch. In the same way, earthquakes can occur at the tips of failed rifts, which are the “notches” in the “foil” that is the lithosphere of the Earth. Some of the largest quakes known to have occurred in the U.S. were located at the northern tip of the rift along which the Mississippi flows, near New Madrid, Missouri. (Scientists are fairly confident that more large quakes won’t occur there soon, although there is still some slight chance.) Quakes also are known from an old weakness near Charleston, South Carolina.
Size of Earthquakes
Size of Earthquakes
There are several ways to measure earthquake size. The commonest is the Richter scale, a measure of how much the ground shakes during a quake. Richter developed a logarithmic scale—a magnitude 2 quake shakes the ground 10 times more than a magnitude 1 quake, and a magnitude 3 quake shakes the ground 10 times more than a magnitude 2 or 100 times more than a magnitude 1. You may think of the number of zeros after the 1: if the ground motion of a magnitude 1 quake is 10 with a single zero (you can choose the units you use, or the distance from the quake at which you measure, to get a motion of 10), then at the same distance from the quake in the same units, a magnitude 2 moves the ground 100 (two zeros), a magnitude 3 moves the ground 1000 (three zeros), a magnitude 0 moves the ground 1 (zero zeros), a magnitude -1 moves the ground 0.1, and so on.
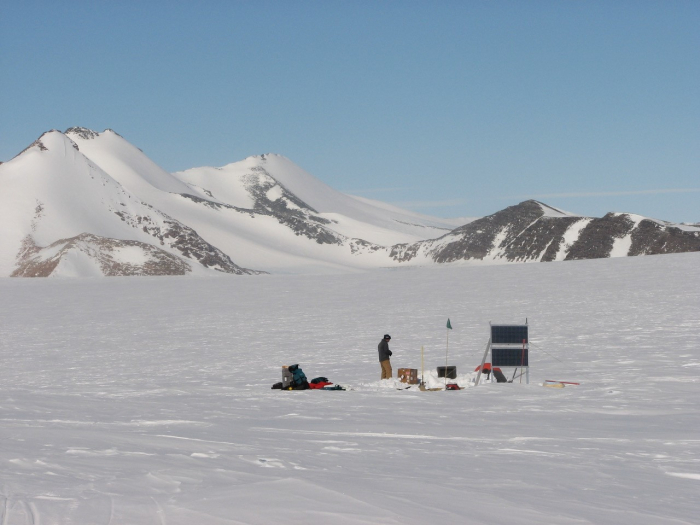
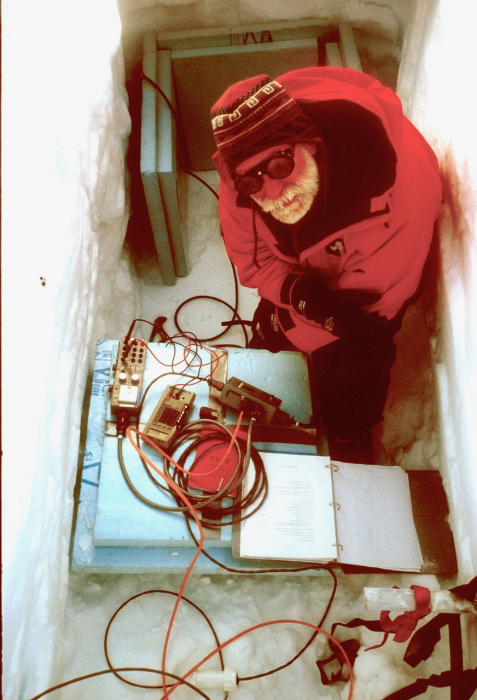
Ground motion can be measured with special instruments called seismographs. Scientists usually look at either P-waves or surface waves to get the size of the quake. The motion must be corrected for distance from the quake; the farther away from the quake your seismograph is, the smaller the ground motion you will measure. The distance can be calculated from the difference in arrival time between the first P-wave and the first S-wave from the quake to reach the instrument, using the difference in speed between P- and S-waves, or by timing the arrival of the earthquake waves at three or more stations, and determining where the quake must have been so that the waves arrived earlier at this station than at that one.
A Richter magnitude 1 quake is just big enough to feel if you are standing on the ground very near where the quake occurs. Magnitude 3 or 4 quakes are usually strong enough to convince some people to call the police (although it is not obvious what these people want the police to do), and magnitude 5 quakes usually cause some damage. The largest known quakes, around 9, each release about 10,000 times the energy of the first atomic bombs.
Small quakes are very common and large quakes rare—one or more years may pass between one magnitude-8 quake and the next one anywhere on the planet. Approximately, each increase in the magnitude of 1 causes a 10-fold decrease in the frequency of occurrence. But, moving the ground 10 times more takes about 30 times more energy, so most of the energy released and the damage is by the few big quakes rather than by the many little ones.
Predicting Earthquakes
Predicting Earthquakes
A tremendous amount of effort has gone into trying to predict earthquakes. This is because they are so destructive of life and property. Seventeen quakes are estimated to have killed more than 50,000 people each, and the worst, in Shaanxi, China in 1556, is estimated to have killed over 800,000. (In the U.S.A., the worst death toll was 503 in the San Francisco quake of 1906.) The magnitude 9.0 Tohoku earthquake in Japan in 2011 killed over 15,000 people, although the toll would have been far, far worse if the Japanese had not put so much effort into making strong buildings and otherwise planned to reduce the damages. Earthquakes usually kill by dropping pieces of broken buildings on people, but also by triggering tsunamis (big waves) or landslides, and by breaking gas lines or other things that cause fires.
The easiest way to “predict” quakes is to identify those places where quakes are likely to occur. This can be done from historical records, patterns of large, slow ground motions measured by GPS, and prehistoric geologic evidence. A lot of landslides of a single age in a region, or drowned forests related to land subsidence into the sea or large lakes, may indicate the effects of an earthquake. Once people know where quakes are likely, appropriate zoning codes for buildings can be enacted. Spending a million dollars on special engineering for a building to survive quakes is wise indeed near the San Andreas Fault, and helped Japan, but may not be necessary for central Pennsylvania, where big quakes are considered to be highly unlikely.
Other ideas have been advanced for predicting quakes. One is to use patterns of seismicity. If one section of a fault has had a quake every 20 years for the last century, you might expect another quake 20 years after the most recent one. Also, a fault that is slipping and moving may have lots of little quakes, whereas a locked fault that is building to a big quake may have no little quakes. So, you could use such a no-quake “seismic gap” in predictions. Such a pattern—historical repeats and a seismic gap—was used in the year 1984 to predict a quake in approximately 1993 near Parkfield, CA on the San Andreas Fault. The quake occurred in 2004. A possible explanation for the delay is that there are many faults in that part of California, and several big quakes occurred on faults near the San Andreas shortly before the expected quake. These certainly perturbed the state of stress at Parkfield, at least delaying its quake. (The other quakes allowed rocks to move, and even caused some faults to run backward compared to their normal behavior for a while, taking the load off and delaying the next quakes.) This illustrates the difficulty of predicting quakes. Perhaps, if the motions of all of the important blocks were monitored, one could model the whole system and do a better job of predicting where stresses are accumulating. Such work is ongoing, including important work by Penn State scientists, but reliable predictions are not yet available and may never be.
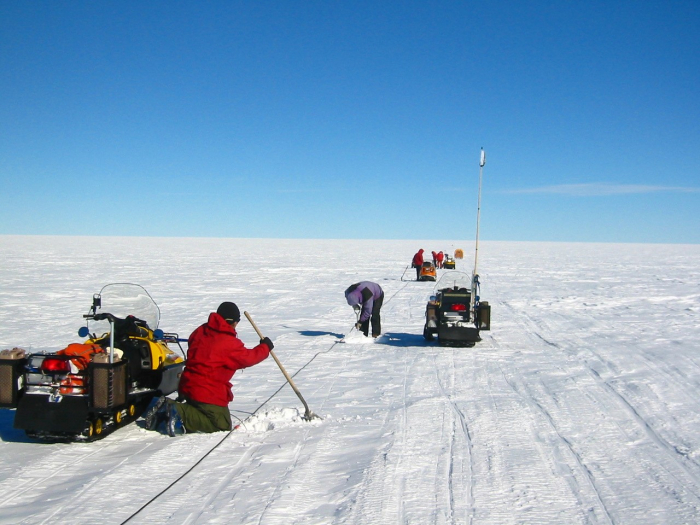
Even if pattern predictions of earthquakes can be made to work, the predictions are unlikely to be precise enough to tell us what we want. Knowing that a quake will occur sometime in the next few years, or even the next few days, does not allow us to get people out of old buildings, off bridges, etc., during the quake. The best hope for predictions within hours or minutes is to find premonitory events. As the stresses build toward failure, rocks may begin to crackle, groundwater may move around in the cracks so that water rises in some wells and falls in others, electric signals may be given off by the cracking rocks, and animals may act strangely. The difficulty is that groundwater rises and falls in wells for many reasons, strange actions in an animal may indicate bad feed, mating season, or any number of other causes, and other premonitory events of earthquakes also have non-earthquake causes. The subtle clues to an earthquake may be recognized using 20/20 hindsight, but no one has figured out how to read them in advance. The possibility is there, though, waiting for brilliant insights and hard work by some interested researchers. (After a big quake, lots of people typically show up claiming that they predicted it, but none of these “predictions” has ever been verified. And, many people, including some scientists, have made predictions of particular earthquakes to come, but again, these predictions have not proved to be useful.)
Take a Tour of Alaska and San Francisco
Visit Alaska and San Francisco to get a glimpse into the effects of major earthquakes.
A Rocking Review
A Rocking Review
Watch the Line
We've been having fun making Geosc 10 Rock Videos, proving that: 1) The material can't be too hard, because we can put it to music, and 2) There are really good reasons why Dr. Alley became a professor instead of trying out for American Idol. Most of the Rock Videos are written to review part or all of the material in a module, although we occasionally toss in a bit of extra stuff to make it rhyme. Here, we've borrowed the tune from the great Johnny Cash hit "Walk the Line" to sing the praises of seismologists (Dr. Anandakrishnan happens to be a famous seismologist...). This video reviews a bit about earthquakes and then shows some things we'll consider soon--volcanoes next week, and tsunamis the week after. (We never really worry about evil dictators in this course, but here's one for good measure.) So, rock on!
Video: Watch The Line - Parody of Johnny Cash's hit "Walk the Line" (3:07)
Hi I'm not Johnny Cash, but I wear the black for all the geoscientists helping us live in harmony with nature. This song is for the seismologists who watch a seismic line to warn about tsunamis, earthquakes, volcanoes, illegal explosions of atomic devices, and to find valuable things that make money. We keep a close watch on the seismic line, we keep our eyes wide open all the time. We have to find that early warning sign, so you're not dying, we watch the line. We find it very, very, easy to pay heed because tsunamis cross the ocean at great speed. For early warning systems, there's a crying need so you're not dying we watch the line. When Magma's moving beneath the volcano, the peak is swelling, and it's just about to blow. It shakes the ground, a warning from below, so you're not dying we watch the line. Sometimes earthquakes make patterns we can see. Locked seismic gaps endanger you and me, but knowing where might stop a tragedy, so you're not dying we watch the line. Evil dictators test their bombs at night. They think they've fooled us when they're out of sight, but when it shakes the ground we know it right, so you're not dying we watch the line. Things of great value are down there very near. It takes geoscientists to find them, this is clear, and you should know that it makes a great career, so you're not dying we watch the line and that does fine on the bottom line. Keeping you from dying and building up the bottom line.
Module 2 Wrap-Up
Module 2 Wrap-Up
Review Module 2 Requirements
You have reached the end of Module 2! Double-check the list of requirements on the Welcome to Module 2 page and the Course Calendar to be sure you have completed all the activities required for this module.
Reminder
Continue to work on Exercise #1. See Course Calendar for specific dates.
Supplemental Materials
Following are some supplementary materials for Module 2. While you are not required to review these, you may find them interesting and helpful in preparing for the quiz!
- Website: Death Valley National Park
- Website: Yellowstone National Park
Comments or Questions?
If you have any questions, send an email via Canvas, to ALL the Teachers and TAs. To do this, add each teacher individually in the “To” line of your email. By adding all the teachers, the TAs will be included. Failure to email ALL the teachers may result in a delayed or missed response. For detailed directions on how to do this, see How to send an email in GEOSC 10 in the Important Information module.
Module 3: Mountain Building & Volcanism
Welcome to Module 3
Introducing Mountain Building & Volcanism (Volcanoes!)
Mountains have always fascinated people, and we are especially fascinated when those mountains erupt, hurling melted rock through the air and endangering our lives. In Module 3, we will explore more about how mountains are built, and about volcanoes. We will start with a little history of humans and volcanoes, mostly for fun—you do not need to memorize how the legend of Atlantis is related to volcanoes, but you may be interested. Then, we will get into the important material, starting with what to do for Module 3 followed by the Module 3 Main Topics.
If you’re lucky to visit Italy, you may be able to stop at Pompeii and Herculaneum. These cities were buried, more-or-less intact, almost 2000 years ago (in the year C.E. 79) by a great eruption of the volcano Vesuvius. Most of the residents escaped when the volcano first became active, but well over 1000 people remained and were killed by the major eruption, mostly by the heat of glowing flows of gas and volcanic ash (called pyroclastic flows), which were roughly 250oC (480oF) at Pompeii. The ash that buried the cities piled up roughly 5 m (16 feet) thick. The Admiral Pliny the Elder was trying to rescue people and died in the eruption. His nephew Pliny the Younger, who was farther away and survived, left the following account:
They tied pillows on top of their heads as protection against the shower of rock. It was daylight now elsewhere in the world, but there the darkness was darker and thicker than any night…(t)hen came a smell of sulfur, announcing the flames, and the flames themselves…he stood up, and immediately collapsed…his breathing was obstructed by the dust-laden air.
--Pliny the Younger
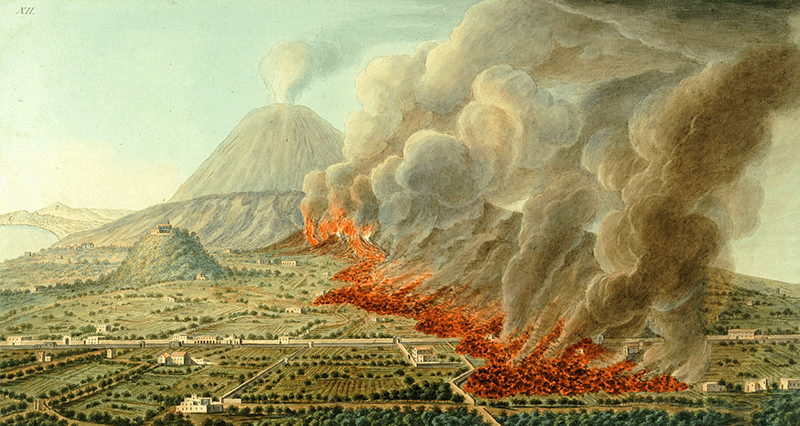
Many other volcanic eruptions have affected human history. And, the legend of Atlantis may involve a volcano. Supposedly, Atlantis was an island civilization "outside the Pillars of Hercules" and thus located in the Atlantic Ocean, where it was destroyed by an earthquake or tsunami (giant wave) about 11,000 years ago. The source of this information (according to Wikipedia and many other sources) is an account that Plato wrote in 360 BCE of information reportedly given to Solon two hundred years earlier by priests he visited in Egypt. Now, if someone told you that 200 years ago someone else had received information from yet another person regarding something that happened 9000 years earlier, would you immediately believe it? A lot of people apparently do; a search of Google for "Atlantis Plato" finds about 4.8 million matches, and not all of them are academic discussions.
A better question might be whether there really are islands that disappear below the sea. The answer is yes; many do. Some slide slowly downhill, at about the same rate as your fingernails grow, and disappear first beneath the waves and finally beneath the continents. Others suddenly explode, scattering themselves across the world. The Atlantis story actually may come from one such explosive volcanic eruption in the 1600s B.C.E. that destroyed most of an island at what is now Santorini in the Mediterranean Sea, and pushed a giant wave (tsunami) perhaps 300 feet (100 m), or more, high across the coast of Crete, probably contributing to the eventual demise of the Minoan civilization there.
Before we go any further, take a look at the following short video introduction by Dr. Anandakrishnan...
Video: Master of the Lamp (3:02)
Hey, groovy cats. Welcome to my pad. This is the G-Sci 10 '70s show, in which we're going to talk about vinyl, bell bottoms, platform boots, and most importantly, lava lamps. What? You mean you don't have a lava lamp? Run down to Uncle Eli's right now and get one. I'll wait. So what do lava lamps and G-Sci 10 have to do with each other? Well, they're a wonderful analog for this whole first section of G-Sci 10. The first section, if you remember from looking at the syllabus, is building mountains. And the short story for building mountains is heat from within the Earth. We're going to talk about tearing down mountains later on, but right now we're talking about building mountains, and the heat within the Earth is what drives that whole process. And a lava lamp is a beautiful example of that. Let's take a look at it. What we have here is a glass tube with some water in it, and then these globules of a slightly different material, and at the bottom we just have a light bulb that produces heat and heats up the bottom of this glass bowl. All right, I'm going to take this apart here, and just take a look on the inside. I don't know if this is going to be too bright for you, but we have a light bulb underneath here, and its only purpose is to produce heat and to light up this glass bulb a little bit. These green globules in here get heated up at the bottom, and as they get heated up, they get less dense. This is fundamentally what's happening inside the Earth. Rocks get heated up at depth because there's a lot of heat trapped inside the Earth. As they get heated up, they get less dense, and just like these lava lamp globules, they rise up like this one's doing right now, up to the surface of the Earth. When they get to the surface they cool off, and then just like this one, they sink back down into the Earth and the whole process goes on and on again. This inside the Earth we would call a convection cell. In a lava lamp, we call it cool.
Learning Objectives
- Explain how the creation of sea floor at spreading ridges is balanced by the destruction of the seafloor at subduction zones.
- Explain the different types of volcanoes that form at spreading ridges, subduction zones, and hot spots.
- Identify the different types of hazards caused by volcanoes and the increasing but imperfect ability to predict eruptions.
What to do for Module 3?
You will have one week to complete Module 3. See the course calendar in Canvas for specific due dates.
- Take the RockOn #3 Quiz
- Take the StudentsSpeak #3 Survey
- Submit Exercise #1
- Begin working on Exercise #2
Questions?
If you have any questions, send an email via Canvas, to ALL the Teachers and TAs. To do this, add each teacher individually in the “To” line of your email. By adding all the teachers, the TAs will be included. Failure to email ALL the teachers may result in a delayed or missed response. For detailed directions on how to do this, see How to send an email in GEOSC 10 in the Important Information module.
This course is offered as part of the Repository of Open and Affordable Materials at Penn State. You are welcome to use and reuse materials that appear on this site (other than those copyrighted by others) subject to the licensing agreement linked to the bottom of this and every page. Students registered for this Penn State course gain access to assignments and instructor feedback and earn academic credit. Information about registering for this course is available from the Office of the University Registrar.
Main Topics: Module 3
Main Topics: Module 3
Overview of the main topics you will encounter in Module 3
Many students find that they need a bit more effort to master the new material in this module than in Module 2 and when those students put in the effort, they reported that they enjoyed it and learned a lot!
Subduction
- We saw that the sea floor is made at spreading ridges such as the one through the Gulf of California that almost reaches Death Valley.
- The sea floor is basalt—just what you’d get if you melted a little bit of mantle rock, and let the melt rise and then freeze.
- Although the sea floor is generally less dense than the mantle, very old, cold sea floor can be dense enough to sink into the hot mantle.
- As new sea floor is made at spreading ridges, Earth does not get bigger and bigger like a balloon being inflated, so the old sea floor must be lost somewhere.
- The sea floor is lost where it sinks back into the mantle at Subduction Zones. All sorts of things happen there:
- Moving rocks stick, then slip, giving earthquakes;
- As the rocks go down, they are squeezed until the arrangement of atoms in the minerals changes to one that takes up less space; sometimes this rearrangement affects a lot of rock at once, giving an “implosion” earthquake (the deepest quakes may be of this type);
- Mud and rocks and even parts of islands are scraped off the downgoing slab, piling up, something like groceries at the end of a check-out conveyor belt (that’s what makes up Olympic National Park);
- Some mud and rock are carried down a bit and then squeezed back out, something like squeezing a watermelon seed between your fingers until it squirts out (you may find some of this squeezed-back-out material at Olympic, too);
- Some mud and water and rock are carried even farther down, where the water lowers the melting point of the rocks (just as adding water to flour speeds cooking in the oven);
- A little melted rock is generated from this subducted water and rock, and the melt rises and feeds volcanoes (such as Crater Lake and Mt. St. Helens) that form lines or arcs near continent edges or offshore;
- This melt is richer in silica and poorer in iron than the basalt it comes from, and forms a rock called andesite (the name was chosen because the volcanoes in the Andes were formed this way), often with granite forming under the volcanoes from melt that did not erupt.
A Bit of Review
- The Earth includes a colder, harder upper part called the lithosphere, which includes the crust at the top and the upper mantle beneath, and which floats on the deeper, softer part of the mantle called the asthenosphere; convection occurs in the asthenosphere;
- The lithosphere is broken into a few big plates and many little ones; most “action” is at plate edges;
- Plates pull apart at spreading ridges, splitting continents to make space for volcanic activity that makes basaltic sea floor;
- Plates come together at subduction zones, where the cold sea floor is dense enough to sink into a hot mantle, where scraped-off materials pile up to make edges of continents (Olympic National Park, etc.), and where water and sediment taken down lower the melting point of rock, feeding silica-rich (andesitic) volcanoes;
- Plates also may slide past each other, moving horizontally at transform faults, such as the San Andreas;
- Earthquakes are generated by stick-slip behavior where some rocks move past other rocks; earthquakes also may occur deep in subduction zones where minerals being taken down rearrange suddenly into denser forms.
Introducing Volcanoes
- Towers of rising rock from very deep in the Earth (often from the core-mantle boundary) feed “hot spots;”
- Plates drift over the tops of these hot spots, and hot spots occasionally punch through, making lines of volcanoes, which often are oceanic islands (seamounts);
- Hotspots are from the mantle, and their basaltic composition is very similar to sea floor;
- If we could look down into the mantle, when a new hotspot is first rising and before its top reaches the surface, it looks like a mushroom; when it reaches the surface, the head feeds huge (state-sized) lava flows called flood basalts, and after the flood basalts form, the stem continues to flow to make lines of volcanoes ;
- Hawaii is the classic example of a line of hot-spot volcanoes (its flood basalt has already gone down a subduction zone);
- Yellowstone also is a hot spot; the head of the Yellowstone hot spot covered eastern Washington and Oregon with basalt, but the recent eruptions at Yellowstone have come from lava that was modified coming through the crust so that more silica is erupted than for Hawaii.
Volcano Characteristics
- In melted rock, silicon and oxygen make SiO4 tetrahedra that try to polymerize (stick together in chains, sheets, etc.) to make lumps;
- The lumpiness can be reduced by making the melted rock hotter or adding iron, both of which help basalt flow easily and not explode;
- This helps Hawaii be a much-wider-than-it-is–high shield volcano, because the flows spread out easily;
- The lumpiness of melted rock can be reduced by adding volatiles (water, CO2 , etc.), but when these escape near the surface, the lava gets lumpy again and won’t flow easily and may plug the system; more volatiles may get trapped beneath the plug and then explode;
- This helps build steep stratovolcanoes, composed of alternating layers of steep (“lumpy”) flows and pyroclastics (blown-up bits from explosions).
Volcanic Hazards
- Volcanoes are hazardous in many ways, including:
- Pyroclastic flows, deadly hot, fast-moving rock-gas mixes;
- And pyroclastics, big rocks that can fall on your head if you are close to an eruption, or smaller ones that can plug up jet engines on a passing plane;
- Also, poison gases, that can kill many people very quickly;
- And landslides and mudflows, that can bury whole cities;
- Tsunamis, giant waves that can devastate coasts;
- Climate change, especially short-term cooling from particles blocking the sun and frosting crops, but over geologic history, there have been terrible extinctions from too much heat from long-term volcanic carbon dioxide (the recent changes in carbon dioxide in the air are from humans, not volcanoes, as we will see later);
- These hazards are especially dangerous from subduction-zone volcanoes; the flows on Hawaii mostly block roads and burn houses, and usually, you could run away from one and stay safe.
Predicting Volcanoes
- It is fairly easy for geologists to figure out where volcanic eruptions are likely;
- Often, but not always, it is possible to figure out that an eruption will happen in the next days or hours;
- Predictions are valuable and have saved many lives, but are imperfect and probably will remain so far into the future;
- And people get mad if you tell them to leave and then nothing happens;
- The United States Geological Survey especially handles predictions in the USA; they are highly valuable and greatly under-appreciated;
- Lots of people continue to build and live where dangers await.
Crater Lake
Crater Lake
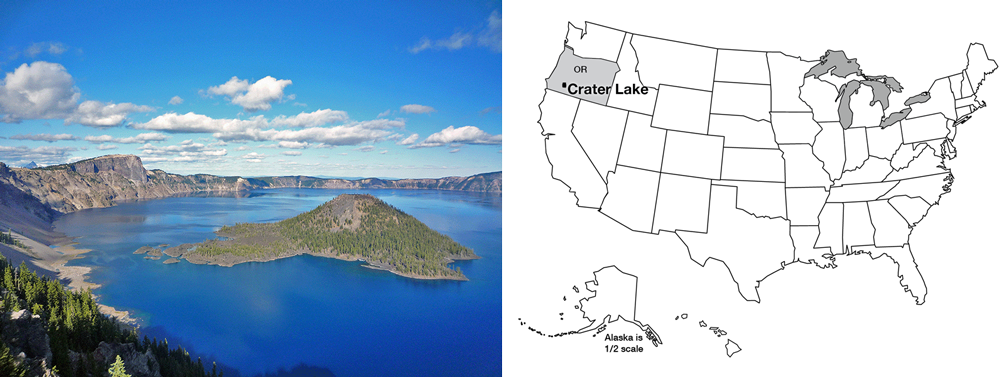
Right: Location of Crater Lake in Oregon
Right: R. B. Alley © Penn State is licensed under CC BY-NC-SA 4.0
We will start with a little information on a truly wonderful National Park that you may wish to visit someday, and then move into important information on volcanic arcs and the “Ring of Fire”. Crater Lake, at 1932 feet (about 600 m) deep, is the deepest and probably the cleanest lake in the United States, and surely among the most beautiful. Crater Lake sits in a great volcanic crater or caldera, 5 miles (8 km) across, formed when Mt. Mazama experienced a cataclysmic eruption about 6600 years ago. That massive eruption laid down ash that is 200-300 feet thick (almost 100 m) on the flanks of the volcano; the ash forms a layer that has been preserved and is recognizable in the sediments in surrounding lakes, including in Yellowstone Lake almost 600 miles (1000 km) away, and a little of the ash has been found in Greenland ice cores.
The peak of the volcano had risen more than a mile above its mile-high base on the highlands of southwestern Oregon, but the great eruption removed about 4000 feet (1200 m) from the mountain’s height. About 16 cubic miles (40 cubic km) of rock were blown away. Glaciers had flowed down from the mountain peak; today, the glacial valleys can be followed upward until they disappear at the caldera rim. Although 50 feet (15 m) of snow falls in a typical year now, melting in the summer is more than sufficient to remove all this snow, so no glaciers exist. A tongue-in-cheek Christmas celebration on Aug. 25 substitutes for the snowbound December event.
After the great eruption, lava flows began building Wizard Island. If the water were removed from the lake, you could see that Wizard Island is roughly 0.5 mile (0.8 km) high. No permanent streams feed into the lake; the great rainfall and snowfall in the crater are balanced by evaporation, and by seepage through the rocks and eventually out the sides of the volcano as springs. With no streams supplying sediment, the lake is exceptionally clear and clean. Aquatic moss receives enough sunlight to grow 425 feet (130 m) below the water's surface. When trout were stocked in the lake, freshwater shrimp were stocked first because otherwise, biologists feared that the trout would have nothing to eat.
Take a Tour of Crater Lake National Park
Want to see more?
Visit the Crater Lake National Park website. While you are not required to review this, you may find it interesting and possibly even helpful in preparing for the quiz!
The Ring of Fire
The Ring of Fire
We will discuss much more about volcanoes soon. For now, note that Crater Lake sits atop one of a string of volcanic peaks: Lassen Volcanic National Park and Mt. Rainier National Park preserve other peaks in the Cascades range. Mt. St. Helens, Glacier Peak, and several others are protected federally. These peaks line up in a row, called a volcanic arc, parallel to the coast. A similar arc sits along much of Central America and forms the Andes of South America. And similar arcs also occur as island chains—the Aleutians, Japan, and others. In fact, the Pacific Ocean is almost entirely encircled by such volcanic arcs, forming the “Ring of Fire”.
Video: Ring of Fire (5:37)
We saw in the last unit that there are spreading ridges out in the ocean that are making seafloor that moves away from them. And it might have bothered you at that time - the Earth is not being blown up, inflated like a giant balloon. So if we're making sea floor all the time, where does it go? And the answer is it goes back into the Earth to replace what is coming out at subduction zones.
And this is a diagram of a subduction zone that we have swiped from the United States Geological Survey. It has a number of details, maybe more than we need, but the down-going slab, the friction that it makes, tends to drag down the sea floor and make low spots that we call trenches. Those are often filled with very deep water -- the deepest spots in the world ocean. But sometimes they get filled with sediment and you see the accretionary wedge there. That's the scraped-off stuff. And sometimes this scraped-off stuff can make a little Coastal mountain range. We'll see that at the Olympic and the coast ranges of California. You also end up in such systems that the downgoing slab, it takes down some water, the water lowers the melting point of the deep rocks, and that allows magma to rise and then to feed volcanoes. So you have these volcanic arcs running along, parallel to the trenches. And you also find in such systems, that there's a lot of sticking and slipping and sticking and slipping that makes earthquakes as you go down. So these are features that you see in subduction zones.
Now, where do you find subduction zones? A lot of them are lined up around the Pacific Ocean in what we call the "Ring of Fire". And so you can see a diagram of the Ring of Fire here. These blue things are the trenches, including the deepest water in the world ocean, at the Challenger Deep. There is another trench over here, it just happens to be full of sediment so you don't need to worry about this, and later we'll sing about the Ring of Fire. So there's, there's the Ring of Fire for you.
Now we'll take a better look at this, a little more detail and more data. There's a lot of things in this figure. First of all, if you come over here on the right towards the Caribbean, you'll see this big red band. And there are several of such big red bands on this. These are the subduction zones that are close to the U.S. Holdings. So that's near Puerto Rico and the Virgin Islands and they're part of the U.S. and so these are near U.S. land and these are just a special concern of the United States Geological Survey which made this map. If we then look at other things on this map, there is some more red on here, and that's little tiny red dots. And you'll see a whole bunch of little tiny red dots for example, just below what I drew there at the top. All of those little red dots are volcanoes and you see volcanoes in the Aleutians where I was. You see them out in the Cascades, you see them in Central Mexico, you see them in Central America, you see them down the Andes. There's a whole lot of places around here that you can see volcanoes popping up. Also on this plot you can see earthquakes. So the black dots, such as the ones just inland from where I'm drawing down in the lower right there next to South America, those are all earthquakes. So this plot is showing you where the earthquakes are and where the volcanoes are, which ones are in the U.S. The very light red line out in the middle, these are the spreading ridges and then later we'll come back and we'll look at Hawaii and the hot spot chains. But so now you can get a pretty good view of what many of the features are that we have to worry about when we talk about the Ring of Fire.
We're gonna do one more view of things here. This is a figure that was generated by Gavin Hayes, who is a graduate of Penn State, and works for the United States Geological Survey. And what's shown here is not just the Pacific Ring of Fire, which is sort of over around this, right, so that's in the Pacific. Now you see all of the subduction zones on the planet. And the funny sort of coloring here, the yellow, the zeros, mean that the downgoing slab, the downgoing sea floor, has just started down. It's right at the sea floor. And you'll see it, say, over where I'm drawing now, it starts down under South America there. The deeper one, 600 kilometers, that's 400 miles almost, and it goes down and gets deep most of the way under South America towards the Atlantic. You can similarly see other places that the slabs are going down from shallow to deep and this one you'll also see the subduction zone that's continuing to Vesuvius and Aetna and the pushing up the Alps there. So we're going to look at subduction zones here.
Sitting offshore of the Ring of Fire, is a ring of trenches, which include the greatest depths of the ocean. The trenches parallel the volcanic arcs. Some trenches, which sit near continents, are nearly filled with sediments dumped off the continents, but other trenches are almost free of sediment and so have very deep water, to almost 7 miles (11 km) deep. (Figuring out depths is often complicated by sediment. The surface of Death Valley sits more than two miles lower than the adjacent peaks of the Sierra Nevada. But below the salt flats of Death Valley there are sediments as much as three miles thick, materials that were eroded off the tops of the peaks, so the valley has dropped by much more than three miles relative to the peaks.)
The trenches and volcanoes that ring the Pacific are a few of the many clues that tell us about subduction zones, and help solve a problem that might have been bothering you from Module 2. If sea floor is made at spreading ridges and then moves away, where does it go? The earth is not getting bigger. (Well, meteorites are adding a tiny, tiny, tiny bit, but not nearly enough to account for sea-floor spreading.) So, the sea floor must be disappearing somewhere, going back into the Earth.
Indeed, almost all the sea floor is younger than 160 million years old, but the continents contain rocks as old as almost 4 billion years, showing that the sea floor is being consumed before it gets very old. (Remember, before the class ends, we’ll discuss how geologists date rocks.) (And remember that when a geologist dates a rock, it involves physics or chemistry but not dinner or a movie.)

Credit right: Swanson, Don A., USGS Volcano Hazards Program, Public Domain
More clues to what happens at subduction zones
The sea floor is made of basalt. This is just the kind of rock that would be made if you melted a little bit of the deep, convecting rocks of the Earth’s mantle, and let that melt float up to the surface and “freeze” (cool until it solidifies). If you take basalt, plus a little ocean sediment and some ocean water, and heat them enough to cause a little melting, and then let that melt come to the surface and freeze, you obtain a rock called andesite with a little more silica and a little less iron and magnesium than basalt, lighter in color and lower in density than basalt. Interestingly, the dominant rock in the walls of Crater Lake, and in the other Cascades and Ring-of-Fire volcanoes, is andesite (named after the Andes, which are part of the Ring of Fire), giving you a clue to how these peaks were formed. (Some of the melted rock freezes below ground, making granite or similar rocks.)
If the sea floor were plunging under the continents and melting to make andesite, you might expect that occasionally the downgoing rocks would get stuck and then break free, making earthquakes. Indeed, a three-dimensional map of earthquakes shows that shallow ones occur near the trenches, and the quakes are progressively deeper inland beneath the volcanic arcs, along the descending slab of old sea floor. The great 1964 Alaska earthquake was such an earthquake, which happened where rocks of the Pacific Ocean floor plunged to the north under coastal Alaska and the Aleutian chain. The more southerly of the earthquakes there occur at shallow depths, with the earthquakes getting deeper to the north, occurring along the downgoing rocks. The disastrous 2011 Tohoku earthquake in Japan was of the same type.
Earthquakes make waves that travel through the Earth, at speeds that depend on the characteristics of the rocks, including their temperature. Careful analysis of the speed of the waves, which can be learned from the time it takes for a wave to get from an earthquake to a listening device (a seismometer), shows the higher speeds of the cold slabs going down into the hotter mantle. As these initially-cold downgoing slabs of rock are heated, with their water and sediment, a little melted rock (magma) is produced. (Interestingly, wet rocks melt at a lower temperature than dry rocks, just as adding a little water to flour and yeast speeds cooking of bread in the oven.) When the melt rises to the surface and cools, andesite forms, such as is seen around Crater Lake, in the Andes, or in the Aleutian volcanoes.
So, the sea floor is made at the spreading ridges. It is hot and low-density initially, but cools and contracts as it gets older and loses heat to the colder ocean water. When the sea floor becomes cold and dense enough, it can sink back into the mantle, and we call the place where it sinks a “subduction zone”. The sinking sea-floor slab drags along a little sediment and water. The slab warms because of friction with the surrounding rocks and heat flowing from those surrounding rocks into the colder slab. This causes the sediment and a little of the sinking slab to melt, and the melt rises to feed the volcanic arcs. Old sea floor is going down around much of the Pacific Ocean, and in a few other places such as beneath the Caribbean, and beneath portions of the Alps. Wherever this happens, andesitic volcanic arcs form as shown in the video and figure below. The subduction beneath the Alps created the volcanoes Vesuvius that buried Pompeii, and Santorini that may have destroyed Minoan civilization.
Video: Subduction Zones (2:46)
So let's do a little review on what subduction zones are and what they mean for us. Recall that in the deep earth, there is hot, soft rock which is undergoing convection and that some of that convection leads to mid-ocean ridges. The hot soft rock comes up and it makes ridges and the ridges make seafloor and the sea floor moves away from those ridges. The Earth is not inflating like a balloon so if you're making seafloor somewhere it has to be disappearing somewhere else and that goes down at subduction zones. Subduction zones cause a number of features. If they are not filled with sediment, they drag down the rocks where they start down and they make deep trenches and the deepest water in the world oceans happens to be at such trenches. Very often though, there is sediment being eroded from the neighboring land or volcanic ark and so the sediment comes down in rivers and it fills up the trenches as it happens in the west coast of the U.S. off of Washington and Oregon. When that sentiment is dragged down the subduction zone and any sediment from out under the ocean, a lot of it is scraped off and it may make a pile that you would see as the coast ranges or the Olympic out in the western U.S. A little of that sediment is dragged down along the subduction zone together with a little of water and the water and the sediment lower the melting point down there and that allows the rocks to melt, which makes magma, which rises and that eventually feeds to Mount St Helens and Crater Lakes and other Crater Lake and other volcanoes that line up in an arc along there. You also end up with a lot of earthquakes in the system, so this can get stuck and then break, and stuck, and then break. There is a possibility too, as the Rock is taken way down, that it changes into other forms, other minerals, and then occasionally that may cause a sort of implosion that shakes the ground when it happens and makes a really big, really deep earthquake. And so you see, a whole lot of different things can happen at subduction zones. We see volcanic hazards, landsides from steep slopes, we see giant waves made by earthquakes that we call tsunamis. So subduction zones are really, really important.
The following diagram shows the same process as described in the video above. Take a look and see if you would be able to describe it to a friend.

Olympic National Park
Olympic National Park

Right: Map showing the location of Olympic National Park
Take a Tour of Olympic National Park
The Olympic Peninsula juts out into the Pacific Ocean, separated from Seattle by Puget Sound. Moisture-laden winds off the Pacific dump more rain and snow on the Olympic than anywhere else in the lower-48 United States. Great old-growth forest trees—Sitka spruce, Douglas fir, etc.—tower up to 300 feet (almost 100 m) above the forest floor, where butterflies flit past crystalline streams and cascading waterfalls. Along the coast, sea lions bask on offshore stacks, while urchins and starfish populate tidal pools. On the “high peaks,” numerous glaciers form and flow downhill. More snow accumulates than melts on the peaks. On most mountains, you have to go much higher to find summertime snow, but the huge winter snowfall on the Olympic allows the peaks to be snow-clad year-round despite rising less than 8000 feet (about 2500 m) above sea level. (Those glaciers are shrinking because of human-caused climate warming, as we will discuss later in the semester.)
Olympic National Park is a bit unusual in that it was established as much for biological reasons as for geological—to protect the Roosevelt elk that live on the peninsula. (The elk, named after Theodore Roosevelt, were critical in obtaining national monument status, which was signed by President Theodore Roosevelt. Later, the upgrade to national park status was signed by President F.D. Roosevelt. The Roosevelt elk is the largest of the elk subspecies in the country. Some consideration was given to naming the park Elk National Park before Olympic was chosen.)
The geologic story of the Olympic is somewhat shorter and less dramatic than for most of the national parks. The rocks of the Olympic are almost all young—less than 40 million years. (Again, please bear with us—we will justify these numbers before the course ends!) Before that, the coastline must have been farther to the east, perhaps in North Cascades National Park, and before that even farther east.
Want to see more?
Visit the Olympic National Park website. While you are not required to review this, you may find it interesting and possibly even helpful in preparing for the quiz!
The Olympic Grocery Store
The Olympic Grocery

You’re standing at the grocery-store checkout. You put a bag of potato chips on the conveyor, and off they go, followed by a case of Pepsi, three loaves of bread, a watermelon, a box of Ho-Hos, and a sack of potatoes. Then, you realize that there is no bagger working and that everything is piled up at the end, in a BIG mess. That mess is a good model for the Olympic Peninsula and the whole coast from there up to Alaska.
The rocks of the Olympic Peninsula are a mixture of sea-floor basalts and the sorts of sediments that accumulate today off the coast and fill the trench there. Rivers draining the peninsula and other parts of the west coast carry great loads of sediment down to the ocean. Much of that sediment piles onto the sea floor that is slowly moving beneath the continent, a conveyor belt that drags some of the water-saturated sediment down to melt and then erupt from volcanoes. But, most of those sediments are “scraped off” on the way down, just as at the grocery store. The Olympic Peninsula is the offscrapings. Most of the rocks have been bent and twisted from the attempt to shove them under the continent (think of the potato chips after the milk jug hits them!). Some of the Olympic rocks have been heated a good bit—the conveyor belt took them part way down, but then they were squeezed back out.
And here's another fun way to understand subduction zones.
Video: Olympic Subduction Zone (:40)
You may think that this looks like an ordinary sandwich cookie but in fact, this is a subduction zone demonstrator. Here is the Pacific Seafloor and on top of it is sediment, wind-blown dust and dead shells, and other things sitting on top of the basaltic sea floor and it's going down the subduction zone under the state of Washington and Oregon, and as it does some of the sediment is scraped off and is making a pile and that pile is the coast ranges and the Olympic Peninsula.
Our emerging picture of plate tectonics is that the earth is heated inside, softening the deep rocks of the asthenosphere enough that they can move in great, slow convection currents that transfer heat from deep in the earth to near the surface. Heat is conducted through the upper rocks, or is erupted through them by volcanoes, and eventually is lost to space. But, the upper rocks in most places are cold enough that they tend to break rather than flow—they are brittle. These brittle rocks form the lithosphere, which includes the crust and the uppermost mantle. The rocks of the crust in continents are rich in silica (often like andesite or granite in composition), making them light in color and low in density so that they float on the deeper rocks and are rafted around on them by the moving convection currents. The sea floor rocks in the crust are between the continents and the mantle in composition and typically are basalt. The sea-floor rocks are usually intermediate between continents and mantle in density as well, but if the sea-floor rocks are cold enough, they will be slightly denser than the hot mantle. Then, the sea-floor lithosphere consisting of the sea-floor crust plus a little attached mantle will sink into the asthenosphere of the deeper mantle.
Geologic Plates
The lithosphere is broken into a few big rafts, called plates—eight big ones plus some smaller ones, depending a little on how you define “big” and “small”—that float around on the convection cells below. Plate boundaries include spreading ridges where the plates move apart (remember Death Valley and the mid-ocean ridges), and subduction zones where the plates come together and one side sinks under the other. You might imagine that if plates can come together or pull apart, they must be able to slide past each other as well, which is what happens at the San Andreas Fault in California (we met it when we were discussing earthquakes); such slide-past boundaries are often called transform boundaries or transform faults (see the figure below). You might worry that sometime, two continents would run together; we’ll meet that soon when we visit the Great Smoky Mountains.
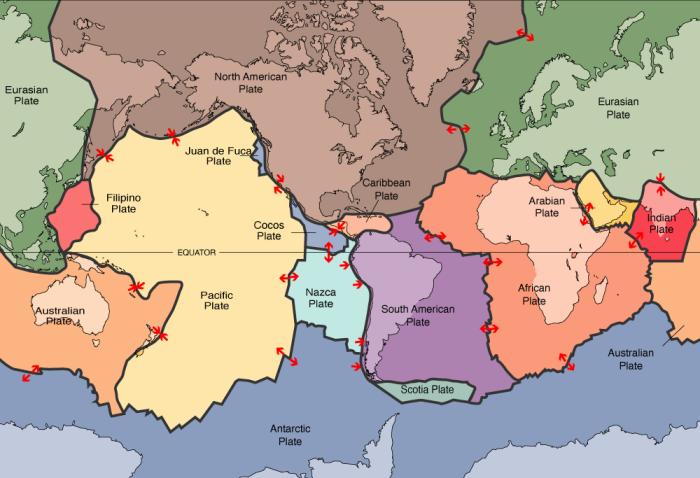
The lithosphere and asthenosphere are solids, but a little melted rock may occur in places in the asthenosphere, and some of this may leak out where plates are pulled apart, feeding basaltic volcanoes. And, the water taken down subduction zones can stimulate a little melting, feeding andesitic volcanoes that line up in arcs above the downgoing slabs of the subduction zones; examples of these volcanic arcs include the Cascades, Aleutians and Andes. Continents are a collection of scum formed from freezing of material that melted in the mantle and then moved upward and froze; continents are too low in density to sink back into the mantle. Continents grow as the conveyor belt from the mid-ocean ridge to the subduction zone brings in sediments and islands and what-not, or when andesitic volcanoes erupt on continents, or when andesitic volcanoes form an arc in the ocean that then collides with a continent (sometimes the site of subduction moves, and the volcanoes find themselves on the conveyor belt, or they hit a different continent). Because much of the sediment comes from the continents themselves, the growth of continents is not fast—material eroded from the continents falls on the conveyor and is added back at Olympic or erupted back at Crater Lake.
Mt. St. Helens
Mt. St. Helens & Volcanic Hazards; More to Worry About
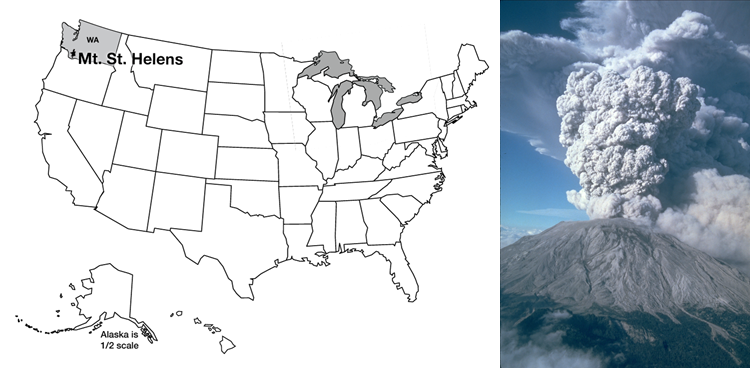
(right) Mount St. Helens by Mike Doukas, USGS (Public Domain).
Take a Tour of Mount St. Helens
The great eruption of Mt. St. Helens in May of 1980 is ancient history for most of you, from before you were born. That is often the way with geological disasters—they are far enough apart that we forget... and the reminder is often unpleasant.
The eruption blasted out at over 300 miles per hour and over 600ºF, followed by even hotter blasts at more than 1300ºF. Deaths included 57 people, nearly 7000 large animals (deer, elk, bear), countless smaller creatures, and enough trees to supply lumber for 300,000 homes. Most eruptions build volcanoes, but a few really dramatic ones blow the top off - this one lowered the peak by more than 1300 feet.
Mt. St. Helens, in southwestern Washington, was in some ways the queen of the Cascades Range. Beautifully symmetric, and snow-capped, it had been called the Fujiyama of the Pacific Northwest. Scores of people flocked to St. Helens’ flanks to hike, camp, ski, and generally enjoy the environment. But, all that changed in 1980.
(It may seem weird to you that we are about to focus on an event from before most of you were born, from 1980, when larger volcanic eruptions have happened more recently. But, St. Helens is the largest eruption that has occurred in the lower-48 states of the USA since before the country was formed, is the easiest eruption site to get to and observe, and really is awesome. Professor Alley’s elder daughter, Janet, was a ranger there one summer and recommends that you include Ape Cave if you visit. Our goal here is to help you see just how immense the eruption's effects really were—and, we strongly recommend that you visit if you can.)
Mt. St. Helens has also been the most active of the Cascades volcanoes over the most recent centuries. In early 1980, the volcano clearly was “waking up”. Earthquakes shook it almost continuously, including special “harmonic tremors”, similar to those sometimes caused by fluid flow in pipes, which showed that liquid rock was moving up from below. Small eruptions occurred, and hot springs and fumaroles (steam or gas vents) became increasingly active. The north side of the mountain was bulging, blowing up like a balloon as the magma moved into it. Scientists were scrambling to study the volcano and predict its course. They recommended evacuation for safety, and most people (but not all, including some scientists) were moved out of the way. Penn State professor Barry Voight warned that the huge bulge on the north side of the volcano would fail, unleashing a giant landslide and a devastating eruption.
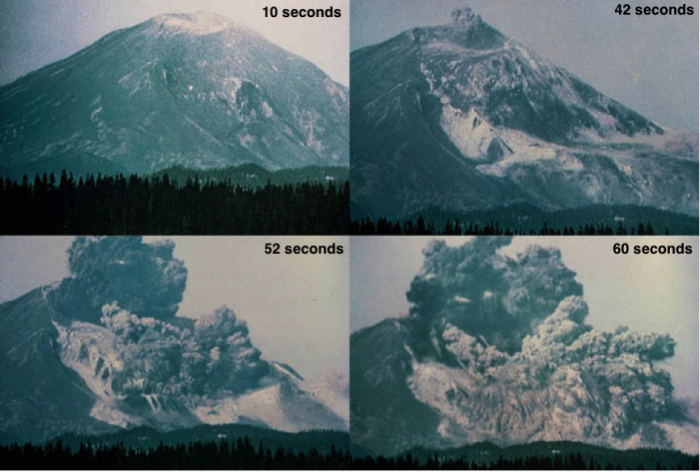
On the morning of May 18, 1980, Professor Voight’s prediction came frighteningly, awesomely true. The bulge failed. A large earthquake either caused, or was caused by, the failure of the north side of the mountain in a giant landslide. Like pulling the cap off a hot, well-shaken soda bottle, the liquid beneath flashed into a froth, driving an eruption 12 miles (20 km) high. A shock wave knocked over full-grown trees in an area of 20 x 10 miles (32 x 16 km). The landslide eventually poured more than 100 million cubic yards of rock material down the Toutle and Cowlitz Rivers, raising the floor of the North Fork of the Toutle as much as 600 feet (200 m), and sweeping roads and houses downstream, with the debris reaching and clogging the shipping channels of the Columbia River. The Toutle floor now sat higher than the smaller streams that fed it, and lakes began to form; only quick work by the Army Corps of Engineers prevented those lakes from overtopping the mud that was damming them, then cutting quickly down through the mud and releasing further floods. (We will revisit the dangers of such mud-dammed lakes in Module 5.)
In total, the Corps of Engineers spent $250 million removing mud dams, clearing shipping channels, and doing other critical work. 57 people were killed in the blast and landslide; some were buried under hundreds of feet of steaming mud and their bodies were never recovered.
President Jimmy Carter scowled at the disaster from a helicopter. Disaster planners pontificated. And in the shadows of the other Cascades volcanoes, people continued building houses in regions of known volcanic hazard.
The Mt. St. Helens Volcanic Memorial today has little in common with conditions pre-1980. The center of the volcano was lowered more than 1/2 mile (nearly 1 km) during the eruption, with the missing rock spread over the surrounding countryside, forming a visible layer as far as 900 miles (1500 km) away. (Professor Alley and his wife Cindy were driving in Alberta, Canada during the summer of 1980, on a great, seven-week, see-the-national-parks-in-a-Chevette-with-a-tent honeymoon when a secondary eruption of Mt. St. Helens put enough ash in the air to halt traffic because of reduced visibility, hundreds of miles from the volcano.) Many of the trees knocked over by the blast still lie there—hundred-foot-long toothpicks pointing in the direction of the searing winds of the blast. Among these dead trees, however, salmonberry, fireweed, and young firs are pushing skyward, elk are grazing, and coyotes are searching for rodents. In some places, salvage-logging of the downed trees was allowed. In some of those places, erosion accelerated, large gullies developed, and the return of vegetation was slowed. In the crater of the volcano, a new lava dome has formed. (Go back and see the slideshow for photos of some of these details.)
Optional Viewing
Below, you'll see two time-lapse images of Mount St. Helens, taken many years after the great eruption and showing how the volcano continued to evolve. Watch them if you're interested. The first one shows it squeezing slowly upwards like toothpaste from a very hot tube, and amazingly, a glacier sits behind it, fed by the great snowfall and the avalanches down into the crater, and partially protected from melting by the debris that falls into it with the avalanches. The second one shows changes in the lava dome and Crater Glacier. The heat of the volcano does melt some of the glacier’s ice from below, but not fast enough to balance the supply of snow from above.
Video: Time-lapse images of Mount St. Helens dome growth 2004-2008 (1:27)
Video: Time series of dome & glacier growth at Mount St. Helens, WA (00:20)
Want to see more?
Visit the Mount St. Helens National Volcanic Monument website. While you are not required to review this, you may find it interesting and possibly even helpful in preparing for the quiz!
Hot Spot Volcanoes
Hot Spot Volcanoes
Volcanoes occur where melted rock rises to the Earth’s surface. Almost all volcanoes are associated with one of three settings—pull-apart margins (spreading ridges), push-together subduction zones, and hot spots. We’ve already met the volcanoes that produce sea floor at spreading ridges, where low-silica basalt has erupted, and we have seen large, explosive volcanoes (called “stratovolcanoes”) such as Mt. St. Helens, made of higher-silica andesite at subduction zones. Next, we will look at wide, flat, basaltic shield volcanoes at hot spots. (Smaller volcanoes called cinder cones can form with stratovolcanoes or shield volcanoes, or in some other places; you can learn a little more about them in the Enrichment.) The short video below shows the shield volcano Mauna Kea in Hawaii, the stratovolcano Mt. Rainier, and the cinder cone Sunset Crater in Sunset Crater Volcano National Monument. We traced them for you, and put all the tracings on the same figure, to show you how different the shapes are.
Video: Volcano Shapes (2:47)
We're going to look at various types of volcanoes and we're going to start with their shapes which are sort of telling us a lot about what's going on. So this is Mount Rainier. It is a strata volcano. It is steep, it is big, it is looming above Tacoma in this picture, in the state of Washington just south of Seattle. And if we trace it with this blue line then you can sort of see what the outline looks like. Now it turns out that Mount Rainier used to be even taller and steeper. The top slid off to make a massive Landslide about 5700 years ago. So here you see both the modern and the before that landslide. Next we'll look at Mauna Kea. This is Hawaii. It is a shield volcano, not so steep. It is even bigger. Mount Rainier rises about two miles above its base. Mauna Kea Hawaii starts at the sea floor and rises more than six miles above its base. But you can see rather clearly, it is not so steep up here at the top. So if we resize them so they fit in the same figure now you can see the comparison between Mount Rainier in blue and Mauna Kea in the redder one, much lower there. And if we put the top back on Mount Rainier you can now see that the comparison is very striking. These are the two most important types we're going to worry about. Just for fun, we'll add one more here. If we go back to Mauna Kea, there are little Cinder Cones up on the side of it that are pointed out with the green arrows. There are cinder cones at Mount Rainier, there are cinder cones at other places, such as Sunset Crater in Arizona. They are made of loose pieces, little bits of melted rock went through the air, they froze, they fell down, and they made a pile. If you try to walk up the side, it tends to roll out from under your feet and it's hard to walk up. And if we outline that with this green one here, we can put them all on the same picture here now and the cinder cone is sort of in between, with the shield volcano very flat and the stratovolcano very steep, especially if we put the top back on Mount Rainier. So, there are some volcano shapes and the shapes are telling us about processes about what goes on to make those volcanoes.
Hot Spots
Video: Hot Spots (3:36)
I'm gonna go do hot spots now. This is a cutaway view of the earth and there is heat being generated way down in the core from radioactivity and other things that are going on. But the core is so dense that it can't rise by itself. So the heat comes up and it warms the base of the mantle, and when that gets hot enough, that starts to rise, and it will be coming up, and at some point, when it's coming up it might look something like this. Sort of having a mushroom head that we can see there. And that is headed up towards the surface. Later, if we come look at it, you'll have the heat down here. The thing will be rising up there, and the head will have made it up to the top and there'll be immense outpourings of basaltic lava going over the surface, in what we call a flood basalt. But eventually, that flood basalt will be carried away by the drifting plates and you will be left with something that looks more like this. It's coming up from below. It comes up here, and you have heat there that is trying to leak through. Now let's go to a different diagram that shows that. And we can do this. And so here is, coming up from below, the hot spot. It's trying to break through the lithosphere up here, and it does so in particular places, such as Hawaii, there at Mauna Loa and Kilauea. And, you might have two or three places that are active once, but eventually, as a Pacific Plate moves over, these will be carried away, and a new one will break through, and then a new one will be broken through as that comes along. And this has been going on for a very long time. This one out here is, for example, Kauai, it was sort of five million years ago, this was back here being active. And so this has been going on, and it's all a fascinating thing, and if you back up now, what do we see? The previous picture that you were looking at was right down here. That's Hawaii, and this is way out in the Pacific, and what we're going to do now is zoom in just a little bit on this so that you can see it more clearly. And so here we will go. And so the previous picture was down there in the corner in Hawaii. The flood basalt that came from the start of the Hawaiian hot spot is already gone. It has gone down the subduction zone and been turned into volcanoes or other things up here in the Aleutian Arc. This is sort of 81 million years since this was down here at the active hot spot. This corner here is about 43 million years old. So this has been going on for a long time. The fact that the angle changes is probably because the direction that the plate is moving changed, about 43 million years ago. Although it's possible there is a little bit of motion of the hot spot as well. And so there you see a hot spot.
The drifting tectonic plates of the lithosphere are thin—roughly 100 miles (160 km), although with notable variation—compared to the 4000 miles (6000 km) radius of the Earth. Hot spots come from deeper, with the big ones from about halfway down near the base of the mantle just above where it meets the outer core. There, a rising tower of hot rock sometimes forms and then lasts for quite a while, powered by heat coming from the core. (To see something that looks vaguely like the formation of such a hot spot, go back and view the “lava lamp” film of Dr. Anandakrishnan in the introductory material to this module.)
As the lithosphere drifts overhead, the hot spot may “punch through” to make a volcano. Then as the lithosphere carries that volcano away, the hot spot punches through a new place to make a new volcano, a little like a quilter shoving a needle through at discrete places, although a quilter never sticks a needle through two holes at the same time, whereas the hot spot may be wide enough to feed two or more volcanoes at the same time. Hot spots bring melt from the mantle, and so normally make basaltic volcanoes that are only a little different from sea-floor basalt at spreading ridges. However, where a hot spot pokes through a continent rather than through the sea floor, silica from the continental rocks may mix with the melt to increase its silica content, as at Yellowstone.

When a new hot spot first rises from below, the top must push through the mantle and crust, and the resistance of the stuff in the way of the rising column causes its top to spread out like the head of a thunderhead rain cloud, or of a mushroom cloud from an atomic bomb, or of a blob in a lava lamp, and for the same reasons. When that wide head reaches the surface, it can produce immense lava flows that spread across state-sized areas and bury them hundreds of feet deep. Much of central and eastern Washington and Oregon is buried by the “flood basalts” from the head of the Yellowstone hotspot. After the head of the mushroom cloud has made a flood basalt, the “stem” may continue for millions of years or more, supplying melt to the surface. At Yellowstone, the continent has moved across the hot spot, which has fed a string of volcanoes including those at Craters of the Moon National Monument in Idaho. The hot spot now fuels Yellowstone (which is why it is called the Yellowstone hot spot…a lot of this stuff isn’t that difficult!). The flood basalts from the Hawaiian hot spot have been subducted beneath the Aleutians, but the string of hot-spot volcanoes that have not yet been subducted can be traced from the Aleutians south all the way to the volcanically active big island of Hawaii. A new volcano, Loihi Seamount, is growing undersea just off Hawaii as the big island slowly drifts away, and Loihi will someday (not in our lifetimes!) be the new, volcanically active “big island” while the volcanoes of the current big island die and the island slowly erodes away. The upward flow of the hot spot raises the crust above it, and volcanoes slide slowly down from this raised area as the drifting plate carries them away, which along with erosion causes them to disappear beneath the sea surface.
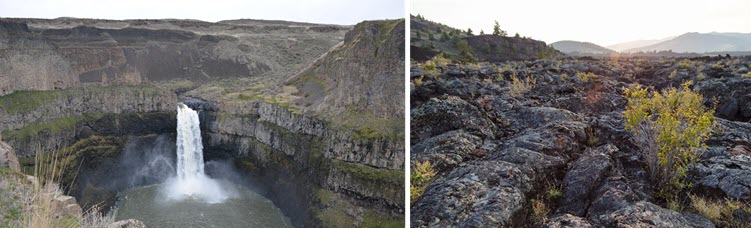
The flood basalts from the Hawaiian hot spot have been subducted beneath the Aleutians, but the string of hot-spot volcanoes that have not yet been subducted can be traced from the Aleutians south all the way to the volcanically active big island of Hawaii. A new volcano, Loihi Seamount, is growing undersea just off Hawaii as the big island slowly drifts away, and Loihi will someday (not in our lifetimes!) be the new, volcanically active “big island” while the volcanoes of the current big island die and the island slowly erodes away. The upward flow of hot rock that feeds the hot spot also raises the crust above it, and andanoes slide slowly down from this raised area as the drifting plate carries them away, which along with erosion causes them to disappear beneath the sea surface.
What controls the type of volcano?
We have now seen that melted rock can leak up from below to feed volcanoes at spreading ridges, at hot spots, and above subduction zones. But, very different volcanoes develop in these different settings: sea floor forms from spreading ridges; flood basalts and then wide, not-very-steep Hawaii-shaped volcanoes form from hot spots; and, steep Mt. St. Helens-type volcanoes form above subduction zones. The type of volcano that develops at a place depends on a host of factors, including the temperature, composition, and rate of supply of the melt, how long the melt is supplied, and several others. We will focus on two of these here, which are probably the most important: composition of the melt (primarily how much silica versus other chemicals) and volatile content (mostly how much water, although carbon dioxide, hydrogen sulfide, and other compounds that are gases under conditions at the Earth’s surface may be present and classified with volatiles).
Composition of the melt
Silicon and oxygen are the two commonest elements in the crust of the Earth and get together in melt to form the material we call silica. Left to itself, each silicon atom will be surrounded by four oxygen atoms, which form a tetrahedron (a little pyramid). But, give them a little time, and the tetrahedra will start sticking together, or polymerizing, into chains and sheets and bigger clumps, with some oxygens being shared between more than one tetrahedron. If these lumps get big enough, we call them minerals, and the melt has solidified.
When the lumps are present but not too big, the melt is like lumpy oatmeal—it doesn’t flow very well. There are three ways to get rid of the lumps: make the melt really hot, which makes the tetrahedra vibrate so rapidly that they pull away from other tetrahedra and so stop polymerization; fill the melt with iron, magnesium, and other elements that interfere with the tetrahedra polymerizing; or, fill the melt with volatiles that interfere with the tetrahedra polymerizing. When polymerization is low, the melt flows easily. Lava comes out of the volcano quietly, without making big explosions, and flows easily and far from the mouth of the volcano. In extreme cases, flows may be nearly horizontal and cover much of a state, as in the flood basalts. If the melt spreads almost as easily as flood basalts, the lava will have very slight slopes of only a few degrees, forming shield volcanoes (they look like a warrior’s shield lying on its side) such as in Hawaii. Hawaiian lavas and flood basalts flow easily because they are hot and are high in iron and magnesium.
Volatile content
When water and other volatiles remove the lumps, a different situation develops. This is because the volatiles will stay in the melt only if the pressure on them is high. Just as a bottling company can force CO2 into the water of a soft drink under high pressure, but the CO2 escapes as the pressure falls when you open the bottle or can, the water and CO2 and other volatiles stay in the melt under high pressure down in the Earth but escape as the pressure drops as the melt gets close to the surface.
Silica-rich melts usually form with many volatiles. Remember that in subduction zones, wet sediment dragged down the trench releases water (and carbon dioxide and other volatiles) that promote melting. When the melt (called magma when it is in the Earth and lava when it reaches the surface) nears the surface, the lower pressure allows the volatiles to bubble off and escape into hot springs, geysers, etc. (Note that most of the fluids that come out of such hot springs are rainwater that has circulated down into the earth, but some of the fluids may be “juvenile” waters from the magma below.) Silica-rich, relatively cool lava that has lost its volatiles flows only with great difficulty. It may emerge from the volcano and flow a short distance as a very thick, slow-moving, steep flow. It may not even flow, but simply form a dome directly over the volcanic vent. The videos you saw on the last page for Mt. St. Helens show such a “plug dome” forming in the crater left by the great 1980 eruption. And, such “thick” lava may “plug the system” when it solidifies, preventing the escape of more lava and volatiles coming from below. Then the stage may be set for a big explosion.
The next melt that rises in the volcano cannot follow the same path, because the hardened lava above prevents escape. The gases are trapped, and pressure builds up. The volcano is like a hot pop bottle being shaken by little earthquakes. If the top is removed, either by a “bottle opener” (such as the landslide that released the explosion at Mt. St. Helens, or a crack opened by an earthquake) or just because the pressure becomes great enough to blow the top off, the sudden release allows the soda or the magma to come foaming out. A good champagne may fountain to many times the bottle’s height, and blast the cork across the room. A powerful volcano may blast ash higher than jet flight paths. The melt really does get foamy, and that foam hardens into little glass shards. The ash layer deposited by Mt. St. Helens, which stopped drivers hundreds of miles away, was mostly composed of such little glass shards, although torn-up bits of the former volcano were also included. The picture below shows volcanic ash that is composed of lots of broken bubble walls.
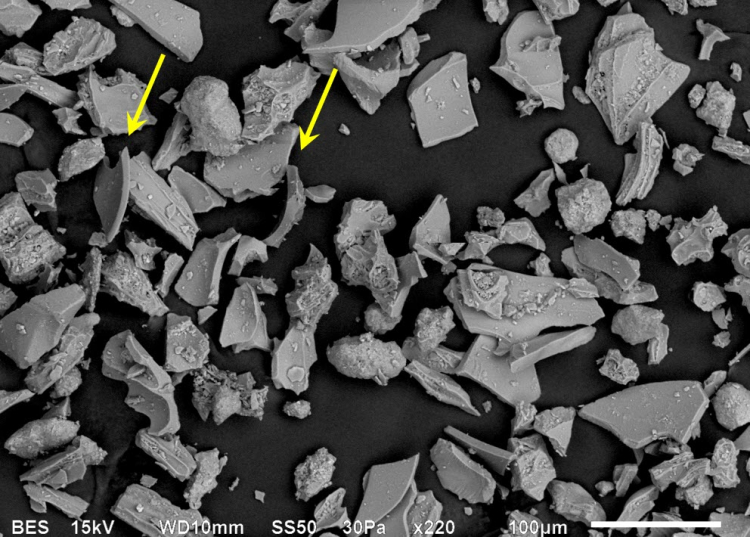
The andesitic volcanoes of the Ring of Fire are typically stratovolcanoes, formed of alternating layers of thick lava flows and of pyroclastics—the things thrown through the air by the volcano. The steepness comes from the flows, which cannot go too far from the vent. Some of the andesitic volcanoes, including the rebuilding of Mt. St. Helens, include plug-dome elements, the oozing lava staying right above the vent.
So, the major volcanoes for our purposes are the quiet, basaltic shield volcanoes of hot spots, the quiet basaltic rift volcanoes of spreading ridges, and the steep, scenic, explosive, andesitic volcanoes of the Ring of Fire. Other types exist, notably, cinder cones thrown up by typically minor eruptions tossing pyroclastics short distances (see the Enrichment on cinder cones). Also, hot spots or rifts trying to poke through continental rather than oceanic crust may pick up silica and water, and then produce explosive silica-rich volcanoes. But if you understand shields and stratovolcanoes, you will be well on your way toward understanding volcanism.
Enrichment: Cinder Cone Volcanoes
Enrichment: Cinder Cone Volcanoes

Many volcanic eruptions produce small cinder cones. These may form on the flanks of a shield volcano (such as are shown in the picture of Mauna Kea), or a stratovolcano, or in other volcanic settings such as where a spreading ridge comes above sea level. Cinder cones form when a small opening reaches the surface above magma containing gas. If you have ever been really close to a recently poured carbonated beverage, you know that the bubbles rise and then break, throwing droplets of the drink that can make your face wet. Similarly, bubbles rise and break in the melted rock, throwing droplets that freeze in midair, and then fall as loose pieces that pile up around the opening. Walking up a cinder cone can be difficult because the loose pieces roll easily underfoot.
Cinder cones are not as important as other volcanoes in making large mountains that last a long time, but many people have seen a cinder cone, and sometimes they can be dramatic. Back in 1943, a new cinder cone suddenly began growing in a cornfield west of Mexico City. The volcano Parícutin grew to be more than 1300 feet (400 m) high, buried two towns, and killed three people, but eventually quit erupting and became a great tourist attraction.
Watch some short vintage videos discussing cinder cones.
Video: Cinder Cone Volcanoes: Sunset National Park #1 (1:14)
An explanation of cinder cone volcano formation by CAUSE student Sam A.
Right now we're at-- this is called Lenox Crater, and it's a volcano. It's a cinder cone volcano. If you looked around behind us, right at the center there's a big crater, hence the name. And all the stuff that we're sitting on right here is cinders, basalt rock that was ejected from the volcano. And as it was ejected, it was thrown up and out, kind of like this. And--
Kind of like what?
[LAUGHTER]
Kind of like that. And it just over the years built up and built this-- what did it say, it's 400 feet high or something like that? Yeah. Not too bad.
Video: Cinder Cone Volcanoes: Sunset National Park #2 (2:09)
Another, slightly "dramatized" explanation of cinder cone volcano formation by CAUSE students Stephanie S. and Raya G.
ROh. That was hard. Why?
Well, Ryan you just walked up a really steep side of a volcano.
What volcano?
This volcano.
That's a volcano?
Yeah. Right over there's the center of the volcano. And we're sitting on top of cinders that were thrown out of the volcano.
What's a cinder?
These are cinders.
What are they?
OK, imagine this is the bottom of the volcano. Stuff's thrown out of the center of the volcano. And it starts to build up around the side. So eventually when enough stuff's thrown out, you get a steep-sided volcano. It's just layer, upon layer, upon layer, upon layer, upon layer of stuff that's ejected out of the volcano, falling down on top of each other.
How far does cinder travel?
Well, we're sitting about a quarter mile from the center of the volcano, so these cinders traveled about a quarter mile. They can go further than that, a mile.
So if this is cinder, it's so small. I mean, are they all this small?
Yeah. Well, some are real small, some are a little small. Some are big, and some are the size of Volkswagens.
Oh. But Stef, I still don't get it. I mean, where else are we going to see this in the real world?
Have you ever made spaghetti?
Yeah.
All right. Well, think of a pot of spaghetti sauce. You've got the heat cranked up real high, and the sauce starts boiling. You get bubbles and then, next thing you know, you've got butter and spaghetti sauce. You've got spatters of sauce all over your kitchen stove.
And that's exactly what's going on over here?
Yeah. Why don't we go to take a look?
OK.
Go down in the crater.
Hey!
Video: Cinder Cone Volcanoes: Sunset National Park #3 (1:07)
A third explanation of cinder cone volcano formation, by Dr. Alley himself.
We're looking at Sunset Crater, a volcano that erupted almost 1,000 years ago. It's primarily a cinder cone, so when it was erupting it was sort of spitting out little pieces like a pot of spaghetti sauce bubbling and throwing things.
Those little pieces-- we can actually see similar pieces from either that one or a different eruption here. And we've been walking on them, and they're not terribly pleasant for walking on, but you can build a pile out of stuff like this. There's probably lava flows helping to hold that one up.
A little more oxidized late in the eruption and so you get that pretty red around the top that gives the Sunset Crater name.
Volcanic Hazards
Volcanic Hazards

People who live near volcanoes have many good reasons to be worried about safety. Volcanoes can do much damage. The volcanic-triggered landslide that buried Armero, Colombia in 1985, and the eruption of Mt. Pelée on the island of Martinique in the Caribbean in 1902, each killed about 30,000 people. Other volcanic disasters bring the human death toll to perhaps 200,000 over the last few centuries. Compared to war, disease, or even automobile accidents, this is not a terribly high toll; however, the 200,000 people directly involved almost certainly would have appreciated enough warning to get out of harm’s way. One of the goals of modern geology is to predict volcanic hazards and to save lives and property by doing so. There are many hazards to worry about. These include:
Pyroclastic flows
Often, a volcano will produce a dense mixture of ash and hot gases (up to 1500oF or 800oC, and including poisons such as hydrogen sulfide). This potentially deadly mix is either forced away from the volcano (the lateral blast released by the landslide on Mt. St. Helens) or forced upward to then collapse and flow under gravity, at speeds up to hundreds of miles (hundreds of km) per hour. The deaths on Martinique were caused by such a “glowing cloud” (nuée ardente in French, where the only survivor in the whole city of St.-Pierre was a lone man locked in a heavily built prison.) See some amazing pictures in the slideshow below.
Pyroclastics
If the heat and gases don’t get you, the rocks might. People have been killed by rocks up to car-sized or bigger, called bombs, that were thrown from volcanoes. Having a car-sized rock fall on your head from a great height is not recommended. Even fine-grained ash deposits may bury and kill nearby crops. Jet aircraft are endangered by flying into ash at high speeds. From 1980-1995, ash caused an estimated $200 million in damage to the 80 aircraft that flew into eruption clouds, mostly over the Pacific. Of those, seven lost engine power and came close to crashing. Improved monitoring of eruption clouds, to provide warnings and steer the airplanes into safer air, has greatly reduced damages since then. However, to avoid crashes from the 2010 eruption of Eyjafjallajökull in Iceland, literally millions of passengers were stranded in Europe and elsewhere as flights were suspended over weeks.
Poisonous gases
Sometimes, a volcano will smother or poison victims. Pompeii and Herculaneum, the cities entombed by the eruption of Vesuvius in the year 79, have proven to be archaeological treasures, but certainly would be considered tragedies by the many people killed there and by their relatives. The people apparently were killed before they were buried, and poisonous gases as well as great heat may have contributed to the deaths. Lake Nyos in Cameroon rests in a volcanic crater. Volcanic CO2 feeds into the bottom of the lake, but the lake typically remains stratified and does not mix. The CO2 thus builds up in the deep waters. In 1986, the lake overturned, perhaps because a landslide from the crater wall temporarily mixed the water at one end. The escaping CO2 made a great fountain like a giant erupting champagne bottle, filled the crater with CO2, and then flowed down outside the crater, killing about 1700 people through some combination of suffocation and poisoning. The lake now is being vented through large pipes, but an earthquake might break the walls and release a huge flood, and that would release much CO2 that has not been vented and that might kill people. (Note that while CO2 can be toxic locally, in lower quantities it is not toxic and a little is necessary for plants to grow. The flux of CO2 from all the volcanoes in the world is about 1% of the flux from human fossil-fuel burning, and there has been no significant change in that natural volcanic flux recently, so the volcanoes are not driving recent global warming.)
Landslides and mudflows
These are often less dramatic, but more dangerous cumulatively, than the explosive events. Most of the andesitic volcanoes are steep, and many are capped by very large glaciers. Mt. Rainier, for example, has 25 times as much glacier ice as Mt. St. Helens had, ready to melt and trigger mudflows after even a minor eruption. The tragedy at Armero arose from a minor eruption that triggered a big landslide. It is worth noting that Armero was built on a known, older debris-flow deposit.
Tsunamis
A large undersea eruption may move a lot of water. This water movement may form into a tsunami, a long, low wave that moves very rapidly. When a tsunami nears a shore, the water “piles up” into a short, steep wave that may be 100 feet or more high. Such waves, which also can be caused by landslides or earthquakes, may affect coasts hundreds of miles (or kilometers) from the source. The largest eruption of historical times, that of Krakatau in Indonesia in 1883, killed thousands of people on neighboring islands in this way. The great Tohoku earthquake of 2011 in Japan made a tsunami that was over 130 feet high (40 m) at its worst, where it came ashore where people lived. We’ll look more at tsunamis in Module 4.
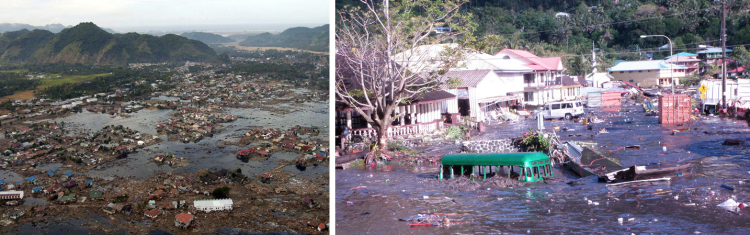
Right: A tsunami inundates Pago Pago in American Samoa in September 2009. (National Park of American Samoa)
Climate change
A large volcanic eruption puts a lot of sulfur gases into the stratosphere, together with ash and other materials. The sulfur eventually forms sulfuric-acid droplets, which typically remain aloft for one to a few years before falling out across much or all of the planet. While they are aloft, the sulfuric-acid droplets block some of the sunlight, cooling the planet a little. This can produce killing frosts during normal growing seasons, leading to widespread starvation in sensitive regions. The Tambora eruption of 1815 is associated with the starvation “year without a summer” of 1816. Ice cores from Greenland, Antarctica and elsewhere record volcanic fallout (the ash and sulfuric acid are preserved in the ice) and the temperature (from certain indicators including the isotopic composition of the ice), and show that big eruptions typically are accompanied by a cooling of a good chunk of a degree for a year or two, with more cooling in some places and seasons, and less in others. This isn’t a huge change, but when one killing frost can cause starvation, it may be too much. If many volcanic eruptions occurred in a short period of time, it might produce major climate changes; however, volcanism doesn’t seem to get organized—there is no way for a volcano in Alaska to tell a volcano in Indonesia that it is time to erupt. (Volcanoes also release carbon dioxide, which tends to warm the climate, as we will see later in the course. However, not a lot of carbon dioxide comes out in one volcanic eruption. If all the world’s volcanoes started erupting a lot faster, maybe twice as fast as normal, enough carbon dioxide would be released in “only” a few hundred thousand years to start warming the world notably. Over really short time scales of years to centuries, more volcanism would cause more cool years, because the sun-blocking effect would be much bigger than the warming-from-carbon-dioxide effect. If you greatly increased the rate at which volcanoes erupt, you would get cooling first and then warming later.)
Optional Viewing
For the first video, add optional text: Hawaiian volcanoes are usually not as dangerous as the explosive eruptions of Cascades volcanoes such as Mt. St. Helens. But, that does not mean that Hawaiian volcanoes are safe! Here, USGS film shows a lava flow slowly destroying a subdivision.
Video: Kīlauea Volcano — Pāhoehoe Flows on Kaupili Street (1:24)
Aerial view of fissure 8 of Kilauea Volcano on May 6, 2018 in Leilani Estates. After vigorously erupting for much of the day, activity on the fissure diminished around 4:00pm. A lava flow from the fissure advanced about 1 km (0.6 mi) to the northeast. Again, this sort of eruption is normally slow enough that people can get out of the way, but still can be dangerous.
Video: Kīlauea Volcano — Fissure 8 Video Compilation (1:03)
Predicting Eruptions
Predicting Eruptions
So, we can help a lot of people if we can do a better job of predicting when and where volcanoes will cause hazards. Various things can be done. For problems such as climate change, the best we can do is to know that every few years or decades some region is likely to experience difficulties with crop production because of eruptions. The solutions are either to maintain a little excess food to feed those endangered people, or to ignore them and figure that some will starve to death. (Many other climate changes, including droughts, give us the same choice. Despite the apparent silliness—either we stockpile food and figure out how to distribute it to the needy, or we let people starve to death—it is surprising how often starving to death is the outcome.)
For tsunamis, an operational warning system now exists for many of the world’s coasts, but much more could be done. One way to avoid volcanic hazards is to stay out of harm’s way. Geologists can map regions where large pyroclastic chunks have fallen, or where landslides have occurred, with great confidence. Using carbon dating of logs caught in debris flows, or tree-ring dating of trees growing on landslides (just hang on; we will explain how ages are learned), scientists can determine the recurrence interval—how often do such disasters happen? Today, whole housing subdivisions are being built around Mt. Rainier National Park in the growing Seattle-Tacoma region that have a danger of destruction by landslide many, many times higher than their danger of destruction by household fires. More than 200,000 people work, and more than 100,000 people live, on debris-flow deposits less than 10,000 years old, with more people coming. (The largest of those flows, the Osceola Mudflow from about 5,700 years ago, came from the top of the mountain, and lowered its peak about 1,600 feet (500 m); Mt. Rainier is now 14,417 feet (4,394 m) in elevation, but the peak once was about 16,000 feet (4,900 m) high.)The homeowners living in danger around a volcano will all carry house-fire insurance, but few if any are insured against the volcano.

(Much argument is attached to sending disaster aid for predictable events even if they are not very common. Should those who wish to live in beautiful but risky areas carry insurance to pay for their gambles? Increasingly, planners are saying “yes,” and much effort is being devoted to quantifying the hazards so that insurance rates can be set wisely. This applies to such things as hurricanes along coasts, earthquakes along faults, and floods along rivers. Geologists have an important role to play in learning hazards and thus setting rates.)
With sufficient care, volcanic eruptions can be predicted with some confidence. Volcanoes usually give off many signals before an eruption: the ground swells as magma moves up; the moving magma and the swelling ground create earthquakes and especially the distinctive harmonic tremors of fluid flowing in a pipe; small eruptions occur; gaseous emissions increase as the magma nears the surface and then cease if the system becomes plugged and builds up pressure for an explosion. A monitoring program of seismographs to detect earthquakes, repeat surveying of laser reflectors set on the mountain together with monitoring using satellites to watch for deformation patterns, gas sampling, and perhaps photographic or other sensors to watch for landslides, can track a volcano’s behavior and allow timely warning. Monitoring of ground shape from space can even see the changes in volcanoes as magma moves under them. The eruption of Mt. St. Helens was predicted well enough to save hundreds of people including the residents of a YMCA camp. The eruption of Mt. Pinatubo in the Philippines in 1991, which heavily damaged the U.S. military bases there, was predicted accurately, allowing timely evacuation and saving tens or hundreds of thousands of lives of residents and military personnel.
The burden of predicting eruptions is very high, though. Imagine telling an Air Force general to abandon his or her assigned duty post, spend perhaps millions of dollars to move tens of thousands of people, and then having nothing happen—the general, and all of those people, would be very unhappy. Imagine instead deciding to wait another day to be sure, and having all of those people (possibly including you) killed. As important as this is, predicting disasters is not for the faint of heart.
The Mt. St. Helen eruption was a small one compared to many others. Each of the major eruptions of Yellowstone moved about 1000 times more material than Mt. St. Helens did, and Yellowstone’s eruptions were not the largest known. Small eruptions are more common than large ones. But, eruptions ten times as big as Mt. St. Helens are perhaps five times as rare, but not ten times as rare. This means that, as for earthquakes, most of the “work” done by volcanoes is achieved by the few big ones, not the many little ones.
Hawaii Volcanoes
Hawaii Volcanoes
Take a Tour of Hawaii Volcanoes National Park
These pictures were taken many years ago when Dr. Alley visited Hawaii. Lava is not always flowing in Hawaii, and the site of greatest activity has moved since then.
The hot spot of Hawaii erupts runny lava to the surface, giving some very interesting features, such as the lava tubes you will see forming in the first vintage video, and formed in the second one. The hike out to the flowing lava was, in the spring of 2007, over three miles across rough, often broken, and glassy lava that solidified from glowing hot flows over the last couple of decades. Whales were spouting offshore when Dr. Alley and his family made the trip. Tag along, and see what they saw way back when.
Video: Hawaii: Night Lava (1:02)
Hawaii Volcanoes National Park below the east rift Kilauea, this is the lava headed for the sea. It is 2,000 degrees Fahrenheit or so. This is the innards of the Earth turning inside out, building new land that we're sitting on right now. And this is way cool because it's so hot. You just can't imagine what this is like.
Below us, it is fountaining into the sea and jetting up great bursts of steam. New land being born, this is geology in action, this is the real thing. The breeze blowing over us is a little bit sulfurous, it's a little bit warm-- we're going to get out of here fairly quickly. But we're having a lot of fun, I wish you could be here with us. This is an amazing, amazing sight.
Video: Hawaii: Lava Tube (:50)
We're in the rainforest on the side of Kilauea, and behind me is a lava tube. A great lava flow came through here in the past, the top freezes first, the sides freeze, the inside-- glowing hot lava-- comes flowing out, and it drains. And you go inside and there'll be stalactites that were little drips that were falling off the ceiling when they froze. And this is the way a lot of the lava gets to the coast. It's that the top will freeze and the insides will go squirting on out to the sea. And so it's a really interesting place, a very different kind of cave.
Lava was erupting in the Southwest Rift of Kilauea not that long ago. Sometimes, the lava erupts with a little force, throwing pieces that freeze to glass in the air and rain down. Other times, the lava flows even more quietly along the surface. Here, you can see evidence of both.
Video: Hawaii: Southwest Rift (1:07)
The Southwest Rift of Kilauea on Hawaii. There's a vast and fascinating volcanic history sitting here. Layers of rock that were made of pieces that were tossed through the air. Glass that froze in the air as it was thrown as molten little bits from the volcano, and then other sorts of layers.
Then there's been a great cracking here, probably an inflation from underneath as melted rock is moving underneath that sort of bubbles things up and breaks it. Then an eruption happened at some point, and there was actually sort of a waterfall of melted rock, and it was flowing into the crack. And we can see behind me all these places where this stuff has flown down into the crack. Just a wonderful record of the excitement of the geology of this place.
Lava was erupting in the Southwest Rift of Kilauea not that long ago. Sometimes, the lava erupts with a little force, throwing pieces that freeze to glass in the air and rain down. Other times, the lava flows even more quietly along the surface. Here, you can see evidence of both.
Want to see more?
The following optional vintage videos, and a vtrip are here for your enjoyment (and education, but you won't be quizzed on them.) Volcanoes are just too interesting to leave so quickly, so here are some more looks at these important, and dangerous, pieces of our planet. First, visit Hawaii again, and see some strange things. On the next page, we'll head over to Sunset Crater Volcano National Monument, Arizona, with the CAUSE class. Have fun, and keep your feet cool!
Hawaii: Tree Mold
I am in one of the stranger positions in one of the stranger places you'll ever see. The camera is looking right down on me, and I am sort of lying over the ground. And behind my head is a tree mold in Hawaii Volcanoes National Park. There used to be a giant Ohia tree here. A lava flow came in around it, the lava chilled where it hit that tree and was boiling the water away from the bark. Eventually, the tree rotted out, but it left its shell of lava sitting here behind me, and you can see sort of the shape of the bark sitting here in the tree.
Then a new tree has grown and is putting its roots down in the hole where the old one was. But this is the mold that was left from a tree that was hit by a lava flow. And it's really something you can see. There's places in the park where there are footprints that you can see, where people walked in the lava, and here's the mark of a tree.
Hawaiian lava flows engulf whatever is in their way, including trees. What happens when hot lava hits a cold, wet tree? Find out here, your chance to look down on Dr. Alley.
Hawaii: Boiling Cauldrons
Kilauea, Hawaii Volcanoes National Park. Deep beneath us a boiling cauldron of melted rock that wells up from possibly the core mantel boundary on the giant hot spot that is Hawaii. Next to us, the great crater here, fills with magma, with lava, that comes boiling up from below. And then it rifts out, it breaks, and you get cracks in the ground, and the lava flows out, and it is now flowing into the sea and building new pieces of the island just below us down at the coast.
Around me here, you can see swirling-- the fogs, the mists, the steam, the hot sulfurous gases that come off of this volcano. Where the rain from above soaks down through the cracks, it hits a hot rock, it flashes to steam, and it comes boiling out. This is a place where geology lives, where geology is living right now. And it's an amazing place to try to breathe in this.
Kilauea Volcano is a wonderful place to visit. Stay in the lodge on the rim, and you'll wake up to the view shown here behind Dr. Alley.
Enrichment Tour: Hawaii Volcanoes National Park
A Rocking Review
Ring of Fire
Did you catch all of that? Review the chapter with another Johnny Cash tune not sung by Johnny Cash, "Ring of Fire.", Mt. St. Helens by the subduction zone—it really is a burning thing!
DR. RICHARD B. ALLEY: Hi. I'm not Johnny Cash. But I have been in a ring of fire.
[MUSIC- JOHNNY CASH, "RING OF FIRE]
(SINGING) Subduction is a burning thing. It feeds a fiery ring. Cold, dense ocean floor will soon retire down through the mantle for a ring of fire.
Subduction scrapes off mud 'round a burning ring of fire. Takes water down, drives the volcanoes higher. Makes light andesite from a ring of fire. A ring of fire. Basalt is born calm and dark at a spreading ridge or Hawaii's hot-spot park. Dangerous stratovolcanoes fountain higher when fed by subduction and a ring of fire. Subduction scrapes off mud 'round a burning ring of fire. Takes water down, drives the volcanoes higher. Makes light andesite and a ring of fire. A ring of fire.
Great earthquakes from the moving load, stick, slip, and plates just might implode.
Eruptions, landslides-- we require Tsunami warnings from the Ring of Fire.
Subduction scrapes off mud 'round a burning ring of fire. Takes water down, drives the volcanoes higher. Makes light andesite from the Ring of Fire. The Ring of Fire. St. Helen's blew high, others blow higher. Go in awe and fear to the Ring of Fire. The Ring of Fire. The Ring of Fire.
Enrichment Videos
The Biggest Eruption in the Whole USA
The eruption from Mt. St. Helens in 1980 was not especially big—each of the main Yellowstone eruptions moved about 1000 times more material, for example. But, the Mt. St. Helens eruption killed more people (57; before that only 2 deaths in the US were blamed on volcanic eruptions, with none since), and did more property damage (almost $1 billion), than any other eruption in the United States since the country was formed. Novarupta, in Alaska in 1912, blasted more material than the Mt. St. Helens eruption, but was so far from most people that no one died and damages were small; also, Alaska, at that time, was a territory of the US but not yet a state.
The 1980 Mt. St. Helens eruption probably involved the largest landslide ever observed by humans, in the US or anywhere else, at least since we started writing down what we saw. So, by many measures, in 1980, Mt. St. Helens gave us "The Biggest Eruption in the Whole USA." Here's a Rock-Video parody to show you what happened. If an eruption this big happened from Mt. Rainier, which is close to many more people, the damages would be far, far greater. And, Rainier might just do it some day...
[MUSIC PLAYING] PRESENTER (SINGING): Good morning, Mountain. Hello, crater. Lava dome raising its head. Cracks in their showing the molten rock glowing so hot it's orange and red. Behind the new dome, there's a glacier, fed by the massive snowfall. Fire and ice may make you think twice, either can make you feel small.
May on the mountain, 1980, the magma was coming full bore. The poison gas rising, the earthquake surprising, the north slope was bulging out more. Scientists worried, authorities hurried to save everyone if they could. Those few felt the power, but in the last hour, those few feared that everyone would.
The forces of nature dwarf us here as they shape the mighty land. But as we wonder, as we fear, we can understand. But there once was a time when we could not imagine just what it would mean to say, "We saw the biggest eruption in the whole USA."
Morning the 18th came the earthquake, the north slope went sliding to ground, uncorking the bottle that went off full-throttle. "This is it!" the most memorable sound. Almost as fast as sound came fury. 700 degrees in the blast. The forest was leveled, the landscape was beveled, 57 had breathed in their last.
Now we and the mountain live together. We both have a place on this sphere. It gives us new land, and the scenery grand, new soil for the trees and the deer. But bigger ones happened before cameras. Yellowstone was 1,000 times more. And Crater Lake's blast, not that far in the past, sent ash up to Greenland and o'er.
The forces of nature dwarf us here as they shape the mighty land. But as we wonder, as we fear, we can understand. And that helps us prepare for a bigger one coming. But until then we can say, "We saw the biggest eruption in the whole USA!"
St. Helen's will reach you, St. Helen's will teach you, and stay with you when you say, "I saw the biggest eruption in the whole USA!"
Good morning, Mountain.
Module 3 Wrap Up
Module 3 Wrap-Up
Review Module Requirements
You have reached the end of Module 3! Double-check the list of requirements on the Welcome to Module 3 page and the Course Calendar to be sure you have completed all the activities required for this module.
Comments or Questions?
If you have any questions, send an email via Canvas, to ALL the Teachers and TAs. To do this, add each teacher individually in the “To” line of your email. By adding all the teachers, the TAs will be included. Failure to email ALL the teachers may result in a delayed or missed response. For detailed directions on how to do this, see How to send an email in GEOSC 10 in the Important Information module.
Module 4: Mountain Building, Obduction, and Tsunamis
Welcome to Module 4!
Welcome to Module 4!
Mountain Building, Obduction, & Tsunamis
Introducing Obduction
"No matter how sophisticated you may be, a large granite mountain cannot be denied—it speaks in silence to the very core of your being."
—Ansel Adams, The Spirit of the Mountains
Video: Introduction to Module 4 (0:00)
The Great Smokies are geologically attached to the whole Appalachian mountain range, including the ridges near Penn State’s University Park campus. There, if you’re so inclined, you can visit the beach in the mountains—all thanks to Africa.
Transcript
We saw in Module 3 that an old, cold sea floor is subducted beneath the warmer sea floor or a continent, but what happens when a high-floating continent or island arc tries to go down beneath another continent or island arc?
In this module, we’ll see that the answer is obduction, a BIG collision. The Great Smoky Mountains, Mt. Nittany near Penn State's University Park campus, and all the rest of the Appalachians were formed by just such a collision, between North America on one side, and Africa and Europe on the other side. Folding and thrust-faulting in the collision zone thickened and shortened the crust and upper mantle. This produced high mountains—probably about as tall as the Andes today. And, as we will discuss, high mountain peaks float on deep roots. When erosion lowers a mountain range, the root floats up, bringing metamorphic rocks to the surface that have been "cooked" by heat and pressure deep within the Earth.
Before we go any further, look at the following short video introduction by Dr. Anandakrishnan.
Video: Duck Mountain (2:23)
[RUNNING WATER]
Oh, hi. Welcome to the GEOSC 10 Tectonics III Section, Mountain Building. We're going to be talking about how the Appalachians were built, and why they're still as high as they are now. And we're gonna talk a little bit about icebergs. Now, what does all that have to do with rubber duckies, and why am I in the bathtub surrounded by rubber duckies? Well, let's find out.
So why are we in a tub with rubber duckies? Imagine that these ducks represent the mountains that surround us right here in Happy Valley. This is Mount Nittany. Here's the Great Smoky Mountains. And these are all the ridges and valleys that spread up and down the east coast of North America known as the Appalachian Mountains.
About 300 million years ago, North America and what's now Europe and Africa all collided to form a supercontinent known as Pangaea. And when these continents collided, because they're both about the same density, neither one subducted beneath the other. In fact, as they crashed together, they formed larger and larger mountains that wrinkled up. And that's what we had 300 million years ago with the Appalachians. This big duck represents the mountains at the end of that mountain-building phase.
So after that collision, we have the proto-Appalachians. They were big. They were tall. They were high.
But for the last 300 million years, they've been eroded and eroded and eroded. But still, we have mountains around here that are a couple of thousands of feet high. If you go further down towards Tennessee and Kentucky, some mountains are 4,000 or 5,000 feet high. Why are they still high? Well, it has to do with buoyancy.
[RUNNING WATER]
And....A Word About Tsunamis
Plate tectonics causes earthquakes, volcanic explosions, and steep slopes that can experience landslides. If any of these happen under the ocean or in a deep lake, or if a landslide falls into an ocean or lake, a lot of water can be moved in a hurry. The resulting great waves are called tsunamis and can have catastrophic consequences. Fortunately, warning systems can be devised to reduce the loss of life, and we can use our knowledge to build in ways that increase safety for people and property. We'll look at some of these issues as we wrap up our multi-week exploration of Plate Tectonics and Mountain Building.
Learning Objectives
- Identify the push-together faults and folds formed in obduction zones when continents or island arcs collide.
- Explain the three basic tectonic styles: pull-apart, push-together, and slide-past.
- Explain how obduction zones can produce thickening of the crust that leads to the formation of metamorphic rocks.
- Explain how erosion can reveal metamorphic rocks formed in obduction zones.
- Explain how tsunamis are caused, and why they are dangerous.
What to do for Module 4?
You will have one week to complete Module 4. See the course calendar in Canvas for specific due dates.
- Take the RockOn #4 Quiz.
- Take the StudentsSpeak #5 Survey.
- Continue working on Exercise #2: Geology is All Around You.
Questions?
If you have any questions, send an email via Canvas, to ALL the Teachers and TAs. To do this, add each teacher individually in the “To” line of your email. By adding all the teachers, the TAs will be included. Failure to email ALL the teachers may result in a delayed or missed response. For detailed directions on how to do this, see How to send an email in GEOSC 10 in the Important Information module.
This course is offered as part of the Repository of Open and Affordable Materials at Penn State. You are welcome to use and reuse materials that appear on this site (other than those copyrighted by others) subject to the licensing agreement linked to the bottom of this and every page. Students who register for this Penn State course gain access to assignments and instructor feedback and earn academic credit. Information about registering for this course is available from the Office of the University Registrar.
Main Topics: Module 4
Main Topics: Module 4
Overview of the main topics you will encounter in Module 4.
Plate Tectonics III: Obduction
- In subduction, the denser side sinks under the less dense side.
- But the density of continents and island arcs is too low to allow them to go down very far — ”You can’t sink a continent”, as geologists like to say.
- Collisions involving continents and island arcs cause folding, push-together (thrust) faulting, and thickening of the crust and upper mantle.
- We call this OBDUCTION.
- Obduction generally makes the biggest mountain ranges, such as the modern Himalayas, and the Appalachians, which were much higher when they formed 200 million years ago than they are now.
- This push-together process sometimes pushes older rocks on top of younger ones.
A Little History—The closing of the proto-Atlantic Ocean and opening of the Atlantic
- Long ago, the Americas were separated from Europe and Africa by the proto-Atlantic Ocean (sometimes called the Iapetus Ocean).
- The proto-Atlantic Ocean shrank before disappearing, as subduction made large explosive volcanoes in island arcs that sometimes collided with one of the continents.
- The proto-Atlantic Ocean disappeared entirely in the great obduction that pushed up the Appalachians, including the Great Smoky Mountains and Mount Nittany near Penn State’s University Park campus.
- When the push-together motion ended, the huge pile of rocks that made the Appalachians was hot and soft down deep and began to spread under its own weight, with Death-Valley-type faulting and thinning of the crust and upper mantle.
- This thinning reduced pressure on the mantle beneath, which triggered convection there as hot rocks rose and melted, and thus led to the slow and still-occurring opening of the modern Atlantic Ocean.
The Three Basic Tectonic Styles
- PUSH-TOGETHER: subduction (Olympic, Crater Lake, Mt. St. Helens) or obduction (Great Smokies)
- PULL-APART: rifting/spreading/sea-floor-production (Death Valley)
- SLIDE-PAST: faulting (San Andreas)
- Intermediates can occur, such as a little push-together while sliding past, or a little pull-apart while sliding past.
- The three types of plate boundaries, plus hot-spot activity poking up through plates, create the great majority of mountain-building, earthquakes, volcanoes, etc.
Meanwhile, Out West:
- As the Atlantic Ocean opens, Asia and the Americas are approaching each other, narrowing the Pacific.
- Subduction under the western US started with cold rock, but as the continent moved toward the Pacific spreading ridge, more buoyant ("float-ier") rock was forced down, scraped along under the US rather than sinking deep, and rumpled up the lithosphere to make the Rockies, etc., far inland.
- Where the subduction zone has reached and swallowed the spreading ridge in the Pacific, rock is no longer going down under the western US; the subduction zone was push-together plus slide-past, and the slide-past remains as the San Andreas Fault.
- Where and when the push-together of the subduction ended, the pile of the western US spread under its weight, giving Death Valley-type faulting at Death Valley and across much of Nevada and nearby.
- (This may seem complex, but the full story is likely even more complex than this, and not all of it is fully known. This is close, though.)
Old Mountains and Metamorphism
- The upper layers of the Earth float on lower layers.
- When the collision of an obduction event thickens the upper, crustal rocks, the mountains sticking up into the air float on a root sticking down into the mantle (like an iceberg, but icebergs have about 1/10 sticking up and 9/10 sticking down, whereas mountains are closer to 1/7 up and 6/7 down).
- If you cut or melt off the top of an iceberg, the bottom bobs up; if you erode off the top of mountains, the bottom bobs up.
- Bobbing up of eroding mountains brings rocks to the surface that had been buried deeply, where they were heated and squeezed.
- Heating and squeezing turn sedimentary rocks (pieces of older rocks) or igneous rocks (frozen from melted rock) into metamorphic rocks, which often are pretty and may contain valuable ores or gems.
Tsunamis
- Undersea earthquakes, volcanoes, landslides, or meteorite impacts can move lots of water.
- Such water motion makes a wave (a tsunami) that is long and low in the ocean, but the wavefront slows down as it enters shallow water, and the back catches up and piles up.
- Most tsunamis are tiny, but the biggest ones can run up on land to elevations above 1000 feet; the 2004 Indian Ocean tsunami killed over 300,000 people, and the tsunami from the Tohoku, Japan earthquake in 2011 did much of the damage in what was probably the most expensive natural disaster ever.
- We know of no way to stop tsunamis, but we can give real-time warnings (earthquakes, etc., make seismic waves that go faster than tsunamis; we can “listen” for those seismic waves with seismometers, then warn people to go inland fast).
- We can enact and enforce zoning codes to build only in safe places, and keep reefs and barrier islands healthy to break some of the energy of tsunamis.
Still More Plate Tectonics, The Great Smoky Mountains
Still More Plate Tectonics, The Great Smoky Mountains
The Smokies--and State College?
As usual, we start with a little background on our featured National Park, this time The Great Smoky Mountain National Park of North Carolina and Tennessee. Then, we get into the material that might be on the RockOn Quiz, starting with the first virtual tour below and then discussing obduction zones. The Great Smokies include 16 mountains over 6,000 feet (about 2,000 m) high, making this generally the highest region in North America east of the Mississippi River. The tourist town of Gatlinburg is a mile (1.6 km) lower than Mt. Le Conte, a difference almost as large as in many of the great mountain parks of the west, where the peaks are higher but so are the valleys. The Smokies were preserved in a park in 1926, with much of the funding for land purchases provided by J.D. Rockefeller. The Great Smokies today are the most-visited National Park because they combine spectacular scenery, rich biological and historical diversity, proximity to major population centers, the lure of a quick stop-off on the drive from the northeast USA to Florida, and a shortage of other nearby national parks to draw off the crowds. (Although we should not forget Shenandoah National Park, connected to the Smokies by the Blue Ridge Parkway, another beautiful park.)
In case you’re interested (and no, you do not need to memorize these!), the National Park Service keeps track of visitation, and you can easily find the numbers by searching online. As this text was being written, the Blue Ridge Parkway was the most-visited “park” managed by the National Park Service, but if we restrict attention to the actual National Parks, the numbers of visitors for the most popular parks are outlined in the table below.
| National Park | Number of Visitors |
|---|---|
| Great Smoky Mountains | 14.1 million |
| Zion | 5 million |
| Yellowstone | 4.9 million |
| Grand Canyon | 4.5 million |
| Rocky Mountain | 4.4 million |
| Acadia | 4.0 million |
| Grand Teton | 3.9 million |
| Yosemite | 3.3 million |
| Indiana Dunes | 3.2 million |
Much interest in the Smokies centers on its historical aspects. For example, how did the early European settlers survive and flourish in this region? At Cades Cove, wonderful relics of a bygone lifestyle are maintained in a living museum. Many visitors are also seeking to learn about the earlier Native Americans. Biologically, the Smokies host an amazing array of tree species, flowering bushes (azaleas, rhododendrons, and mountain laurels, in particular), wildflowers (including many orchids), and more. Approximately one-third of the park is covered with "virgin" timber that escaped being cut by European settlers in the high, remote landscape, and the regions that were logged are growing back rapidly with impressive stands of diverse trees.
Abundant rainfall and snowfall “scraped” from the sky by the high peaks feed numerous cascades and waterfalls, with trout in the pools and kingfishers by their banks. Rainfall is roughly 50 inches (1.3 m) per year in the valleys and more than 85 inches (2 m) per year on the peaks, so the Smokies share some characteristics with temperate rainforests of the west such as in Olympic. Especially during “off-peak” times when fewer travelers are present, you can get lost in the Smokies, and imagine what the Appalachians must have looked like without humans; approximately 3/4 of the park is wilderness. And, because so many of the visitors are traveling by car and heading somewhere else, even a short walk down a trail can get you away from almost everyone.
To see a little of the park, and to get started on the key ideas that will be on the RockOn Quiz, join Dr. Alley and his team as they take you on a "virtual tour" of Great Smoky Mountain National Park that illustrates some of the key ideas and concepts being covered in Module 4.
Virtual Field Trip: Great Smoky Mountains
Join us as we go on a virtual tour of the. Great Smoky Mountains.
Obduction Zones: The Push-Together Boundaries
Obduction Zones: The Push-Together Boundaries
The Smokies are a small part of the great Appalachian Mountain chain, which extends along the coast of North America from Newfoundland through the Smokies, and then bends westward into Oklahoma. In the Great Smokies, the mountains display a truly remarkable feature—in some places, older rocks sit on top of younger rocks! The very high peaks are composed of hard, resistant, old metamorphic rocks (which we will explain soon), of the sort that one finds deep in a mountain range. Beneath them are younger, sedimentary rocks that were deposited in shallow seaways. Between these is a surface called a thrust fault or push-together fault. Thrust faults often show scratches that form when the rocks on one side of the fault slide past the rocks on the other side. Thrust faulting has been observed during earthquakes in some cases elsewhere in the world where push-together deformation is still active. In the Smokies, the older rocks have been shoved as much as 70 miles (110 km) to reach their present position on top of the younger rocks. The pictures below the video show two very much smaller thrust faults, with the upper rocks shoved up to the left only a few inches, but the idea is the same.
Video: Cades Cove (4:21)
So this is a black bear walking down into Cades Cove in the Great Smoky Mountains National Park. The Smokies formed by obduction. They were formed in a great collision. And you know something about collisions. If this car worked before the Collision, it would have had a front that was fairly long horizontally and fairly short, thin vertically. But when it ran into the wall, you can see what happened. It got squeezed horizontally and thickened vertically. So it's shorter horizontally, thicker vertically. And this one did it by bending and getting squeezed and so on. In the Collision of the Great Smoky Mountains, there was some such bending. But, in addition, older rocks were shoved on top of younger ones, as shown in this diagram where the bear is walking, and we're gonna look at how that happened. First just a little geology terminology. Here's a pile of notebooks and things at our house. And to a geologist, you'd look at the one on the bottom and say that was put there first, it's been there longer, it's an older layer. And the one on the top was put there more recently, so that's a younger layer. Well now let's go to Glacier National Park, and this is a great cliff in Glacier, and we're going to zoom in on this cliff. And what we have here is a pile of layers, something like those notebooks. The one on the bottom is put down first, it's been there longer, it's an older layer. The one on the top was put there more recently, so it's a younger layer. But you'll also notice that if we follow this layer along, how do we find it? Well, we have to go up there, because there's been displacement here, the rocks were squeezed, and the squeeze broke the rocks, to make what we call a fault. And so you have this pile of rocks on both sides, but there's been some shoving going on. And we can put some labels on this to make it a little easy. On the left, you have the older at the bottom, and the younger on the top. On the right you have the older at the bottom and the younger at the top. But right here, notice what happens, the older is sitting on top of the younger. So now that allows us to go back and make sense of where the bear is. So here we are back at the bear, and he is walking through this diagram, with the older rocks on top of the younger. How did it get there? Well, let's do a simple diagram. Here it's older on the bottom, younger on the top, it gets squeezed by push-together stresses, and it's going to break along a fault like this. Okay, now faults sometimes move the rocks up a lot vertically and a little horizontally. The one at Glacier was pretty steep. The fault where the bear is moved mostly horizontally but with a little bit of vertical. And so it moved them a long way horizontal. So, I want you to focus on the "Y" in the younger layer and the "O" in the older layer, and when the fault breaks the O is going to go over by the Y, and you're going to pile it up like this. Well after that happened, after the fault broke, and it moved it like this, erosion happened, and it took down the surface, so it looked something like that, where the bear is. Or it looked like this diagram we've been looking at, or it looked like the bear. And so there we have push-together can bend things, it can squeeze them, but it can also shove older ones on top of younger ones so the bear can be walking on the younger rocks at Cades Cove in the Great Smokies.
You may recall that we started with pull-apart faults at Death Valley. As shown in the video above, thrust faults are of the push-together type. Squeezing from the sides caused one set of rocks to be pushed over another set. Each set is right-side up, but where they meet, the older rocks are on top of the younger ones. This is seen clearly in the Great Smokies.
Farther north, near Penn State’s University Park, Pennsylvania campus, where Drs. Alley and Anandakrishnan teach and where Dr. Alley wrote most of this material, we see a different way that rocks can respond to push-together stresses. There, in addition to some push-together thrust faults, many folds occur. Take a piece of paper, lay it on your desk, and squeeze the opposite sides towards the center. The paper will buckle into a fold. You may achieve the same effect by trying to push a carpet along the floor. Clearly, there are push-together forces involved here.
Watch this 1:38-minute video about the push-together thrust faults found in Capitol Reef National Park.
Video: Monocline Explained: Capitol Reef National Park (1:38)
[MUSIC PLAYING]
We're at Capitol Reef National Park, home of the famous Waterpocket Fold. In the background, we can see it. This is a classic monocline, and it's a 100-mile-long flexure in the Earth's crust. And Dave's going to help show us how it formed.
This is the Earth's crust. And then 50 to 70 million years ago compressional stress came from the west and caused a bulge. And rocks on the west side were lifted up on along a thrust fault about 7,000 feet higher than rocks on the east side. Later, uplift during the uplift of the Colorado Plateau about 15 to 20 million years ago left it susceptible to erosion, and the top part was eroded off. And you got many of the geological features you'll find in the park, like monoliths, and canyons, and arches.
The reason the Waterpocket Fold got its name is when the younger layers up here were eroded, softer layers beneath were exposed, and formed small basins in which water gathered in, which provided a water source for early settlers.
[MUSIC PLAYING]
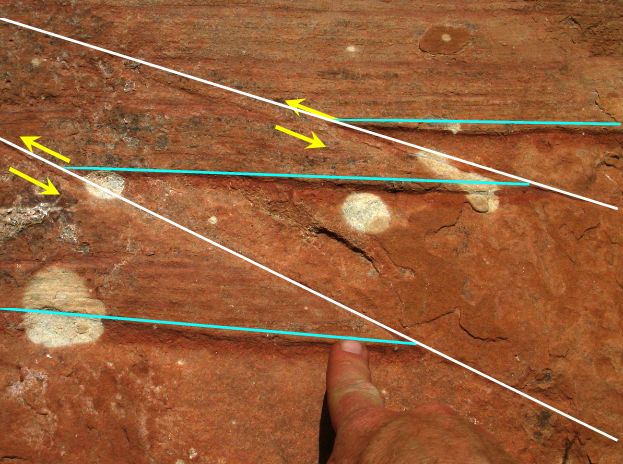
These photos show two small thrust faults, with one bed of sandstone thrust a few inches over another in each fault, and Dr. Alley’s index finger for scale, in a cliff below the Glen Canyon Dam in Arizona. The same principles apply to thrust faults, whether they are tiny or huge —push-together forces shove some rocks over other rocks along a break in the rocks. The rocks were squeezed from left and right, and the yellow arrows show the motion along the faults, which are indicated in white. The turquoise line segments were connected end-to-end as one straight, horizontal line before the rocks moved along the faults.
Virtual Field Trip: Blue Ridge Mountains
To see more on obduction zones, look at the Blue Ridge Mountains VTRIP. It has some pretty pictures, and then a little geologic background. There is another thrust fault, shown by yellow arrows, in the second-to-last picture.
We saw that pull-apart forces occur at spreading ridges. And, if rocks can be pulled apart, they can be pushed together, with push-together forces at subduction zones, or other collision zones. Today, you can look from the Appalachians and from the east coast of South America across the quiet seafloor of the Atlantic, across the spreading center of the mid-Atlantic ridge, to the coastlines of Africa and Europe. The coastlines on either side of the Atlantic are nearly parallel to each other and the mid-Atlantic ridge—slide the new and old worlds back together again, and they fit like a jigsaw puzzle. You can put all the modern continents back together jigsaw puzzle style. This fact, and especially the wonderful fit across the Atlantic, has figured prominently in suggesting the idea of drifting continents to scientists and other observers almost since the first decent maps were available of the Atlantic coasts. More importantly, putting the continent shapes back together in jigsaw-puzzle style puts the “picture”—the geology—back together, as well, for events that happened while the continents were joined. For example, we will see in Module 7 that, if glaciers flow over rocks and then melt, scratches are left that show which way the glacier was flowing. These tracks from a long-gone glacier run out into the Atlantic from Africa, and then out of the Atlantic onto South America. But if you put the continents back together jigsaw-puzzle style, the tracks fit together to show the path of a single glacier from a time when the Atlantic Ocean did not exist. Many other such matches are seen, from the times after the proto-Atlantic Ocean closed and before the modern Atlantic Ocean opened.
The oldest rocks on the Atlantic seafloor are about 150 million years old, approximately the same age as sediments that were deposited in a Death-Valley-type setting in the Newark Basin of New Jersey and elsewhere along the U.S. East Coast. The modern situation of a spreading Atlantic began about then, splitting apart a supercontinent to form the Atlantic Ocean in the same way that Baja California is being split off to open the Gulf of California.
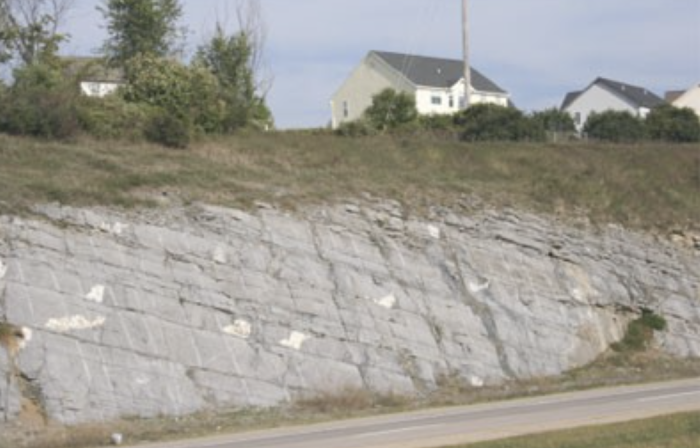
But the Appalachian Mountains are much older than that. A story begins to emerge of a cycle—older push-together forces led to the closing of a proto-Atlantic Ocean that produced the Appalachians. When the proto-Atlantic was closing, subduction-zone volcanoes formed and spread ash layers across the land, much as Crater Lake/Mt. Mazama and Mt. St. Helens did more recently. (Some of those ash layers can be found in many places, including the road cut along the Route 322 expressway just south of East College Avenue in the State College, PA area). Sometimes, the proto-Atlantic subduction zones formed offshore, formed volcanic island arcs, and then their volcanoes moved and collided with the North American continent.
When the pushing stopped, the giant pile of the Appalachians, with deep, hot rocks beneath, began to fall apart in Death Valley style, and red sandstones and mudstones accumulated in Death Valley-style valleys along parts of the U.S. East Coast. Some of these have interesting fossils, such as the dinosaur tracks at Dinosaur State Park in Connecticut; the real tracks are shown in the picture with an artist’s rendition of how the landscape might have appeared. The drop in pressure deep in the earth as the Appalachians fell apart probably caused a convection cell in the deep mantle to rise right there, eventually forming the mid-Atlantic Ridge and the Atlantic Ocean.
![Eubrontes [or Bipedal theropod] fossilized trackway and diorama](/geosc10/sites/www.e-education.psu.edu.geosc10/files/Images/Unit_04/Eubrontes.jpeg)
Such a cycle, with subduction or continental collisions building mountain ranges that then spread Death-Valley style and eventually split to make ocean basins, has been played out many times over the history of the Earth. And the fun isn’t over yet; North and South America are cruising westward toward Australia and Asia, as the Atlantic widens and the Pacific narrows. Africa is still bumping into Europe and pushing up the Alps, and India has not yet grown weary of ramming Asia to raise the Himalayas. At fingernail-growth speed, the next 100 million years or so should lead to a lot of geological high drama, but the next 100 years won’t see a whole lot of change. The 1:15 minute silent animation below provides a good visualization. (The animation would be more accurate if it made the crust a little thicker in the collision at the end, but otherwise, it is quite good. The animation shows that after the ocean spread for a while, the sea floor near the continent became cold enough and thus dense enough to start a new subduction zone. That might happen on one or both sides of the Atlantic in the future.
Video: Geology: Wilson Cycle (1:15) This video is not narrated.
The key to most of this is that you can sink old, cold sea floor, but you can’t sink a continent. Island arcs and continents float on the mantle too well. So rather than going down the subduction zone with the oceanic lithosphere, an island arc or continent will ride across the subduction zone for a major collision. In such a collision, called obduction, layers of rock are bent into folds such as those near Penn State’s University Park campus, or broken into thrust faults such as those under the Blue Ridge and the Great Smokies. In the case of the Appalachians, the thrust faulting was very efficient, with older rocks sliding tens or hundreds of miles (or kilometers) over younger ones in some places.
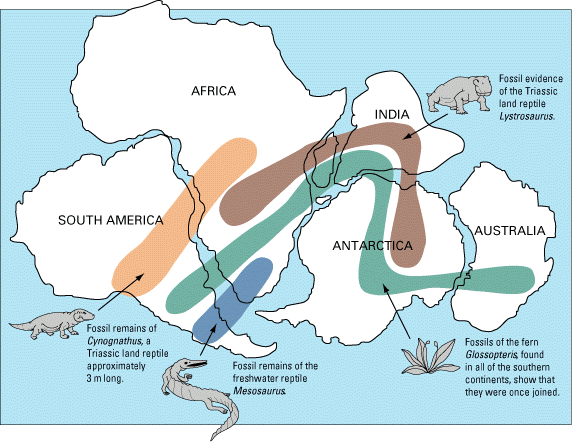
To see drifting continents in the past and the future, see the video 240 million years ago to 250 million years in the future.
The Three Structural Styles
The Three Structural Styles
You have now seen, at least briefly, the three structural styles that are possible: pull-apart (Death Valley, spreading ridges); push-together (Crater Lake and Mt. St. Helens subduction, University Park and the Great Smokies obduction); and slide-past (the San Andreas Fault in California). Pull-apart behavior involves stretching of rocks until they break, forming pull-apart or gravity faults (after being pulled apart, gravity pulls one block down past the other). Pull-apart action occurs at the spreading centers, probably where the convection cells deeper in the mantle spread apart. Push-together behavior occurs at subduction and obduction zones, and produces squeeze-together folds and faults, with the faults also known as thrust faults. Slide-past boundaries, also called transform faults, occur where two large blocks of rock move past each other but not toward or away from each other. Slide-past motion produces earthquakes without mountain ranges.
Video: San Andreas Fault (3:16)
Here's a picture of perhaps the most famous slide-past fault in the world, the San Andreas Fault at the Carrizo Plain in California. We're going to look at these slide-past faults and we'll also look at what happens when one of them bends. So here's a map of it. And we're going to the Carrizo Plain National Monument, here. Notice the motion of the fault that's indicated. The fault is pretty easy to see if you look at a picture of the Carrizo Plain. There is the fault in yellow. The motion is shown in orange. You can see the motion in the geology. Here, for example, is Wallace Creek, coming in from the right. You might expect it to go straight, the way it once did, but what does it do? It's been deflected by the motion of the fault and it's carried up like that, and then leaks on out the other side. So the fault is moving. It can make earthquakes. People worry about that. But now, let's go back to the map and let's go down to the San Gabriel Mountains National Monument, and the big bend in the San Andreas fault. So down here the fault is not straight, it's bent, and because of the bend, this motion leads to a pushing together across the San Gabriel Mountains, at the Big Bend. And so we're gonna now see what that does by this next picture, looking across Los Angeles towards the mountains and the National Monument, and there it is, there's Los Angeles. Behind them is the mountains. The push together across the Big Bend has led to stresses that have pushed up the mountains. There are earthquakes associated with this. This is from the 1994 Northridge Earthquake. It was on a thrust fault down in the Basin closer to Los Angeles, but it's related to the squeeze of the big bend. If we go back to our map, imagine for a moment a fault that went the other way. Now what would happen is this, this motion would be carrying this side down, this side up, and you would have pull-apart going on in here. And, in fact, there is a little bit of that going on. Over here there is a pull-apart Basin that has a salty lake in it called the Salton Sea. It is linked to this kind of horizontal motion. This one's from the interaction of a couple of faults, it's a little more complicated, but it is possible to have pull-apart with a bend one way or to have push-together with the bend the other way. And so what do we see? Slide-past faults can make earthquakes, like the San Andreas, but when they bend they may cause push-together that helps to make mountains, or they may cause pull-apart that helps to make basins.
Now, you might imagine that we have oversimplified just a little. There is no law that rocks must move directly toward each other (push-together), exactly parallel to each other (slide-past), or directly away from each other (pull-apart); sometimes you see an oblique motion with rocks approaching on a diagonal. Or the rocks may pull apart on a diagonal. And, a bend in a slide-past boundary may produce pull-apart or push-together features, depending on which way the bend goes relative to the motion, as shown in the video above. A large bend in the San Andreas Fault just north of Los Angeles gives push-together motion, with some impressive mountain ranges and dangerous earthquakes.
Mountain ranges correspond directly to the main boundary types. Fault-block mountains—the Sierra Nevada, the Wasatch Range, the flanks of the great rift valleys of Africa, and the mid-oceanic spreading ridges—form at pull-apart margins. The mountains are high because the rocks beneath them, in the mantle, have expanded vertically because they are the hot upwelling limbs of convection cells. Volcanic-arc mountain ranges form over subducting slabs, where some of the downgoing material melts and is erupted to form stratovolcanoes; smaller ranges (such as the Coast Ranges of the Pacific Northwest, including Olympic National Park) may form from the sediments scraped off the downgoing slab just above the trench. Continent-continent or continent/island-arc obduction collisions occur at push-together convergent boundaries as well, producing folded and thrust-faulted mountain ranges.
Why the Great Smokies Are Still So High
Why the Great Smokies Are Still So High
Remember that crustal rocks are the low-density “scum” that floats on the denser mantle. When obduction occurs, this crustal scum is crunched—it goes from long and thin to short and thick, in the same way, that the front end of a car is changed when it runs into a brick wall, or a carpet is changed if you shove the ends together and rumple it in the middle. Then, much like an iceberg floating in the water, a mountain range is a thick block of crust floating in the mantle, with most of the thickness of the mountain range projecting down and only a little bit sticking up.
Notice something else fascinating; when a mountain range is being eroded, the top is taken off, and rocks below bob up almost as high as before. Erosion continues to remove those almost-as-high rocks, allowing more rocks from below to rise. Pretty soon, the rocks at the surface have come from far down in the Earth, where temperatures and pressures are high. And as you might imagine, those rocks were changed by the high temperatures and pressures. The rocks around Penn State’s University Park campus have not been “pressure-cooked” much, but the rocks around Philadelphia have been - they tell the story of a great mountain range that fell apart, leaving the remnant that we know as the Appalachians. The rocks in Rocky Mountain National Park are like those in Philadelphia, in the sense that they once were deep in the Earth and now are at the surface. This is similar to how icebergs work. See the animation below about icebergs to learn more about how isostasy works.
With an iceberg, about 9/10 of the thickness is below the water and 1/10 above. As shown in the narrated diagram below, if you could instantly cut off the 1/10 that is above water, the iceberg would bob up to almost as high as before. A 100-foot-high berg would have 10 feet above the water and 90 feet below. Cut off the top 10 feet, and it is a 90-foot berg with 9 feet, or 1/10, above the water and 81 feet below. So, removing 10 feet from the top shortens the ice above the water by 1 foot and the ice below the water by 9 feet. With mountain ranges, the density contrast between crust and mantle is larger than that between ice and water—only about 6/7 of a mountain range projects down to form the root, and 1/7 projects up to form the range.
Video: Icebergs (3:02)
Out in the ocean, there's a giant iceberg sitting out here. Big thing threatening the oil platforms floating around. And in the bottom of this very special iceberg, there is a really strange looking, googly-eyed space alien. And you have been given the task to go out there in your little boat sitting here in the water to get the space alien out.
Now, you're a good geosciences 10 student and you know that all icebergs have about 1/10 above the surface, and they have about 9/10 below the surface. So you know immediately what to do. You take your gimongous chainsaw and you chainsaw off the top of the iceberg and throw it away, because you know what this will cause is that the iceberg will come bobbing up, carrying the space alien with it.
And so after it gets done bouncing up and down for a little bit, you find that the iceberg is almost as tall as it was before. It still has, sitting way down in the bottom of it, the space alien that you're trying to get to. So there's a space alien down here. And it still has about 1/10 of its height above the surface and about 9/10 of its height below the surface.
But what you find is it's just a little bit shorter than it was, and it doesn't stick down quite as far as it did. Now you wump the top off again, and you keep wumping the top off, and you keep wumping the top off. And after a long time, you get down to a little iceberg that doesn't stick very far down.
Now it still is the same picture, that it has 1/10 above, and it has 9/10 below. And if you're not careful, you're sitting there admiring this lovely fact of science, and the space alien sticks out a giant tentacle, and it grabs your ship and throws it to the bottom of the sea. And so you'd better not do that.
However, there is a scientific piece to this. Suppose instead of space aliens, that we wanted to talk about mountain ranges. Now, we know that mountain ranges stick up above the plains. But you might not have known that they also stick down.
They have a root in the same way that an iceberg has a root that it's sitting on. There's a slight difference in that about 1/7 of a mountain range is up and about 6/7 of a mountain range is down, way down. The rocks have been heated. They've been squeezed. There's all sorts of interesting things going on and new minerals being grown.
And at the surface, the streams are sitting here, busily trying to grind away the mountain range. As the streams grind away the mountain range, why, the deep stuff will come bobbing up towards the surface. And if you come much later and look at it, you'll find that the rocks have barely any mountains left.
There's still a little bit of root with 1/7 up and 6/7 down. But now what you'll find is that the rocks that had been cooked way down, and bent way down, are very near the surface. And you can go see them.
Still, if rivers or glaciers erode a mountain range (something we’ll study in modules 5, 6, and 7), some of the root is freed to float upward. Only by eroding the equivalent of 7 mountain ranges can you eliminate the mountain range entirely. So, the Appalachians, despite having been deeply eroded, are still high because they still have a root.
The idea that things on the surface of the Earth float in softer, denser material below is called isostasy, which means “equal standing”—each column of rocks on Earth has the same weight or standing. Lower-density columns then must be thicker to weigh as much as thinner, higher-density columns. The continents stand above the oceans because the silica-rich continental crust is lower in density than the silica-poor sea-floor crust. The mountain ranges stand above the plains because the thick, low-density roots of the mountains have displaced some of the high-density mantle that is found beneath the plains, or because the rocks beneath the mountains are especially hot and so low in density. Look back at the animation about icebergs to learn more about how isostasy works.
Put a big weight on a piece of crust (say, an ice sheet, or the Mississippi Delta, or a mountain range) and that piece of crust sinks, pushing up material around it in the same way that the surface of a waterbed sinks beneath your posterior when you sit down, while the surface is pushed up around you by the water that is shoved sideways. The rising and sinking of the land are slower than for a waterbed—thousands of years rather than seconds—because the hot, soft, deep mantle flows a lot slower than water does. But for a mountain range over 100 million years old, a few thousand years doesn’t mean much.
Still More Plate Tectonics: The Rocky Mountains
Still More Plate Tectonics: The Rocky Mountains
Mountain Building and Metamorphism
Rising high above Estes Park, Colorado, and almost within shouting distance of the population centers of Boulder and Denver, Rocky Mountain National Park is a natural destination for the crowds that throng to this mountain playground. Long’s Peak, at 14,256 feet (about 4300 m), dominates the south-central part of the park; the peak was first climbed in 1868, by a party that included John Wesley Powell, the man who later commanded the first boat passage of the Grand Canyon and then led the United States Geological Survey. Numerous peaks over 13,000 feet (4000 meters) in Rocky Mountain lure climbers.
Small and rapidly shrinking active glaciers still carve the mountains, and much greater glaciers of the past left the numerous tarn lakes, moraines, and other features that decorate the park. Trail Ridge Road surmounts the high tundra of the park, giving the visitor a first-hand look at periglacial processes and ecosystems (those of cold regions; more on this later). The Colorado River rises on the west slopes of the park, and lovely little trout streams such as the St. Vrain flow down the east slope. Bighorn sheep and elk attract traffic jams in Horseshoe Park.
Virtual Field Trip: Rocky Mountains
Join us as we go on a virtual tour of Rocky Mountain National Park.
Raising the Rockies
Raising the Rockies
It is a tad embarrassing to say that we don’t fully understand the geological history of the Rocky Mountains yet, including the history of Rocky Mountain National Park. The long history of mountain building, erosion, glaciation, etc., is well-known—we can tell the story. But most mountain ranges hug coasts or are formed as coasts disappear in an obduction collision when the ocean closes and obduction occurs, whereas the Front Range of the Rockies is as far as almost 1,000 miles (1600 km) from the coast, yet the Rockies are not the direct result of obduction.
The U.S. West is a complicated region (see the Optional Enrichment section for a little more on this). The continent has been approaching and overriding the East Pacific Rise spreading ridge, which is much like the mid-Atlantic Ridge but is no longer in the middle of an ocean. The San Andreas Fault formed as the East Pacific Rise reached the trench. Before these met, subduction had been occurring beneath the western USA from push-together motion, but with a little slide-past motion thrown in. After the meeting, the subduction stopped, so the push-together stopped, but the slide-past remained to make the San Andreas Fault. To the north of the San Andreas Fault, subduction is still active, forming the Cascades including Mt. Rainier and Mt. St. Helens.
Long ago, the west-coast subduction zone started in the usual way, with the old, cold ocean floor going down into the deep mantle. But as the continent approached the spreading center, the down-going ocean floor became progressively younger, and thus warmer and more buoyant because not as much time had passed for it to cool after its volcanic origin. This warmer ocean floor didn’t “want” to go down, but it was still attached to the older, colder floor ahead of it that was going down. So, the ocean floor that went under the continent stayed high, rather than sinking, and rubbed along the bottom of the crustal rocks rather than plunging steeply into the mantle. The friction between this buoyant subducted ocean floor and the crust above, in turn, caused thrust-faulting and crustal thickening far inland (see the figure below). Because the western part of the country has been built up of many old rock bodies and sediment piles bulldozed from the Pacific, there are scars of many old faults and other geological features that have been reactivated by recent events, so mountains and valleys have formed along the old weaknesses in response to the new pushes.
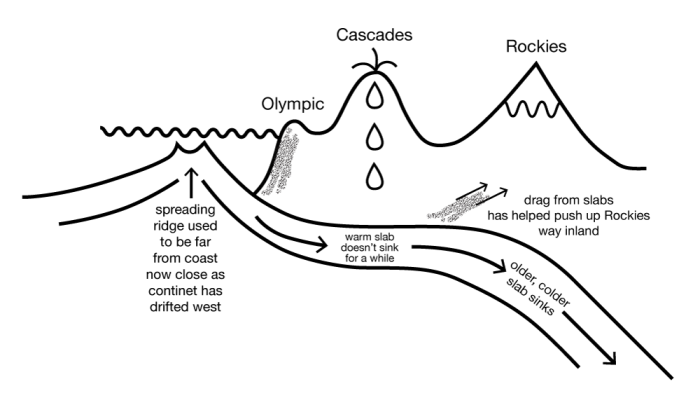
As to exactly how this came to produce 14,000-foot (4300-m) peaks in the Rockies, geologists can tell the story, but it isn’t clear that any geologist could have predicted this story without seeing the rocks first. Science moves from explaining (easier) to predicting (harder), so we still have some work to do. (And we've oversimplified a bit here; see the Optional Enrichment for more.)
The video below provides additional information in support of the diagram above.
Video: The Rockies (1:57)
We've been looking at how spreading ridges under the ocean make seafloor, which moves away from them and eventually gets old and cold and sinks down. And it will be sinking down beneath a continent, often, and it will scrape things off to make the Olympic. And then it will have a big volcanic range such as the Cascades, Mount Saint Helen's, and so on.
And they will be sitting there next to the ocean, which we can draw in. And coming up from below, there will be melt to make seafloor out here. And coming up from below there will be materials that erupt at the volcanoes like that.
Now, that works all fine, but what happens when there is a little bit of a swinging down of the slab? We know that the slab is moving away from the seafloor spreading ridge, as I show here. But the slab really does have a little of this swinging down, as well, in some cases. And the continent moves to catch up with it.
And so pretty soon, the continent is going to end up getting close to the spreading ridge. And the stuff going down is then not going to be cold. It's going to be getting warmer.
And when that happens, we have to erase this, because now the materials don't want to go down anymore. You'll get something that goes more like this, with it running right underneath the edge of the continent and staying high. And where it runs under the continent and stays high, you'll get a lot of rumpling, a lot of pushing happening in this way. And so then you might expect to see something that gets pushed up like this. And we're reasonably confident that that sort of push-up is what the Rockies are.
In a few cases, as in the west, where the San Andreas Fault is, in fact, the subduction zone has been pushed all the way out and has run over the spreading ridge. And, the subduction zone and the spreading ridge annihilated each other. And then you've got the San Andreas Fault.
The Rockies, like the Smokies, were formed by push-together stresses, and the high peaks float on a thick root. Erosion of the peaks has allowed the root to bob upward, so the rocks revealed at the surface include types that formed far down in the Earth and then were brought to the surface. This includes rocks such as granite that solidified from melted rock far below, and the changed—metamorphic—rocks we will discuss below. The bobbing up of the mountains tends to drag surrounding rocks upward. If you drive toward the Rocky Mountains in Colorado from the plains to the east, you can see these dragged-up rocks adjacent to the high peaks. See the narrated diagram for more background.
Video: Red Rocks (2:36)
We're going to learn some things about metamorphic rocks now. But we're going to start with my finger shoved up through a piece of paper. And when I shoved the finger up, it dragged the paper up along that curve you see indicated by the red arrow. We've been talking about mountain ranges formed by squeezing together, that gives you high peaks, floating on a thick root. And how once you get those peaks up there, erosion tends to take them off. But then the root comes bobbing back up to make the peaks almost as high as they were. You might think that if you had some layers of rock nearby that they would be dragged up along the rising mountains, and in fact they are. And you can see this in many places. One of the really good places to see it is along the front of the Rockies. So this is just outside of Denver, at a place called Red Rocks. The mountains are just off to the left of this picture, and they bobbed up like that. And you can see these dragged-up rocks that are so spectacular along there. You find this all along the front of the Rockies. This is down at Garden of the Gods near Colorado Springs. The dragged-up rocks are in the foreground and in the back is Pike's Peak. Pike's Peak here is granite that solidified way down in the earth, and it is surrounded in many places by metamorphic rocks. Now metamorphic rocks most commonly start out as mud, as a mud rock that's called shale. And if this is buried way deep in the earth, it is heated, it is squeezed, it gets chemically active fluids, it changes. By the way, that is the toe of my running shoe for scale, so you know how big it is. And when it changes, you may end up with either melted rock altogether, you get granites, or you can end up with metamorphic rocks. And here are some metamorphic rocks at the bottom of the Grand Canyon. You find things like this in the Smokies, the Rockies, and elsewhere. So it really is true - the mountains get high by being squeezed horizontally. They have deep roots. Erosion takes off the top. The bottom comes up. Sometimes you see where the next-door rocks were dragged up, and eventually, in the heart of the mountain range, you see something that once was very, very deep.
Cooking the Earth
Think about cooking. If you mix up a bunch of ingredients to make a cake batter, throw the mixture into a pan, and put it into a warm oven, the cake you obtain will not be very similar to the mixture you started with. Grill a steak or a meat substitute, and the original cow part or vegetable-based material will come out quite different. Marinate the steak or meat substitute before grilling, and more differences appear. It is common knowledge that a material that is stable in one environment will change if it is placed in a different environment. This is true of everything (and everyone!) on Earth.
The Earth has a great range of conditions. The inside of a mountain range is hotter, has higher pressure, and is less affected by acidic groundwaters than the surface. Materials that are stable at the Earth’s surface (such as the clays in a piece of shale) are not stable deep in a mountain range. The minerals change, grow, and produce new types even without melting. This process is called metamorphism. Metamorphism makes rocks that many people consider to be especially pretty (see the video on “Toothpaste Rocks” from the Grand Canyon), produces some wonderful gems, and contributes rock names that make good puns. (The Geoclub at Wisconsin liked puns and used a metamorphic rock, a volcanic rock, and a sedimentary rock in claiming that geologists are “gneiss, tuff, and a little wacke.”) You can read a little more about rocks and minerals in the Enrichment section.
Toothpaste Rocks: Grand Canyon National Park
Metamorphic rocks—those cooked and squeezed deep inside a mountain range—are often especially pretty. At the bottom of the Grand Canyon, you can see such rocks. They were formed long ago, and many miles down, and then reached the surface as erosion removed the mountains above and the deep roots of those mountains floated upward. Later, these rocks were buried again under sediments from oceans, rivers, and wind, and finally revealed to us as the Grand Canyon was carved by the Colorado River. Some people—including Dr. Alley—think that these rocks are so beautiful that they're worth the overnight hike into the canyon all by themselves!
Video: Toothpaste Rocks - Grand Canyon National Park (2:22)
[MUSIC PLAYING]
This is the most glorious place. Just look at this place. We're sitting on these old rocks, these seriously old, 1.7 billion-year-old rocks.
Everything around us that's black didn't quite melt. Everything around us that's pink actually did. That was molten magma squirting into cracks. And the stuff that didn't melt was like toothpaste. It was so soft, because it was so hot, that it just flowed and crinkled and folded, and--
It's been bent, and one can follow any of these layers along. And you see that they wiggle, and they come around, and then they come out here and back. And so these rocks were really, really hot. They were almost up at the melting point.
And they were being squeezed. There was mountain building of some sort going on that caused them to have squeezing and to be pushed from here to there. And as they go, very often, you get something like this folding. If you take a phone book and squeeze it, it'll fold. And in the same way, when you squeeze these rocks, you end up folding them.
The other part that's interesting, here, is that we can see these beautiful things so very well because this stream has come over them. And it's eroded them, and it's polished them. And the surface that we're on is very smooth.
But this is the heart of the mountain. This is what it would look like if you could get down in a mountain range somewhere, down there about 5 or 10 miles. And that's what we're standing on.
Migmatite. M-I-G-M-A-T-I-T-E. It's not quite magma. It's migma. Mixed magma. And you'll see all of these awesome morphs and wiggles and the little things through here.
This melted. This didn't. This melted. This didn't.
Oh, this layer-- that's beautiful. These things have been really, really hot.
Where Tectonics Meet People: Tsunamis
Where Tectonics Meet People: Tsunamis
Tsunamis
We have been looking at the ways that rocks move around on Earth and make mountains and some of the ways that this mountain building can threaten humans. Volcanoes and earthquakes are sometimes truly dangerous and damaging. But it is worth remembering that, in the developed world, only a few percent of us die in “accidents,” and car crashes greatly dominate those deaths (so the great majority of us die of other things, such as heart disease, cancer, etc.). With good scientific warnings, good zoning codes, trained medical personnel, hospitals, and ambulances to take care of us, nature kills very few of us (something like 0.03% of deaths in the US in most years). (In the less-developed world, this is, sadly, less true.) For the developed world, things we do to ourselves (smoking, eating, drinking too much, not exercising enough) are far, far more destructive to health and life than anything the planet does to us.
But it is still wise to know about the dangers from the Earth—part of the reason so few of us die from natural disasters is that we are already doing wise things to avoid being killed by nature! Some of those wise things involve preparing for giant waves—tsunamis (and preparing for earthquakes, landslides, volcanoes, floods...). Tsunamis are not directly related to our National Parks in this module, but tsunamis are related to some of the processes that helped make the Great Smokies and the Rockies. Anything that makes earthquakes, volcanoes, or steep slopes in or near the sea might be involved in a tsunami. And tsunamis can be truly horrific. We’ll start discussing a long-ago tsunami from a hot-spot setting and then look at other tsunamis closer to us.
Anomalous deposits are found on the flanks of many of the Hawaiian Islands, including Lanai, Molokai, and Maui, to at least 1,600 feet (500 m) above sea level. These deposits are composed of broken-up, mixed-up, battered corals, other shells, and beach rocks. Corals are undersea creatures and surely don’t grow 1,600 feet above sea level. It is true that some corals grow just below sea level and later are raised above the water by mountain-building processes; however, these Hawaiian deposits occur on islands that are sinking as they slide off the “hill” made by the Hawaiian hot spot, and the deposits are geologically too young to have been raised so far by mountain-building processes. Clearly, something strange happened.
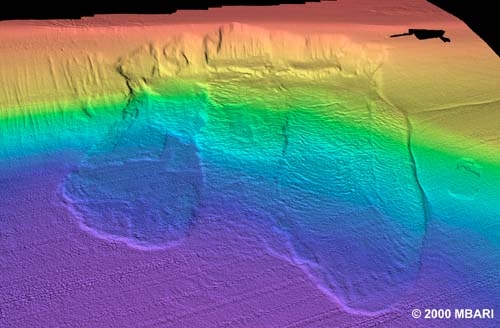
One of the deposits, in particular, is the same age as a nearby, giant underwater landslide, as nearly as the age can be measured. The Hawaiian volcanoes have rather gradual slopes above the water, where the hot, low-silica lavas spread out to make shield volcanoes. But when lava hits the water, the hot flow cools and freezes very quickly, and can make steep piles. When a slope is too steep, it can fail in a great landslide, perhaps when melted rock is moving up in the center of the island and shoving the sides out to make them steeper. Surveys by specially equipped research vessels using side-scanning sonar have shown where several such slides have slipped. Such landslides can be miles thick, tens of miles wide, and over 100 miles long.
If a chunk of rock miles thick and tens of miles wide suddenly starts moving, maybe at hundreds of miles per hour, it will shove a LOT of water out of the way. Where will the water go? The answer is that it will make a huge wave, or tsunami, that will race across the ocean, and up onto any land it encounters. Imagine a wave so huge that it would run far inland and reach heights of 1,600 feet above sea level. Fortunately, the highest deposits in Hawaii are from a tsunami about 110,000 years ago, long before people were living there. Although many such tsunami-generating landslides have occurred, they typically are spaced thousands of years apart or more. But we can’t guarantee that there won’t be another one. See the animation below for a worst-case scenario.
Video: Tsunami visualization (2:05)
An especially nasty feature of a tsunami is that the water often goes out before it comes in. (Waves consist of troughs and crests, and while the crest arrives first in some places, the trough arrives first in other places.) The sudden retreat of water and exposure of the sea floor, tempts people to walk out and look around. Then, the ocean returns faster than a person can run. The outcome is very unpleasant.
The word tsunami comes from two Japanese words, for harbor and wave, a sort of shorthand for a wave that devastates a harbor. Most tsunamis are generated by undersea earthquakes, but undersea landslides, volcanic eruptions, and even meteorite impacts in the water and can generate tsunamis.
Tsunamis move rapidly across the deep ocean, with speeds of 300 to 500 miles per hour (600 to 1000 kilometers per hour). In the deep ocean, the “bump” of water that is the wave of a big tsunami may be only a very few feet high but may extend well over 100 miles in the direction it is moving. Waves slow down as they enter shallower water, and the leading edge of a wave hits shallow water before the trailing edge. So, the leading edge slows as it nears the coast, the trailing edge that is still in deep water catches up, and the wave goes from being long and low to being squashed and high. Even so, the tsunami wave is usually not a towering wall of water, but a strong surge, something like the tide coming in but higher (hence the mistaken name “tidal wave”).
An especially nasty feature of a tsunami is that the water often goes out before it comes in. (Waves consist of troughs and crests, and while the crest arrives first in some places, the trough arrives first in other places.) The sudden retreat of water and exposure of the sea floor tempts people to walk out and look around. Then, the ocean returns faster than a person can run. The outcome is very unpleasant.
Video: NOAA Tsunami Animation (1:27) This video is not narrated.
Terrible tsunamis have occurred. The greatest loss of human life from a tsunami was probably the Indian Ocean tsunami of 2004, which was triggered by the second-largest earthquake ever recorded, and killed roughly 230,000 people. Second was the tsunami from the 1755 earthquake near Lisbon, Portugal that killed about 60,000 people, especially in Morocco, Portugal, and Spain. The massive 1883 explosion of the volcano Krakatau in Indonesia essentially destroyed the island, with tsunami waves observed as far away as England. Floods raced miles inland on Java and Sumatra, killing approximately 40,000 people. The volcanic eruption of the Greek island volcano Santorini in the 1600s BCE pushed a tsunami perhaps 300 feet (100 m) or higher across the coast of Crete and may have contributed to the eventual demise of the Minoan civilization there. Many commentators have suggested that this is the source of the myth of Atlantis. The great 1964 Alaska earthquake generated a deadly tsunami that killed 118 people, with deaths as far away as California. In 1958, an earthquake-caused landslide in Lituya Bay, Alaska, caused a tsunami that included a wave 50-100 feet high in the bay, which a father and son safely rode out in a boat. They watched in awe as the wave then ran 1,800 feet up an adjacent coast; five people were killed in the event. Many other destructive tsunamis have occurred.
There isn’t a whole lot that can be done to stop tsunamis, but the loss of life and property damage can be limited. Tsunami warning systems are functioning in many places and are being extended rapidly. When instruments (called seismometers) sense the shaking of the Earth from a large undersea earthquake, volcano, or other disturbance, the signals are analyzed rapidly to see if characteristics suggest that a tsunami is likely, and if so, communications are sent out to various agencies concerned with safety, and sirens or other warnings on beaches are activated to get people away from the coast before the tsunami arrives.
The Indian Ocean tsunami of 2004 seems to have been especially deadly in places where human activities had caused damage to the coral reefs and coastal vegetation that would have blunted the strength of the wave, so maintenance of such natural buffers along these and other coasts can help protect the people living nearby from any future tsunamis. Scientists can figure out where tsunamis are likely, how big and how frequent they are likely to be, and then zoning codes can be enforced so that people build in safe ways on safe land if they want to live in an area.
Virtual Field Trip: Tsunamis
Please join us on a virtual field trip of Tsunamis.
Optional: Want to see more?
Tsunami Visualizations
(An extensive collection of animations on this subject)
Mountain Uplift and Erosion
(An extensive collection of animations on this subject)
Optional Enrichment Article
Optional Enrichment Article
Raising the Rockies
As noted in the text, the geologic history of the US West is quite complex, with some big questions not yet answered, and more work to be done. The most widely accepted history, with the most scientific support, is sketched in the text and given in a bit more detail just below and in the Optional Rock Video Review, The Hanging Wall.
Much evidence indicates that before about 100 million years ago, the down-going rocks in the subduction zone in the west went down steeply, but after that time the rocks' angle reduced (so, the rocks continued to move horizontally, but with less downward motion). The Pacific seafloor that was sinking under what is now Seattle is called the Farallon Plate, and rather than going down somewhat smoothly into the deeper mantle, the Farallon began to move along just beneath the lithosphere of the North American plate. The text notes that the plate was slowly getting warmer over time and thus more buoyant because the ridge and trench were getting closer together, so the plate was having less and less time to cool off before it went down the subduction zone. Another reason, and perhaps a more important reason, may be that a huge volcanic outpouring on the sea floor more than 100 million years ago made a thick layer of not-very-dense rock, which began going down the subduction zone about 100 million years ago. Where smaller bumps on the sea floor are going down subduction zones today, as off Costa Rica, features like those seen in the US West are forming, so the bigger features of the West are easy to explain this way.
Anyway, friction between the top of this buoyant Farallon Plate and the rocks above it—the rocks that we see in the Rocky Mountains and elsewhere in the US West—began to squeeze, bend, and break those rocks above. The breaks are thrust faults, with older rocks thrust upward and over younger rocks to make the mountains. You will recall that the rocks above the fault are the “hanging wall”, which gives rise to the pun in the Rock Video.
Where a fault didn’t break all the way to the surface, it often raised the rocks above (think of lying on your back in bed under covers and then raising your knees—the cover draping over your knees represents the unbroken rocks). If the rocks were raised in a more-or-less circular pattern when viewed from above, we call the feature a dome; if shaped more like a US football when viewed from above, it may be called an arch, and a few other names are sometimes used. Such uplifts gave us the Black Hills of South Dakota (with Wind Cave National Park), the Waterpocket Fold of Capitol Reef National Park, the Kaibab Uplift that the Grand Canyon cuts through, the beautiful San Rafael Swell of central Utah, and many other features of the West. These events mostly happened soon after 100 million years ago, during what we now call the Sevier Orogeny, and somewhat more recently in the Laramide Orogeny—we see more faults from the Sevier and more uplifts from the Laramide.
The squeezing and thrusting of mountains caused some layers to bend down while other layers bent up. One of the low places this caused held the lake in which the pink limestones were deposited that we now see at Bryce Canyon National Park and Cedar Breaks National Monument, and similar lakes gave us the Green River limestones that produce such fantastic fish fossils from farther north in Utah. Oil is found in the west in some of the rocks that were bent down, too.
The Farallon Plate probably eventually broke, and a new, “normal” subduction zone started up, feeding Mt. St. Helens and Mt. Rainier in the west. The Farallon Slab is now sinking beneath the eastern part of the US. As it sinks, it creates space into which hot rock flows slowly, and this may be helping “rejuvenate” the Appalachians, so the Great Smokies and other parts of the Appalachians are a bit higher than they would be otherwise because of processes traceable back to the Rockies and the Farallon. Why the Farallon “decided” to sink eventually may be because, as it ran into thick rocks beneath the west, either some of the low-density parts were peeled off so the higher-density ones could sink, or the low-density ones were shoved deep enough that the pressure changed the mineral structures, making denser minerals that can sink.
Anyway, there is still much to discover about the western US. But, to catch a light-hearted version of what we know, check out the tale of a geology student trying not to be hung on the Hanging Wall.
Video: Hangin' Wall (4:29)
[MUSIC PLAYING] PROFESSOR RICHARD ALLEY: (SINGING) I came out from the Eastlands, and so no one made a slip. I showed 'em my intentions with a Brunton on my hip. I came out to where the mountains, cliffs, and mesas tower tall, to read the planet's story written on the hanging wall, on the hanging wall.
[MUSIC PLAYING]
I was hungry, young, and foolish when I started on my quest. But with a hammer, and a field book, and a map that pointed west, I left behind the ridges that the rivers rounded small to learn the truth or perish here hung from the hanging wall, from the hanging wall.
100 million years ago beneath Pacific brine, the Farallon was sinking down subducting smooth and fine 'til the slab of thickened sea floor tried to squeeze through spaces small. And the squeeze is on the westlands that would make the hanging wall, make the hanging wall. Severe Sevier orogeny, a thin-skinned thrusting belt, as the friction of the buoyant, thickened ocean plate was felt. It broke the rocks and thrust from westward raising mountains tall. Older rocks thrust over young to make the hanging wall, make the hanging wall.
[MUSIC PLAYING]
As the thickened crust moved eastward and then turned to sink anew, the Laramide Orogeny raised domes and arches too. The Black Hills, Water Pocket, and the Kaibab as well, Wind Rivers and Uintas and the great San Rafael Swell, great San Rafael Swell.
From mountains rising in the west, a heavy load was shed, and now basal conglomerate records that river bed. But fining up and liming up soon gave us what it takes to wash the West's interior, Bryce and Green River Lakes, Bryce, Green River Lakes. But the spreading ridge, it hit the trench to make a slab window, a growing space that filled in with a hot, upwelling flow. The squeeze relaxed, the mountains spread, and though it may seem strange, new hanging walls dropped downward, normal faults, basin and range, normal faults, basin, and range.
Volcanoes leaked up some new faults, but in other outcrops clear. In the footwalls of young normal faults, old thrust faults now appear. I can read the mighty story and it leaves me feeling small. I lift the map another day safe from the hanging wall, from the hanging wall.
I'm older now and wiser as I head back from my trek. But I won't die with a hempen rope around a stretched-out neck. There's still more to learn tomorrow as it holds me in it's thrall. I'll be back to read what else is written on hanging wall, on the hanging wall. Hanging wall, hanging wall, I'll be back to read what else is written on the hanging wall.
Still more about plate tectonics and related topics
What happens when you "cook" a rock metamorphically depends on how hot it becomes, and what chemically active fluids are present, and the pressure and deviatoric stress. Both pressure and stress have units of force per area and represent a "push" on a material. Pressure is the part of the stress that is the same in all directions--it squeezes rocks or fluids to make them smaller but doesn't tend to change their shape. Deviatoric stress, sometimes just referred to as stress, is an extra push or pull in one or more directions, and does change the shape. Deviatoric stress has been involved in aligning the mineral grains of most metamorphic rocks into layers, or folia. Chemically active fluids—water, carbon dioxide, methane, etc.—can add or subtract chemicals, lower melting points, and dissolve and reprecipitate chemicals.
Materials that are stressed deviatorically can have one of three responses. The materials may bend and, when you release the stress, snap back (elastic deformation), they may bend permanently (plastic deformation or creep), or may break. We have already seen examples of all of these. Earthquakes are caused by the snap-back of rocks near faults following bending. Faults such as the San Andreas are the result of breakage, and folds such as those around University Park, or those in the rocks exposed in the heart of the Rocky Mountains, are the result of plastic deformation.
Whether a rock bends elastically or plastically or breaks, depends on the rock itself and on several other factors: heat (or more properly, how close a material is to melting), pressure, deviatoric stress, and even the chemically active fluids, acting over time. Elastic deformation is favored by low stresses, high pressures (to prevent breakage), and low temperatures (to prevent creep). Plastic deformation is favored by low stresses, high pressures (to prevent breakage), and high temperatures (to allow creep). Fracture is favored by high stresses and low pressures (to allow breakage), together with low temperatures (to prevent creep). Pressure matters in breakage because, to break a material, the two sides must be pulled apart, which increases the size of the material. When pressure is high, this is difficult to achieve. Fluids generally soften rocks and promote creep, although the details depend on the fluid and the rock involved. (“Fracking” to recover oil and gas from rock involves first pumping high-pressure fluids into holes to fracture the rocks, so while fluids generally soften rocks to promote creep, they don’t always do so). You will often see that the rocks in a region will have undergone both permanent folding and breakage, and may be bent and ready to snap back, with different modes of deformation more important in different places. Figuring this all out is fascinating, as well as useful (miners, well-drillers, and many others want to know what they'll hit in the rocks, whether the rocks are about to break, what kind of cracks the oil or gas or ores may be hiding in, and much more).
Melting and Freezing with Chemistry
If you take water and freeze it, you obtain ice that is made of the same stuff as the water. Melt the ice, and you have the water back. Melting and freezing without separating chemicals is easy to understand but is more an exception than the rule. If you take beer and start to freeze it slowly, the crystals that form will be almost pure water ice, although each crystal typically will start to grow on a small impurity particle in the beer. Filter the crystals out, and you will have cleaned the remaining beer a little, and you will have increased its alcohol content. Hire some advertising agents, and you have a “new” product to pitch: ice beer. (If you're underage, please substitute iced root beer. Freeze that, and you'll end up with a lot of ice and a little sugar water.)
In the world of rocks, things are even more complex than with (root) beer. Suppose you take a piece of granite (containing quartz, mica, potassium feldspar, and a sodium-rich sodium-calcium feldspar) and melt it by heating it hot enough to melt basalt. Suppose you then start to cool it. The first minerals to crystallize may be a little bit of olivine, and a calcium-rich sodium-calcium feldspar, minerals that were not in the original granite at all. Cool the melt a little more, and the olivine and remaining melt react to make pyroxene, while the feldspar and melt react to make more feldspar that is richer in sodium. Keep cooling, and eventually, you will grow crystals of the original sodium-rich feldspar and the mica, followed by the potassium feldspar and the quartz, regaining the original granite.
This ideal sequence may not be observed in many situations, but portions of it are well-known in laboratory experiments and in nature. In general, the first things to crystallize are poorer in silica, sodium, potassium, and aluminum, and richer in iron, magnesium, and calcium than the melt from which they grew. As the temperature drops, the early minerals react with the melt to make new minerals that are more like the original melt in composition. However, if the early minerals are removed from the melt, perhaps by settling to the bottom, they may be preserved, and exceptionally silica-rich rocks will be formed from the minerals that grow from the remaining melt. For more on the minerals, look at our "Sidebar" next.
Sidebar: Minerals and Rocks
If you throw a bunch of typical Earth chemicals into a pot, melt them, and cool them slowly, you will find that only certain things grow. You might, for example, find the mineral quartz (SiO2), the mineral pyroxene (FeSiO3), or the mineral olivine (Fe2SiO4). You will not find something midway between olivine and pyroxene; it doesn’t exist. Nature puts the chemicals together in certain ways, and only in certain ways. It is a little bit like building with Tinkertoys or Legos—there are only certain ways you can put the pieces together, which limits the things you can build.
Minerals are orderly—the same basic structure is repeated over and over and over (say, a silicon surrounded by four oxygens, each oxygen in contact with an iron that then contacts another oxygen that is one of four around another silicon, which is the structure of olivine). When minerals are allowed to grow freely, they assume certain shapes that look as if a gemstone cutter had shaped them. The faces on such crystals are controlled by the underlying order of the chemicals. The classification of minerals is based on their chemical composition. (Some chemical compositions can be put together in only a single mineral structure, but other chemical compositions can be put together in two or more different ways, each of which is a different mineral.)
Rocks are collections of minerals. You can find an all-olivine rock, or an all-pyroxene rock, a mostly-olivine/some-pyroxene rock, or any other possible combination. We, humans, have chosen to classify rocks based first on their origin, and then on other characteristics such as their grain size, their composition, or more details of their origin. The main subdivisions are igneous (rocks that formed from the cooling of melted rock, magma, or lava on the Earth's surface), sedimentary (rocks formed from pieces of pre-existing rocks, or from such pieces that dissolved in water and then crystallized from the water), and metamorphic (those formed from igneous, sedimentary, or older metamorphic rocks by the action of heat, pressure, stress, and chemically active fluids).
The classification of igneous rocks is next (we'll do igneous and then metamorphic and save the classification of sedimentary rocks for later in the semester). We distinguish coarse-grained rocks that cooled slowly from magma deep in the Earth, and fine-grained rocks that cooled rapidly from lava at the surface; the extreme case is obsidian, a glass that cooled too rapidly to allow crystals to grow. And, we distinguish rocks based on how much silica they contain. Low-silica rocks most commonly contain the minerals olivine, pyroxene, and calcium-aluminum-rich feldspars. High-silica types include quartz, potassium- and sodium-rich/aluminum-poor feldspars, and mica. Putting these together (grain size and composition) allows us to draw the following grid:
| Low Silica | Medium Silica | High Silica | |
|---|---|---|---|
| Small Grains | Basalt | Andesite | Rhyolite |
| Large Grains | Gabbro | Diorite | Granite |
Of these, basalt dominates the sea floors, andesite dominates island arcs, and granite to diorite are common in the hearts of mountain ranges. Many other types occur, but these are the most important ones.
Side Bar: Metamorphic Rock Classification
The most common sedimentary rock is shale or mud rock, and the most common metamorphic rocks are formed from sedimentary rocks. For our purposes, then, we will just list the metamorphic rocks that are formed from shale. With increasing heat (or time), the crystals get bigger, and some new minerals are formed. The general trend is shale (essentially mud rock), slate (harder, clinks rather than thuds when you rap it, but with grains too small to see), schist (lots of micas, grains visible to the naked eye), and gneiss (minerals have separated into dark and light layers). All of these are foliated—they appear layered. The foliations in shale come from the sedimentation of small clay flakes. Those in slate, schist, and gneiss come from the alignment of mica grains that grow in the rock, in a direction controlled by the squeeze in the mountain range. Contact metamorphic rocks—those that form by being "cooked" where magma is forced into colder, preexisting rocks to form granite bodies or other igneous intrusions—don’t have the squeeze of mountain ranges and so aren’t foliated. But contact metamorphic rocks are heated, and often made wet by water that comes from the magma or by surface water that is driven to convect through spaces in the rocks by the heat of the magma. The most common mineral in many contact-metamorphic rock is amphibole, a water-bearing silicate with four silicons to eleven oxygens. The most common rock of this sort contains a lot of amphiboles and is called amphibolite.
So Why Did North America Run Over the Spreading Ridge in the Pacific?
Good question. We’re not sure. But we do know that mid-ocean ridges are high because they are hot. Plates will slide off high spots, heading toward low places. So, North and South America are being pushed westward because they are sliding off the mid-Atlantic spreading ridge. If the spreading center in the Pacific simply sat still for a long while (which it probably did, more-or-less), then eventually the Americas would get to it, which they seem to be doing now.
A Rocking Review
A Rocking Review
Peaceful Easy Obduction
The Eagles rock music group sang about the peaceful, easy feeling they got while going into the desert, but they didn’t tell us whether they planned to do a lot of geology on the way. Whatever; in this parody, you can get a peaceful, easy feeling about a whole mountain range, the beautiful Appalachians. The proto-Atlantic Ocean did close before re-opening as the modern Atlantic Ocean, acting like a very slow accordion. While the proto-Atlantic was closing, three "collisions" happened, raising mountains near the modern east coast of the US, and erosion of the mountains produced sand that now is the sandstone of the ridges of central Pennsylvania and other places along the Appalachians. The first two collisions—small obduction events—involved North America hitting island arcs containing explosive volcanoes formed at former subduction zones. The third collision was the major obduction event as the proto-Atlantic disappeared, with Africa and Europe meeting the Americas as the great supercontinent of Pangaea was assembled.
Geologists long ago decided that the place where subduction occurs is a "subduction zone” but have been slow to adopt an "obduction zone" for the place where obduction occurs. We just couldn't make the rhyme scheme work in our parody with "the mountain range formed where an obduction event happened", so we call it an obduction zone. No one is quite sure whether the mountains in our "obduction zone" were as high as the Himalayas, or how many glaciers eroded the top of our obduction zone, but the mountains probably were quite high (more or less the height of the Andes today) and at least some of the early Appalachians may have been glaciated. The diagrams in this rock video have been simplified a bit, to make it easier for you.
So, relax, get out your Irish flute, and let's go obducting.
Video: Peaceful Easy Obduction (5:02)
[MUSIC PLAYING] RICHARD ALLEY: (SINGING) I like the way your folded mountains lay, waving smoothly across the land. I want to hike across your thrust faults today, with your ancient rocks on either hand. I get a peaceful, easy feeling, where so much history is shown, while I'm living and I'm loving in your old obduction zone.
Photo-Atlantic slowly closed long ago, Old World drawing near the New. Subduction zones fed many a volcano, island arcs eruptions blew. See their ashes in your roadcuts, while small collisions sent down sand. And the mighty obduction was drawing close at hand.
I found out a long time ago, continents cannot sink down. But in collisions, they will fold and break. So they make deep roots and a mountain crown. Your roots were heated, metamorphic, while glaciers carved the peaks you'd grown. The Himalaya became the Smokies of your old obduction zone.
hen as the rivers washed the heights away, rocks down deep bobbed up to light. So I can feel them on your ridges today, and hold them in your valleys tonight, because I get a peaceful, easy feeling, so many secrets ours alone, while I'm living and I'm loving in your old obduction zone.
[MUSIC PLAYING]
Module 4 Wrap-Up
Module 4 Wrap-Up
Review Module Requirements
You have reached the end of Module 4! Double-check the list of requirements on the Welcome to Module 4 page and the Course Calendar to be sure you have completed all the activities required for this module.
Comments or Questions?
If you have any questions, send an email via Canvas, to ALL the Teachers and TAs. To do this, add each teacher individually in the “To” line of your email. By adding all the teachers, the TAs will be included. Failure to email ALL the teachers may result in a delayed or missed response. For detailed directions on how to do this, see How to send an email in GEOSC 10 in the Important Information module.
Module 5: Tearing Down Mountains: Weathering, Mass Movement, and Landslides
Welcome to Module 5!
Welcome to Tearing Down Mountains: Weathering, Mass Movement, & Landslides!
Module 5 Introduction (2:17 minutes)
This is Spring Creek. We're in the Spring Creek Canyon just downstream from Penn State's University Park Campus. People have been coming here to Fisherman's Paradise for a century almost, to catch wild brown trout in this world famous trout stream. The creek once flowed way above our heads, way up there, and it has cut this canyon and left these glorious 200 foot high cliffs here.
Right next to me there is a big rock and that big rock used to be at the top of the cliff and it fell down. If you have a kitten and you put something on a table or a shelf, the kitten tends to knock it off. There aren't kittens up there knocking down the rocks but there are ice crystals growing in cracks that widen the cracks. And there are tree roots growing in the cracks, and there are little earthquakes shaking things. The weather attacks the rocks. It breaks them up, things get in the cracks, and they knock them down. Once it gets down here, the stream may break it up more. The stream eventually will pick it up and take it down to the Chesapeake - to the ocean. And then sometimes the rocks dissolve on the way and there are things we can't see in the water that get taken down to the ocean, and they get made into seashells down there. And the pieces, and the seashells, eventually may get scrunched in an abduction zone or taken down a subduction zone to feed volcanoes, to make new rocks that can be attacked by the weather again. And if you see a cycle here, it's because there is a cycle.
We will tell you later how we know the times. The fastest this cycle can run is about 10 million years. Right here, these rocks are about 500 million years old so it's been a pretty slow cycle here, but pieces of it can be fast, because if you're in the way when that rock falls down it could kill you in a second. So there's very interesting things we have to understand here and we're going to deal with them in this module.
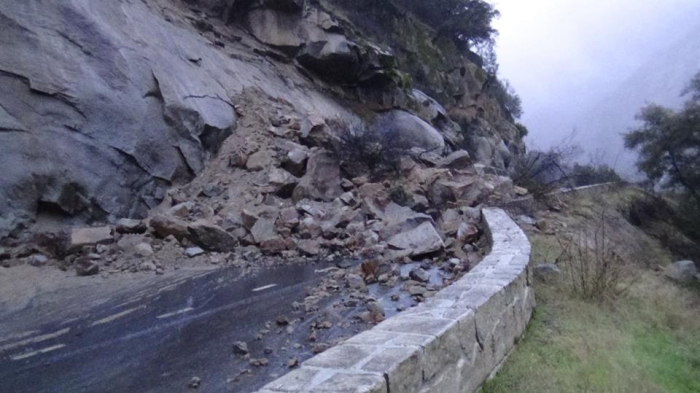
Fans of old-fogey rock music may recall that Paul Simon was "slip-sliding away." Paul was singing about human relations, not about debris flows. But, our hillsides really are “slip-sliding away,” too. Weather attacks rocks to make loose blocks, which may fall off cliffs rapidly or hang around to make soil before sliding downhill. So, crank up the tunes, watch out for rolling boulders, and let’s slip on into Module 5.
Learning Objectives
- Explain why the wind blows.
- Discuss why wind going up mountains produces rain and then becomes warmer going down the other side.
- Explain how weathering changes rocks physically and chemically at the Earth’s surface.
- Discuss mass movement and the downhill motion of loose rocks and soil.
- Explain how weathering and mass movement of old rocks are part of a cycle that leads to new rocks that experience weathering and mass movement.
What to do for Module 5?
You will have one week to complete Module 5. See the course calendar in Canvas for specific due dates.
- Take the RockOn #5 Quiz
- Take the StudentsSpeak #6 Survey
- Submit Exercise #2
- Begin working on Exercise #3
Questions?
If you have any questions, send an email via Canvas, to ALL the Teachers and TAs. To do this, add each teacher individually in the “To” line of your email. By adding all the teachers, the TAs will be included. Failure to email ALL the teachers may result in a delayed or missed response. For detailed directions on how to do this, see How to send an email in GEOSC 10 in the Important Information module.
This course is offered as part of the Repository of Open and Affordable Materials at Penn State. You are welcome to use and reuse materials that appear on this site (other than those copyrighted by others) subject to the licensing agreement linked to the bottom of this and every page. Students registered for this Penn State course gain access to assignments and instructor feedback and earn academic credit. Information about registering for this course is available from the Office of the University Registrar.
Main Topics: Module 5
Main Topics: Module 5
Overview of the main topics you will encounter in Module 5
First, a quote from President Teddy Roosevelt, who looked for ways to slow the soil erosion that was making it hard for farmers to feed us:
There are certain other forms of waste which could be entirely stopped—the waste of soil by washing, for instance, which is among the most dangerous of all wastes now in progress in the United States, is easily preventable, so that this present enormous loss of fertility is entirely unnecessary. The preservation or replacement of the forests is one of the most important means of preventing this loss.
—President Theodore Roosevelt, Seventh Annual Message to Congress, Dec. 3, 1907
In this Module, we start by visiting Redwood and Sequoia National Parks, and Death Valley, to learn a little about the weather. You may want a jacket to stay warm and dry in the foggy drizzle of Redwood National Park on the California Coast, yet, above the clouds, Redwood gets about the same amount of sunshine as toasty Death Valley just over the mountains where California meets Nevada. Much of Death Valley's heat can be traced to the energy that was stored when water evaporated from the ocean and then released to warm the air as clouds formed to rain on the redwoods.
After learning about the weather, we visit Badlands National Park. The Badlands are carved in old soils and other soft deposits, not hard rocks. Yet, most of the material in the Badlands started out as hard rocks. Weather, helped by living things, causes the “weathering” of hard rocks, breaking them apart and changing them chemically. Some chemicals from those rocks dissolve in water that flows toward the sea, while other materials stay in place and make soil.
To finish this Module, we visit the Grand Tetons and the Gros Ventre Slide. Naturally, soils and loose rocks move downhill about as rapidly as new ones are produced by weathering. We call this downhill motion “mass wasting” when it happens without the help of a river or glacier or wind. Most mass wasting is slow, but not all, and the Gros Ventre Slide provides dramatic evidence of the dangers of landslides that can be really fast. The Gros Ventre slide is now being washed away by a river and carried toward the sea, a topic for Module 6.
Humans have greatly accelerated mass wasting in many places. This is dangerous if a landslide threatens to bury you, but also if soil erosion reduces our ability to grow food. The quotation above from President Teddy Roosevelt, more than a century ago, highlighted the importance of saving soils.
Weather, Weathering, and Landslides
- The Sun hits the equator just about straight-on, but gives the poles a glancing blow, so the equator gets more of the Sun's energy.
- The Sun heats the Earth, which drives convection in the atmosphere.
- This convection in the air, when combined with Earth's rotation, makes interesting winds including breezes blowing from the Pacific onto the US West Coast.
- These winds rise up the Coast Ranges and the Sierra Nevada, cooling and making rain that waters the redwoods and sequoias.
- These winds then sink down into Death Valley, heating and drying it.
Why are the Redwood Wet, and Death Valley Dry?
- Warmer air can hold more moisture.
- Rising air expands, which cools the air; sinking air is compressed, which warms the air.
- Evaporation requires heat and condensation releases heat (you cool as your sweat evaporates, taking heat from you).
- If water vapor is not condensing to form clouds, the air cools about 5°F for each 1000-foot rise.
- If water vapor is condensing to form clouds (which then can produce snow or rain), the air cools about 3°F for each 1000-foot rise.
- Air from the Pacific is "wet", carrying about as much vapor as it can.
- This air blows up the Coast Ranges and the Sierra, cooling, which reduces its ability to carry water, forming clouds that rain on the trees.
- Dry air comes down the other side of the mountains into Death Valley.
- The air cools 3°F for each 1000-foot rise going up, warms 5°F for each 1000-foot fall coming down, and must go up about 15,000 feet to get over mountains, so the air comes down about 30°F warmer than when it went up.
- This is the main reason Death Valley is hotter than Redwood; the lack of clouds over Death Valley also allows more warming from the Sun.
- The energy that warms the air at 30°F going from Redwood to Death Valley was stored in the air when water vapor evaporated from the ocean, and released to warm the air when condensation made the rain for Redwood.
Rocks Are Not Forever
- "Weathering" includes the physical changes that make small rock pieces from big ones, and the chemical changes that make new minerals.
- Physical weathering is caused by crystal growth in cracks (especially ice) and other processes.
- Granite is a common rock composed of quartz (silicon+oxygen, sometimes called silica), feldspar (which is silica+aluminum+(calcium or sodium or potassium)), and a dark mineral (which is silica+iron+magnesium).
- Chemical weathering leaves the quartz as quartz sand, changes the feldspar to clay (silica+aluminum+potassium) while the calcium or sodium wash away, and rusts the iron of the dark mineral while the magnesium and silica wash away.
- The "chunks"—rust+sand+clay—plus worm poop and similar materials make soil.
- The calcium and silica go to make shells in the ocean.
- The magnesium reacts with hot sea-floor rocks to make new minerals there.
- The sodium makes the ocean salty.
- The soil eventually is washed into the ocean.
- Subduction takes sea water, sediment, shells, soils, and the sea floor with its new minerals down to melt; the melt rises and solidifies as granite (or andesite, if it erupts), in a nearly balanced cycle.
Mass Movement
- Mass movement is the downhill transport of soil and rock that occurs in many places without major help from rivers or glaciers or wind.
- Mass movement ranges from huge, destructive landslides to barely measurable soil creep.
- Rivers usually pick up and carry away the material delivered by mass movement.
- In most places and times, there is a natural balance between soil production by weathering and soil removal by mass movement or other processes.
- Humans are upsetting this balance in many places, typically making soil removal much faster than soil formation, so that soil is getting thinner.
- We often can figure out where mass movement is potentially destructive, and stabilize slopes or stay out of the way.
Weather and Climate: the Redwoods, Sequoia, and Death Valley
Weather and Climate: the Redwoods, Sequoia, and Death Valley
Take a tour of the Redwoods
Weather and Climate in the Redwoods
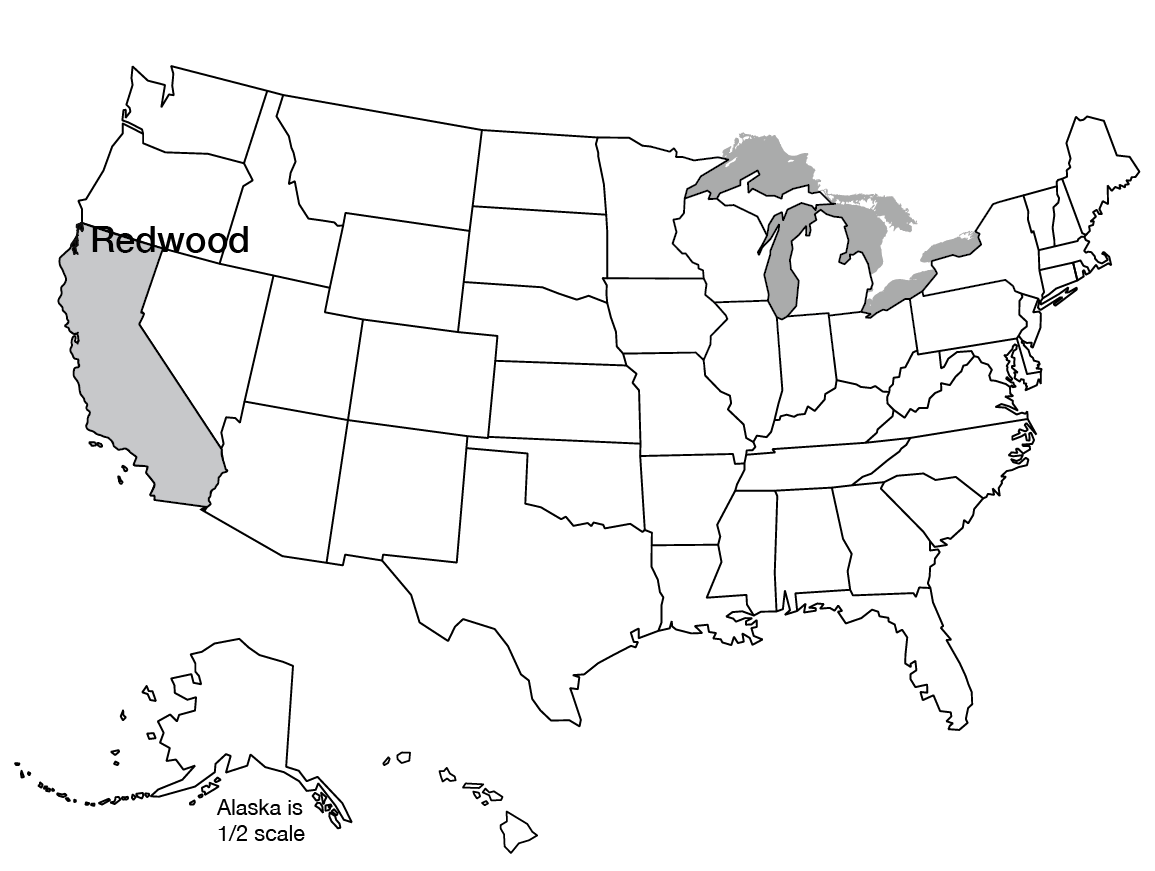
licensed under CC BY-NC-SA 4.0
First, as usual, here is some background material on national parks you might want to visit. This background also raises some questions that we find fascinating, about why there are such huge differences in climate between nearby national parks. After we raise these questions, we start to answer them with Why the Wind Blows, below.
Redwood National Park has the feel of a soaring, gothic cathedral—only more so. One of the great Sequoia sempervirens trees may live for over two thousand years, but when it falls, new trees will grow from the fallen trunk. (This growth of new trees from a fallen giant gave us the scientific name, which means “ever-living sequoia” in Latin.) The redwoods are the tallest trees on Earth, commonly more than 200 feet (60 meters) and with the very tallest soaring above 380 feet (more than 115 meters). If such a tree grew on the goal line of a US football field and then fell over, it would knock down the goalposts on the other end, and the top branches would extend into the stands. Ferns growing beneath the redwoods may be shoulder-high on a person, yet appear lost and inconsequential. Reports from early loggers included trees even taller than any known today.
The redwoods lie in the southern part of the great, coastal, temperate rainforest that extends north from near San Francisco along the Pacific coast to southeastern Alaska and includes Olympic National Park, which we visited earlier. The redwoods grow in soils that came from rocks much like those of the Olympic.
Redwoods are mostly restricted to a narrow band along the coast with 50-100 inches (1.25-2.5 meters) of rain per year, and with frequent to continuous fogs that help the trees avoid drying out. The trees, in turn, help maintain the fog. Cutting the trees may decrease the fog, making it difficult or impossible for the redwoods to re-grow.
The wood of redwood trees is highly resistant to fire and rot, and so is greatly sought after. Logging of old-growth redwoods thus is a contentious issue. An estimated 96% of the old-growth forest has been cut already. Those trees typically were 500-700 years old, with some about 2000 years old, so a new "old-growth" forest cannot return soon. Some people still want to cut the remaining 4% or so of the original old-growth redwood forest.
Fossil evidence shows that redwoods once were much more widespread. U.S. parks that preserve fossilized redwood logs include the Petrified Forest, Yellowstone, and the Florissant Fossil Beds.
A bit farther south and higher on the slopes of the Sierra, but still in a zone that gets plenty of rain and snow, are the great sequoias of Yosemite, Kings Canyon, and Sequoia National Parks. The Sequoiadendron gigantea are close relatives of the redwoods. Although not as tall (“only” up to 311 feet, or about 95 meters), the great sequoias are more massive. The General Sherman tree, at 275 feet tall and 102.6 feet around, is generally considered to be the largest single-trunk tree on Earth (and much larger than the largest whales). Sequoias can live for 3500 years.
The great sequoias are extremely fire-resistant and require fire to clear out competing trees and trigger the sprouting of sequoia seeds. Fire suppression instituted after the parks were established led to a period with few or no new sequoias sprouting. Dead wood, leaves, sticks, and other debris that can burn accumulated during this time of fire suppression and can make wildfires (which are being made worse by human-caused climate change) hot enough to endanger the sequoias. Carefully planned burns started by experts, and procedures that allow some natural fires to burn, are being used to help return the forest to a more natural state.
Why the Wind Blows
Why the Wind Blows
Ultimately, the wind blows for the same reasons that the mantle convects and that boiling water in a pot full of spaghetti rises over the heating element of a stove. The air, the spaghetti water, and the mantle are capable of flowing, and all are heated from below and cooled from above. The amount of heating and the rate of flow are VERY different in these different cases, which helps make the world interesting. But you might see a thunderstorm and imagine a hot-spot formation in the Earth, or a pasta dinner, and there is at least a little similarity between a cold front, a subduction zone, and spaghetti noodles sinking along the wall of the pot.
Some of the sunshine that reaches the top of Earth’s atmosphere is reflected from clouds or snow or other things without heating us, but most comes through the air and heats the surface of the Earth, which then heats the air above. The equator receives more sunshine than the poles because of simple geometry. Imagine for a moment that Dr. Alley’s head is the Earth, with his nose on the equator and the North Pole in his bald spot on top. (See the picture.) If he stands in front of a sun-lamp “sun,” he’ll never get a sunburn on his North-Pole bald spot, but he will on his equatorial nose.
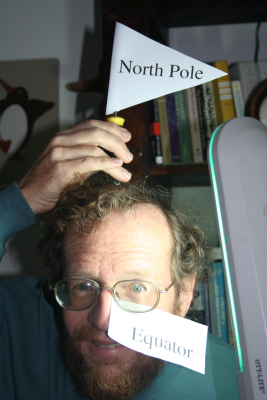
The Earth works the same way—at the top of the atmosphere, the amount of sunlight passing through a square meter is the same at the equator as at the pole (see the diagram below). But because of the Earth’s curvature, the light passing through a top-of-the-atmosphere square meter at the equator illuminates a square meter at the surface, whereas the light passing through a top-of-the-atmosphere square meter near the poles is spread over many square meters on the surface, so a square meter on the Earth’s surface gets more sunshine near the equator than near the poles. (Additionally, in both cases, the rotation of the Earth causes the sunlight to be spread around the whole planet.)
The additional energy received at the equator compared to the poles means that the surface at the equator becomes hotter than at the poles. If we had no atmosphere or oceans, the equator would become too hot for life as we know it, and the poles too cold. However, the extra sunlight that the equator receives heats air and water there, driving winds and ocean currents that carry some of the excess heat toward the poles, making the whole world habitable to humans.
Video: The Drivers of Earth's Weather (1:34)
We're going to look here at the main driver of Earth's weather. The sun is this big orange thing over here. It is sending energy towards us - beaming along like this. You have a spaceship. Your spaceship has solar cells on it. It doesn't matter whether your spaceship is sitting over the equator or over the pole. You get about the same amount of energy in either case. But when you come down to the surface, if you add your solar cell facing straight up to space at the equator, you'd get almost as much energy, unless it was cloudy, but when you put the same size solar cell facing up to space up here, it doesn't get as much energy. There's more coming through here that's being spread over a larger area and because of that, the heating is greater at the equator than it is at the pole. The greater heating causes the air to rise here. It heads towards the poles, like this. It blows over the ocean and that can make currents. The air, the winds, and the currents are moving the extra heat from the equator to the pole. Eventually, it's all radiated back out to space so we're close to balance, the Earth rotates so there's a little complexity there but the big picture -- because the equator faces the sun and the pole doesn't there is more heating at the equator.
Following is a static image that was described in the video above.

In slightly more detail, as the sun heats the land at the equator, the land heats the air above, and the air expands, rises, and then moves poleward in convection currents. The hot air loses some of this energy to warm the land and water it passes along the way, but eventually, all the energy is radiated back to space. The sunlight that comes in is called shortwave radiation because its waves are short. (This stuff really isn’t that complex a lot of the time!). The radiation going out has longer waves and is called longwave radiation. Your eyes can see the shortwave light, but you would need infrared goggles to see the longwave. Later, we will discuss how the different way that shortwave and longwave radiation interact with certain gases in the air is important in understanding the greenhouse effect. For now, note that the global energy budget is very close to being balanced—the total amount of energy brought in by shortwave radiation and absorbed in the Earth system is very nearly equal to the total amount of energy taken out by longwave to space. (This is not perfectly balanced now, because we humans are changing the composition of the atmosphere by adding greenhouse gases, so the Earth is warming because we are sending out a little bit less energy than we receive. But, once we quit changing the composition of the atmosphere, the Earth will get back to balance.) A factory balances the total amount of stuff coming in and going out, but little auto parts come in and big cars go out; the earth balances the total energy coming in and going out, but shortwave comes in and longwave goes out. And, the uneven heating because of the Earth’s nearly spherical shape drives the wind, and the wind plus uneven heating of the oceans drives ocean currents.
Because the Earth rotates, the winds end up turning rather than going straight from the equator to the pole, and this makes the weather much more interesting than it would be on a non-rotating planet. If you want to explore this a little more, see the optional Enrichment about the Coriolis effect.
Heating Death Valley
Heating Death Valley
Take a tour of Death Valley
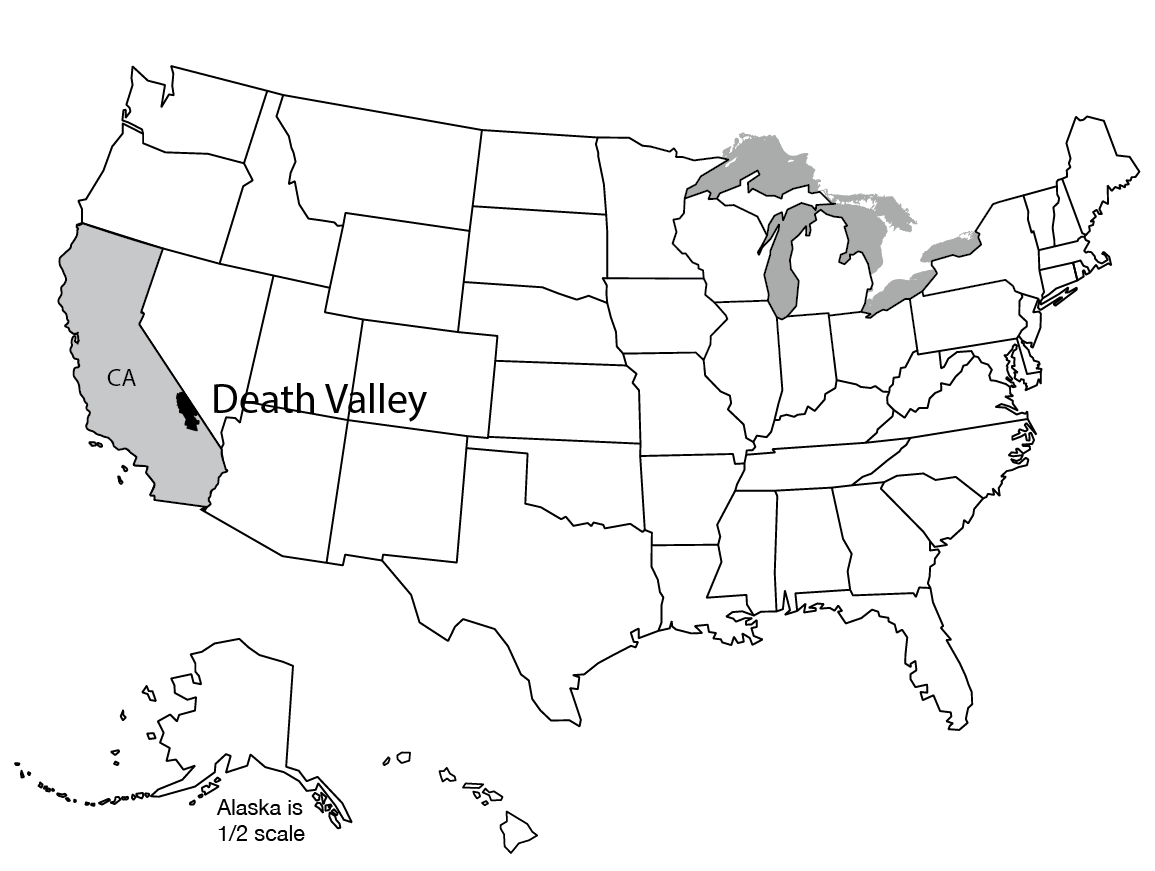
is licensed under CC BY-NC-SA 4.0
Some people are surprised to learn that the rain on the redwoods is partly responsible for the heat of Death Valley, as we explore next in the text and in the video just below.
Warm air can hold more water than cool air. All air in nature has at least some water vapor in it, so if you cool air enough, water will begin to condense out of the air to make clouds that can rain or snow.
In nature, the air cools in two major ways—by losing energy to warm up its surroundings (by radiation or conduction), or by expanding as it is lifted. If warm tropical air flows toward one of the poles over colder land or water, the air cools while the land or water warms, and fog or clouds may form in the air. And, air that is lifted upward expands, and this expansion cools the air. You can experience this by feeling air becoming cold if it escapes rapidly from a high-pressure bicycle tire. Air that moves downward is compressed and warms, something you can feel if you keep your hand on the bicycle pump while you fill the tire again. In nature, air may be lifted when one air mass moves over another along a weather front, or when air moves up a mountain range. In either case, higher elevations have lower temperatures. (If it bothers you that cooler temperatures exist higher, but that cold air sinks, see the optional Enrichment—as explained there, cold air will sink if, after it warms while sinking, it is still colder than the air it replaces.)
Evaporation of water ultimately cools the surroundings of the water, and condensation warms the surroundings. To see this, remember that almost everything we see—including water—is made of fast-moving particles called atoms, or groups of atoms called molecules. If you have some water, such as the ocean or a drop of sweat on your skin, the average speed of the molecules will be higher if the water is warmer, but there always will be a range of speeds with some of the water molecules moving faster than others. The faster-moving, hotter molecules evaporate by breaking the attraction to their neighbors, leaving the slower, cooler ones behind, so evaporation always cools the remaining water. More heat then is conducted or radiated into this remaining water from its surroundings because heat flows from warmer to cooler places—your skin feels cool as it loses heat to the drop of sweat as it evaporates, and the ocean surface cools as water evaporates into the air.
Condensation reverses evaporation. Water condensing on a glass of iced tea warms the tea and the surrounding air. Condensation of water to form drops in clouds warms them, and they warm the surrounding air, releasing the energy that was stored when the water evaporated. (This energy that is stored during evaporation and released during condensation is called latent heat.)
Now, consider the wind blowing into California from the Pacific Ocean and rising up the Coast Ranges above the redwoods, and even farther up the Sierra Nevada above the giant sequoias, as shown in the video below As the air rises, the pressure on it (the weight of the air above) becomes smaller, and the air expands and cools. Once the air has cooled enough, it becomes saturated with water, and further cooling causes condensation. But the condensation releases some heat that partially counteracts the cooling from expansion. Air in which condensation is not occurring cools by about 1ºC for every 100 meters it is lifted, but when clouds and rain are forming the cooling is only about 0.6ºC for every 100 meters it is lifted (5ºF per 1000 feet dry, and 3ºF per 1000 feet wet). The difference represents the heat released by the condensation. This heat originally came from the sun, was stored in the air when the sun’s energy evaporated water, and was released to warm the air when the water condensed.
The strong breezes from the Pacific usually are full of water vapor, and begin to form clouds and fog as soon as they start to rise. This gives the common fogs of San Francisco and the Redwood Coast.
As you can see in the video below, those winds blowing over the Redwoods and the Sierra to Death Valley must rise about 15,000 feet to get over the Sierra, and cooling by 3ºF for every 1000 feet upward means the air cools about 45ºF going up. (Air that makes you feel comfortable at 70ºF at the coast will be 25ºF at the top, so take a warm jacket even in summer if you’re planning to climb in the high Sierra!) When this wind continues down the other side, it has lost almost all its water vapor and warms about 75ºF on the way back to sea level at the dry rate of 5ºF per 1000 feet. Thus, a comfortable 70ºF breeze on the Pacific Coast will be 100ºF when it nears the bottom of Death Valley. (Or, the air comes in from the Pacific at 21ºC, cools by 25ºC while rising 4200 m and cooling at 0.6ºC per hundred meters to -4ºC on top, then warms by 42ºC at 1ºC per hundred meters, reaching 38ºC at sea level on the edge of Death Valley.) Add a little solar heating through the cloudless desert air, and it is no wonder that Death Valley is hot! (And yes, the wind usually goes around the Sierra rather than over, so you haven’t learned everything about meteorology in part of one Module in a geology class, but it’s a start.)
Watch the following video that describes this process in more detail.
Video: Heating and Cooling of the Redwoods (2:23)
So out here there's the great Pacific Ocean. And the wind comes trucking in from the Pacific Ocean. And it's just going great guns except at some point it runs into the giant mountain range of the Sierra, which we know goes up over the top and down the other side and down to Death Valley.
And so when the air runs into that, the air has to rise. And you may know that when air has to rise, it expands. And when you have air expanding, whether it be out here on the Pacific or from a bicycle tire, it cools. And when the air cools that makes nice clouds. And when that makes clouds that make the rain that comes dripping down. And so sitting underneath that, as you might imagine, you have really wonderful trees called the Redwoods because it rains like crazy on them. And they're really happy with that.
Now the air is cooling and the cooling rate is something vaguely about three degrees Fahrenheit for every 1,000 feet that the air goes up. It should be five, five is the thermodynamics. But when the cooling causes condensation that makes the rain that we see, condensing actually gives up a little heat. And so you only get a cooling of about three degrees Fahrenheit per 1,000 feet going up.
Now when the air comes over the top and starts coming down the other side, there's no water in it to evaporate. There's no water there, it's dry. And when air is coming down like that and being squeezed, it ends up warming. And that warming is about five degrees Fahrenheit per 1,000 feet that it comes down.
And so it cools going up at about three degrees Fahrenheit per 1,000 feet. It warms coming down five degrees Fahrenheit per 1,000 feet. And that in turn means that because the mountains are really high, if the air comes trucking in at something like 70 degrees Fahrenheit, by the time it goes over 15,000 feet high, it's almost 15,000 feet to the top of the Sierra, and the air has to get over, why when it comes back down here to Death Valley, it is 100 degrees Fahrenheit. And you really would be wiser to go visit in the winter rather than in the summer.
The Badlands
The Badlands
Take a tour of Badlands National Park
is licensed under CC BY-NC-SA 4.0
The Badlands of South Dakota are much more than just the land to the south of Wall Drug Store. (If “Wall Drug Store” doesn’t make sense, your favorite search engine can give you a lot of information about South Dakota's strange but popular commercial tourist trap. Among other things, they have a great collection of western art, and a jackalope you can take pictures on, as shown in the VTRIP). Today, the Badlands may be most valuable for ecological reasons, because they preserve a wonderful piece of the shortgrass prairie that once covered much of the western Great Plains. The sea of grass and flowers that nourished the bison and the Native Americans of the plains has been almost entirely plowed under in most of the US West. But, in the upper prairie of the Badlands, the grass still waves in the breeze like an ocean, the pronghorn antelopes still bound through the grass, and you can, perhaps, imagine what the prairie once was.

As you can see in the VTrip (and image) above, the Badlands are carved into “rocks” that occur in nearly horizontal layers. But these don’t make giant cliffs such as the 3000-foot-high granite walls we will visit at Yosemite soon. Instead, the Badlands break down easily, so hikers on the trails must be careful to avoid slipping and sliding on loose material that becomes really, really slippery in occasional rains. (Hikers in Yosemite need to be careful, too!) The material at the Badlands was washed into where we now see it by small streams or blew in on the wind, and includes some loose ash from far-away volcanic eruptions that fell on the surface. Many of the layers at the Badlands are old soils that formed where we see them today and then were buried by newer deposits. Amazing fossils have been buried in these sediments, including bones of ancient alligators, saber-toothed cats, camels, rhinos, and more. (The National Park is essential in preserving these so that everyone can enjoy them!)
Earlier, we learned about obduction and subduction, and about volcanic eruptions and intrusions, processes that make hard rocks of the sort that you can see in the cliffs at Yosemite. Clearly, many things must have happened to turn such hard rocks into the loose pieces that washed into the Badlands, and then to turn those loose pieces into soils. And, just as understanding the mountain-building processes can help keep us safe, understanding the mountain-breaking processes is important for our well-being. We look at some of these mountain-breaking processes next, starting with changes called “Weathering”, because many of them are linked to the weather.
Weathering Processes
Weathering Processes
We met metamorphism back in Module 4. If you take some Earth material (mud, for example) from one environment where it is “happy” (near the surface of the Earth), and move it into a very different environment, the mud changes. Moving the mud deep into the Earth, where temperature and pressure are high, causes new minerals to grow, and the soft mud with its tiny clay particles can become a hard metamorphic rock with big, beautiful crystals of fascinating minerals.
The materials in the mud are stable (or at least nearly so) under conditions found at the surface but not stable under conditions found deep in the Earth. And, perhaps not surprisingly, minerals produced deep in the Earth usually are not stable under surface conditions. Compared to deep in the Earth, the surface is wetter, has more oxygen, has a wider range of acid/alkaline conditions (with acid especially common at the surface), and has many more living things trying to break down the minerals to extract chemicals that are useful to them (“fertilizer”).
As a general rule, the more you change the conditions around a mineral, the faster the mineral changes into something new. (This “rule” has many exceptions, but it is often useful.) At or near the Earth’s surface, the changes that occur to a mineral at a place are called weathering. Moving the products of weathering is called transport. And weathering plus transport are lumped together as erosion.
Weathering, in turn, is divided into mechanical weathering and chemical weathering. Mechanical weathering refers to nature breaking big pieces to make little pieces; chemical weathering refers to nature making new types of materials that were not there previously.
Mechanical Weathering
Mechanical Weathering
Turning big pieces into little ones requires cracking the big ones. Cracks in rocks are caused or enlarged by processes including:
- Mountain-building stresses or earthquakes;
- Expansion as erosion removes the weight of overlying rock;
- Expansion and contraction during heating and cooling (especially very near the surface during forest fires; a really hot fire followed by a rainstorm can change temperature a lot in a hurry);
- Growth of things in cracks (tree roots, various minerals, and especially ice).
Slideshow: Examples of mechanical weathering
Probably the most important mineral that grows in cracks is ice, but others do too. For example, the mineral thenardite, Na2SO4 (no, you don’t have to memorize the mineral or the formula!) can add a lot of water to its structure (10 molecules of water for each Na2SO4, to make mirabilite, Na2SO4·10H2O, and you still don’t need to memorize the mineral or the formula), expanding in the process. Some pieces of the “dry” mineral, thenardite, may fall into a crack in a dust storm during the dry season, and then change to the much bigger mirabilite during the rainy season as the air gets humid, wedging open the crack. Too much rain may dissolve the mirabilite and move it deeper into the crack where it can lose water during the next dry season and then get wet and expand again, and again… This process is breaking many of the ancient monuments of Egypt as increased irrigation and other activities give seasonal increases in humidity in some places. (The story is even a little more complex than this, but, as shown below, the growth of minerals in cracks really does break rocks!)
Video: Rock Weathering (1:44)
Rock weathering really does happen. Things break rocks. Here is an example of tree roots breaking a human-made rock, or pavement, and we have to worry about a lot of human-made things being broken. The National Park Service preserves so many historical things that they actually have a National Center for Preservation Technology and Training to learn how to preserve our past for the future, as shown here. These pictures are just a little bit old, but they show an attempt by this National Center and Princeton University to learn how to save rocks from certain kinds of weathering. And they were worried about sodium sulfate salts that get into cracks and then can pick up water and expand, and in doing so they can break the rocks. And this would be thenardite changing to mirabilite. You don't need to know the detail, but it really does happen. And these pictures are slightly old, but what you can see here is they had developed a treatment that was used on some of these that protected them. And others, that were put in the salt and did not have the treatment, were very clearly not protected. So there are things that we humans can do to help save the things we made, but there is no question whatsoever, that nature does know how to break rocks.
Want to see more?
Enrichment: Another vintage movie for you to enjoy--and it won't be on a quiz. Here, National Park Service Ranger Jan Stock and the CAUSE students explore the freeze-thaw cycle in Bryce Canyon National Park.
Video: The Freeze-Thaw Cycle: Bryce Canyon National Park (1:17)
This white feature here is called the Wall of Windows. It's actually limestone. And it started out with a little tiny hole, like the hole on the left, and then it's eroding and eroding and eroding.
You've got the bridge on top. And then the bridge on top will fall away. And then you'll have the two hoodoos left standing. The difference between a natural bridge and an arch? Natural bridges are formed by streams and rivers running through underneath, cutting away.
Whereas this one is?
Whereas this is actually frost wedging.
OK.
Where it freezes and thaws and freezes and thaws and freezes and thaws and then it breaks away in the different layers.
Chemical Weathering
Chemical Weathering
Chemical processes break down rocks, and some of the material dissolves in water and washes away as part of a great, slow cycle. Here’s a short introduction from Dr. Alley at the Bear Meadows National Natural Landmark, not far from Penn State’s University Park campus. Bear Meadows is one of the few natural wetlands in central Pennsylvania, and has a lot of blueberries and bears as well as interesting geology.
Video: Weathering at Bear Meadows (:49 sec)
I'm here at Bear Meadows in central PA, one of the few natural wetlands in the area, and Sinking Creek comes out of here. It's a nice trout stream, and you can probably see that the water is just a little bit brownish from tannic acids that are picked up in the wetland, and those acids help the water break down the rocks. Even without them, CO2 in the water makes a weak acid which breaks down the rock. And so what you can't see in here are pieces of rocks that are the raw materials for shells that eventually will go down subduction zones. And sometime 100 million years or more in the future might make a new mountain to be hosting a wonderful place like Bear Meadows.
Chemical changes are often more interesting and more complex than physical ones. There is a great range of possible changes, and you must know a lot of chemistry to really appreciate all of them. In general, weak acids are the most important. (Strong acids would be most important, except nature doesn’t make large quantities of them!) Rainwater picks up carbon dioxide from the air and becomes a weak acid called carbonic acid. In soils, water may pick up more carbon dioxide plus organic acids from decaying organic material, becoming a slightly stronger but still-weak acid.
When acid attacks a rock, the results depend on what minerals are present, how warm, wet, and acidic the conditions are, and a few other things you don’t need to worry about. We can sketch some general patterns. Suppose we start with granite, a silica-rich rock that forms in many continental and island-arc settings. Granite is fairly common and contains a lot of the commonest elements in the Earth’s crust, so learning about granite gives you insights into weathering of other things. Don’t obsess about learning the details of the minerals we discuss; start by looking for the big picture.
In the image below, you see Penn State graduate Matt Spencer in front of white granite that was intruded into dark metamorphic rock, along Trail Ridge Road in Rocky Mountain National Park. The granite has weathered faster than the metamorphic rock in this environment, so the granite remains only where it is protected by the overhanging metamorphic rock. (These vaguely mushroom-shaped features are called "hoodoos", by the way.)
Video: White Granite Intruded into Metamorphic Rock (5min, 6 sec)
So we are on Trail Ridge Road in Rocky Mountain National Park and you're looking at Matt Spencer, who's a Penn State grad and became a great professor of geology, standing next to some really interesting outcrops. And on top is this dark metamorphic rock and below it is a granite that was intruded into a crack in the metamorphics and then froze there. So a fascinating-looking place, just to go visit if you're ever up on Trail Ridge Road, I strongly recommend it.
Here is the metamorphic rock viewed a little closer and if you know often that metamorphic rocks are sort of folded and you can follow the folds in the layers of the rock here if you look carefully. And so that is on there and then if we go and look just next to the metamorphic rock you can see the contact where the metamorphic rock meets the granite. The metamorphic rock was probably hot when the granite was squeezed in, but the granite was hotter, and so the granite froze faster, cooled faster, and got smaller crystals right next to the metamorphic rock. And so you can see the chilled margin of that granite when it got squirted in there. All right, so then we can go back and see Matt standing next to this. In this environment, the granite weathers a little faster so it sort of saved where it's being protected by the metamorphic on top. Let's now zoom in and look at granite. This is actually a different granite from down the hill but a lot of granites look very similar. That is my index finger at the bottom sticking in there and we'll zoom in some more and you'll notice that the granite is made of grains. Some of those grains are little gray ones with the arrows pointed at them. They are a mineral called quartz. The chemical formula of quartz is SiO2, sometimes it's called silica. The Si stands for silicon, the O is oxygen. When the granite weathers, the quartz basically just stays as quartz and makes quartz sand. The arrows are now pointing at feldspars. There's actually two different feldspars in here but they're very similar. Feldspars include these silica, the SiO2. They all have aluminum and some of them have calcium, Ca, or sodium, Na, or potassium K. You do not need to memorize this. The formulas of the feldspars are KAlSi3O8 and then sort of a range between the calcium one and the sodium one shown there on the bottom. When the feldspars weather, they make clay, and the clay tends to keep the potassium, K, and then a lot of the aluminum the Si and the O plus a little water and that calcium, Ca, and the sodium, Na, dissolve and wash away to the sea. There's a dark mineral. In this one it is biotite. In some it's a different mineral so we won't worry too much about that mineral. You don't have to memorize biotite. The dark mineral always has some silica and it almost always has some magnesium, Mg, and some iron, Fe, and maybe some other things. We have now named eight elements, oxygen, silicon, aluminum, iron, calcium, sodium, potassium, and magnesium, and that order is the eight commonest elements in the crust of the earth. That's more than 99 percent of the crust of the Earth. When the granite weathers and the dark mineral breaks down it releases magnesium that washes to the sea and iron that rusts and stays in the soil. So granite breaks down to give sand, clay, and rust that stay as soil, usually with added worm poop or other formerly living things. And granite gives dissolved materials that wash to the sea where the calcium goes into shells, the sodium makes the sea salty, the Magnesium may go into shells or react with rocks. Eventually, the soil, the sand, and clay and rust washed to the sea and they go down subduction zones with the salty water and the shells and the rocks to melt under volcanoes and make new granite, but that takes a long time. At least a lot of millions of years and maybe hundreds of millions of years or longer.
As shown in the close-up picture of a granite boulder below, granite usually is composed of four minerals: quartz (which is almost pure silica, with silica in turn composed of the elements silicon and oxygen), potassium feldspar and sodium-calcium feldspar (mostly silica, with a little aluminum replacing some of the silicon, and potassium, sodium or calcium added for balance), and a dark silica-bearing mineral containing iron and magnesium (often a dark mica called biotite). The eight elements named in this paragraph make up almost 99% of the atoms in the rocks of the crust of the Earth. (Helping living things survive and running our economy requires many other elements that are quite rare in rocks, one reason that geologists are hired to find valuable, rare things and help mine them.)
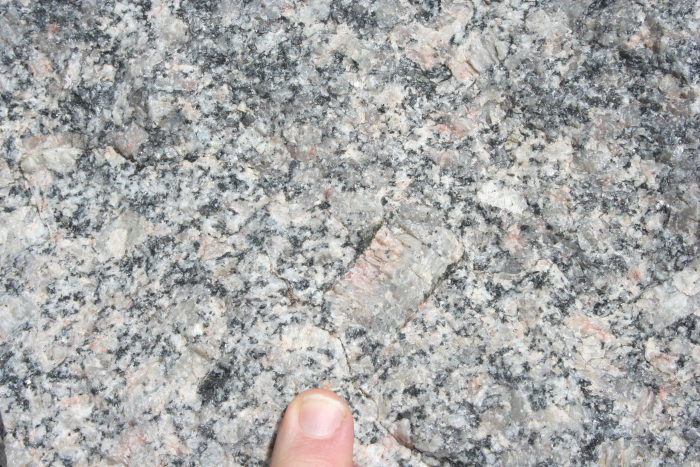
When granite interacts with carbonic acid, several things happen. Typically, for most of the minerals in most environments:
- Iron (Fe) rusts. It picks up water and oxygen and remains in the soil as little pieces of rust.
- The aluminum (Al), potassium (K), and silica (SiO2) from the feldspars and from the dark mineral rearrange into new minerals, called clays, that also include some water.
- The calcium (Ca), sodium (Na), and magnesium (Mg) dissolve in water and wash away.
- Most of the quartz (silica as a mineral) sits there almost unchanged as quartz sand (a little of it may dissolve and wash away, but most stays).
One can write a sort of equation:
Granite → rust + clay + (dissolved-and-washed-away Ca + Na + Mg) + quartz sand
The rust, sand, and clay left behind, plus a little organic material often including worm poop, become the indispensable layer we know as soil. (And, if you have ever tried to drive a car on soft soil during a rainstorm and had your tires sink in and get stuck, you may call the soil “mud”, possibly with some bad words added.)
The calcium and silica that dissolve and wash into the ocean are used by sea creatures to make shells, the dissolved magnesium washed into the ocean often ends up reacting with hot rocks at spreading ridges to make new minerals in the seafloor or goes into some of the shells, and the dissolved sodium accumulates in the ocean to make it salty. (Eventually, the ocean loses some salt, often by the salty water getting trapped in spaces in sea-floor sediments and going down subduction zones to feed volcanoes; evaporation of water in restricted basins also may cause deposition of some salt.)
You should recognize that this is a very general description of what happens; were it this easy, there would not be hundreds of soil scientists working to understand this important layer in which most of our food grows. In general, the hotter and wetter the climate, the more stuff is removed—rust and quartz sand can be dissolved in some tropical soils, leaving aluminum compounds that we mine for use in making aluminum. In dryland soils, calcium and magnesium may be left behind forming special desert soils, or sodium may be left behind forming salty soils in which little or nothing will grow.
You also should recognize that the “chunks” in soil – rust, clay, sand, and organic materials – can be carried away by streams or wind, or glaciers, but as chunks rather than invisible dissolved materials. We discuss this loss of chunks in the next sections. If chunks are carried away more rapidly than new ones are formed, the soil will thin, and we will find it difficult to grow food to feed ourselves (this is what Teddy Roosevelt worried about in the quote at the start of this Module). The chunks eventually are carried to the oceans and deposited as sediment on the seafloor, together with a lot of shells.
Recycling
Granite may form beneath a volcano in a subduction zone. We have just seen that the granite then will begin to break down, making dissolved things and chunks. Eventually, the chunks are carried to the sea, by rivers and glaciers and wind (we will study this transport soon), while the dissolved things also go to the sea where they are turned into shells or other things. Sediment consisting of these chunks and shells, with some of the salty water in the spaces, is then taken down subduction zones to feed volcanoes that make granite. Some of the shells even contain a little carbon, and some dead things containing carbon are buried in the sediments, and some of this carbon is taken down subduction zones and supplies carbon dioxide to the volcanoes with water, helping make carbonic acid that weathers the granite.
If this looks like a cycle, it is! The Earth really does cycle, and recycle, everything! But, going around this loop once takes at least millions of years, and may take a lot longer than that, issues we'll discuss later.
Grand Tetons and the Gros Ventre Slide
Grand Tetons and the Gros Ventre Slide
The Grand Tetons tower above the valley known as Jackson Hole, Wyoming, providing the epitome of western scenery for many people. A still-active pull-apart fault lies along the front of the range and slopes steeply downward beneath Jackson Hole. From the highest peaks to the fields of the Hole, where elk and moose and bear are common, is well over a mile vertically (roughly 2 km), but the total vertical offset on the fault is almost 6 miles (10 km) (we don’t see this total offset because a lot of rocks have been eroded from the top of the range and deposited in the valley). The uplifted block is primarily old metamorphic rocks that erode only slowly. The faulting is probably related to the Basin and Range extension that also gave us Death Valley, although the complexity of the region makes any interpretation difficult. Dr. Alley recalls huddling next to an overhanging rock, far up on the steep front of the Tetons, watching hailstones rattle off the trail from a black deck of clouds barely over his head. It is a truly awesome place.
Video: The Gros Ventre Slide (3min, 10sec)
This is the Gros Ventre slide. It's just a little bit east of the Grand Tetons National Park and we're looking at something that happened, you know, a good long time ago. There was a time that sort of everything in this picture was covered with pretty trees but then, sort of kind of, everything in there slid off the side of the mountain. As noted here in the text, the elevation distance from up there to down there is about 2 000 feet so this is really the size of a mountain. This is a seriously big thing we're looking at here. And so here is an old picture this comes from a forest service publication and it gives you a different view of the slide, admittedly in black and white, but you know we can put up with what we have. The slide is basically in here and it came across the river and ran 300 feet higher than the river over here. Before the slide, it would have just looked like a normal hillside like this. When the slide was running it came fairly close to killing a guy on a horse. So there was a guy on a horse over here who just barely got out of the way in time . And after the slide hit, it made this giant Dam across the river. And so the dam was in here. You'll see there still is a lake over here but the lake filled a lot higher than that. It filled up in here someplace and then there was a bad day that the day when the top part of the dam failed, the flood went down the river, it killed six people, and thank goodness, there were not more people in the way or more would have been killed. Now the geology in this case is moderately interesting. You don't have to worry about this too much, but in case you're interested, the layers in the rock here are basically parallel to the surface that you're looking at. So the layering in the rock goes this way and on top, there are some pretty sturdy rocks, sandstones and limestones, but the stream had cut through them and after it cut through them it got into some fairly weak shales down here and the shales you can sort of think of just sliding on your behind down the slope on those. and so what happened is one really rainy time everything up here slid off and went down really, really rapidly and really, really dangerously. and so we worry a lot about understanding landslides, figuring out where they may happen, figuring out how to keep people safe from them
A few miles (few km) east of the park you can visit another interesting feature: the Gros Ventre Slide Geological Site. There, as shown in pictures and the VTrip below, a mountain-sized ridge is made of rock layers that slope steeply, almost parallel to the north slope of the ridge, down to the Gros Ventre River. Those layers include strong, resistant sandstone resting on weak, slippery shale. The river had eroded down through the sandstone and into the shale, leaving the toe of the sandstone unsupported. In June of 1925, after a particularly wet spring, the entire mountainside let loose, sliding along the soft shale down, across the river, and more than 300 feet up the other side; a rancher and his horse who were on the other side barely escaped safely. The slide mass made a dam, and the river then made a lake many miles long and as much as 200 feet (60 m) deep. The entire slide probably required only seconds to occur and moved cubic miles (many cubic kilometers) of rock.
Such a dam of loose debris is not very strong; water flowing through its porous spaces or over it can remove rocks and weaken it greatly until it collapses catastrophically. Back in Module 2, in the West Yellowstone VTrip, we saw that an earthquake just northwest of Yellowstone in 1959 caused a similar landslide, which dammed a river to form a new lake, and that the Army Corps of Engineers had rushed in to move massive amounts of debris and prevent a collapse of the dam. The Corps knew how likely and how dangerous such a failure would be, in part because the Corps had not been tasked to act at Gros Ventre in 1925. In 1927, the dam formed by the Gros Ventre slide failed, washing out a small town downriver and killing six people. The loss of life would have been much larger if more people had lived there. A few of the people living there were saved when a ranger saw the start of the flood, drove downstream faster than the flood and warned the people to flee. Unfortunately, not everyone listened.
Take a tour of Grand Tetons National Park
Want to see more?
Here are some optional resources you might also want to explore! (No, these won't be on the quiz!)

Mass Movement
Mass Movement

The Gros Ventre slide is an especially dramatic example of an important process that usually is more boring: mass movement. This is the name given to the downhill motion of rock, soil, debris, or other material when the flow is not primarily in wind or in a glacier, or in water (if the material is washed along by a river, we call it a river)
Water is usually involved in mass movement, however, and most mass movements occur when soil or rock is especially wet. Water helps cause mass movement for four reasons: 1) water makes the soil heavier; 2) water lubricates the motion of rocks past each other; 3) water partially floats rocks (a rock pushes down harder in the air than in water) so that the rocks in the water are not as tightly interlocked and can move more easily past each other; and 4) filling the spaces in soil with water removes the effect of water tension.
Number four, above, may deserve a bit more explanation. Think about going to the beach and building sandcastles. Dry sand makes a little pile with sides rising at maybe 30 degrees (steep, but not too steep; see the diagram below). Totally saturated (wet) sand flows easily, forming a pile with a much more gradual slope. But people making sandcastles want damp sand, which can hold up a vertical face. You can even make and throw damp sand balls (be careful where you throw them).
Now watch a demonstration of the process followed by a video explanation.
Video: Mass Movement and Sandcastles Demonstration(:55 seconds)
So, let's see what happens with piles of sand. This is a protractor and I'm adding a little playground sand here. This is dry sand and you'll see it makes a moderate slope. It's going to be about 30 degrees there, as you see on the protractor. Now I'll add a little bit of water, but we're just going to make it damp, not wet and you're not going to be impressed by my skills at making sand castles. But you know when you've seen a sand castle that you can now get a very steep slope. But if we take that sand castle and a wave comes in, the tide comes in, we pour a lot of water on it, you see what happens. It flattens way out. And so we have very different behaviors depending on whether it's dry or damp or wet.
Video: Mass Movement and Sandcastles Explanation (2:09 minutes)
So what's going on with this dry damp wet sand, really what's going on down in it. Well let's take a zoom in on the dry sand. These are individual grains of sand made bigger and they make a nice pile that is sort of like this one. You could have a pile like that underwater and totally wet, but the water supports some of the weight of the grains of sand. The water makes it easier for the sand grains to move over each other and so even a little shake or a little current tends to knock down the pile and give you something very broad and not at all steep on the edges such as what we show here. In between the damp case, water molecules tend to stick to other water molecules and they tend to stick to the sand. So when the water is sticking to the sand and the other water, it sort of forms like you see in this diagram. And if we zoom in, here's two grains with the water in between sticking to the sand grains and to the other water molecules. If you were trying to pull the sand grains apart, it takes a force because you either have to pull a sand grain or both sand grains out of the water and break that attraction or you have to pull the water apart and break that attraction. And so the strength of the water sticking to the sand can hold up a sand castle or it can hold up most of the hillside slopes on the earth, most of the time. So here are three dr,y which might give you a sand dune, and damp, which can give you really spectacular sand castles and holds up most of the slopes on Earth, most of the time. But when you make them really wet they may make landslides and run down the hill and that's not good if you're in the way.
The details of the surface physics involved are a bit complicated, but basically, a drop of water will sit at the junction of two sand grains. If you pull the sand grains apart, both grains will end up wet, so you had to “break” the water from one continuous film into two. There is a similarity to a dripping faucet. A water drop doesn’t fall off immediately but first becomes large and heavy. Water molecules stick to each other, and to the faucet, so strongly that they can hold up a large drop of water before it falls. (In situations such as this, the attraction of water molecules for each other is usually called surface tension.) Damp sand thus is strong—a landslide would require some sand grains to move rapidly past other sand grains, breaking the water bonds between the grains. In fully wet sand, however, the grains move more freely in the water without ever breaking it, so motion is easy. Hence, wind can blow dry sand into dunes, damp sand tends to stay where it is, but wet sand flows easily.
Classifications of Mass Movements
There are elaborate classifications of mass movements, depending on how fast, how wet, how coarse, how steep, and how "other" they are. Most of the names make sense: falls are rocks that fell off cliffs, topples are rocks that toppled over from cliffs, landslides, debris flows, and debris avalanches are fast-moving events, and slumps are something like a person slumping down in a chair (failures of blocks of soil along concave-up curved surfaces).
One fascinating and scary type of mass movement occurs in “quick” clays. You can read about these in the Enrichment. Quite literally, in certain places at certain special times, the foundations of a town built on sediments made of certain types of clay may liquefy and flow down the river, killing people. (Most people don’t need to worry about these, though!)
Enrichment
The quick clays that cause large, dangerous landslides generally start off as clay layers deposited rapidly in a shallow ocean, that then is raised above sea level. This often occurs near a melting ice sheet at the end of an ice age. The melting ice dumps a lot of sediment including a lot of clay, and then, as the weight of the ice is removed, the land rebounds above sea level. Clay particles tend to be platy and may look a little like playing cards. When these particles are deposited rapidly in the ocean, the particles may make a house-of-cards structure, with lots of big spaces. The saltwater supplies large ions that sit in the spaces and help hold the “cards” in position, something like little bits of glue helping hold up a house of cards.
After the clay is raised above sea level, rain supplies fresh water that slowly washes out the salt, like removing the glue that was holding up the house of cards. Eventually, a small disturbance may start a collapse, and this tends to make the clay “run away”, failing catastrophically from a solid to a liquid almost instantaneously, and generating a flow.
Flows from such clays are known especially from parts of Canada and Scandinavia. A quick clay failure at Saint Jean Vianney, Quebec in May 1971 destroyed 40 houses and killed 31 people in Canada, and a similar one at Nicolet, Quebec in 1955 killed 3 people. The Norwegian Geotechnical Institute released an amazing report and video about the Quick Clay Slide at Rissa in 1978; this is generally available online, if you search for it, and is truly fascinating. A man with a new (in 1978) camera filmed part of it but then had to run for his life as the slide expanded toward him. (When this was being written, you could find the video on YouTube and elsewhere.)
Sometimes, a quick clay slide will be small and will generate a flow that crosses a road. Bulldozing the clay out of the way does little good; more just flows across. But throwing a bag of salt into the flow near the road and driving a tracked vehicle through to mix the salt and clay may cause the flow to solidify so that it can be bulldozed away.
Soil Creep
Soil Creep
The most important mass-movement type in terms of transferring material downhill is soil creep, the slow (typically inches, or centimeters, per year or less) downslope motion of soil. Creep may be just a very slow landslide. It may occur from freeze-thaw processes—a column of ice that grows under a small pebble on a cold night pushes that pebble out from the hillslope, and the pebble falls straight down when the ice melts, effectively moving a tiny distance down the hill (see the video below). When trees fall over and uproot soil, or when groundhogs and even worms dig up rock grains and allow them to move downhill, creep is occurring. If you look at a typical hill slope, streams on the lower slopes are present to move water and rock downhill, but the upper slopes lack streams. There, soil creep moves the material downhill.
Naturally, hillslopes typically reach a balance, in which weathering breaks down rocks about as rapidly as mass movement and streams take the broken rocks away. The balance may occur with bare rock sticking out (making cliffs, for example), or with a lot of soil covering the rock. If soil creep dominates the mass movement, the hillslope may be close to balance at all times. If landslides dominate, then the soil will build up for a while before suddenly sliding off, and you have to watch for a long time to see the balance. Over a very long time, the hill will usually get flatter, causing the mass movement to slow. However, the soil will very gradually thicken to slow the weathering as the hillslope is reduced, and near-balance will be maintained.
Humans are greatly upsetting this balance worldwide. Our activities—bulldozing, cutting trees whose roots held the soil, plowing, and more—are moving more material than nature moved before we were involved. Landslides are becoming more common, and causing more damage as we build in more dangerous areas. Soil erosion has increased from our farm fields, making it harder for us to feed ourselves. We could slow or reverse many of these damaging trends if we decided to work at it.
Video: Soil Creep/Frost Heave (1:59)
There are many processes that move soil and loose rocks slowly downhills as soil creep. One of them we're going to show you here. We've drawn for you a hill with a pebble, just a little piece of rock, less than a half an inch or so. There would be lots of pebbles on this hill. Now sometimes on a cold night, ice will grow beneath the pebble and it will push it away from the hill as is shown here. This is a picture of how that process looks in the real world. So this is ice and it has shoved these pebbles up by about one inch from a little hillside. These are pine needles and these are pieces of leaves and bark. So, you can see this is at Colyer Lake in Central Pennsylvania. Now what will happen next is that the ice will melt during a warm day and when the ice melts the pebble will tend to fall down. And the net from that will be that the pebble has moved a little bit down the hill in a day or so. Later in the semester we will see that this process also happens to bring rocks out of the soil, up to the surface, so they can then be moved downhill. Pennsylvania's hillsides had a lot of this process during the Ice Age when we were in a permafrost climate. And our hillsides now are covered with big rocks that will twist your ankle if you're hiking if you're not careful and this is part of soil creep.
Here is a simplistic diagram. See if you can describe what is happening to a friend and then take a look at some truly amazing landslides from around the globe.
A Slideshow of Landslides Around the Globe
Optional Enrichment
These will not be on the quiz but might prove interesting. First, let's start with a video of some amazing landslides.
Video: Top 5 Massive landslide Caught on Camera (10:40)
You can hear background noise, but no true conversation.
And now a retro video about one of the National Park's most iconic elements.
Video: Formation of Delicate Arch (2:40)
Here we are at Delicate Arch. With the possible exception of Old Faithful, this is the most famous feature, the symbol of the parks. This is one of the very many, more than 2,000 arches, that are in Arches National Park, and it shares with them the same origin. These are not carved by running water shooting underneath them. Nor are they carved by wind blasting a hole through it. They're carved mostly by some very odd processes.
Down below, there's a layer of salt that was deposited in a sea a long time ago that was drying up here. Salt, when it's down deep and there's something sitting on top of it, is soft, and it flows. And the salt has flowed into sort of a mound, something like a lava lamp bulging up, and that mound has warped the rocks. And if you take rocks and sort of warp them up, they crack. And so there are these cracks that have made standing vertical walls of rock.
Well, the next thing that happens, if we look at that running along towards the bottom, there's a line on both sides of it. That's a soft layer, and it weakens things. Well, when you start undercutting a cliff-- we have these cliffs, and they get undercut by water leaking out along these little cracks-- then what happens is pieces fall off. And enough pieces fall off that eventually one of the pieces breaks through, and then it's an arch.
This arch is not long for the world. We see on the left, about halfway up, how thin it's getting. And we also see at the top a whole bunch of cracks that are developing. That layer across the top is trying to sag, and as it does, there are cracks that are forming. And some of those cracks sort of look like Pennsylvania keystone sitting up there.
And so it might last thousands of years. It might go in the next big storm. But it is not terribly long for the world. We know that many of the prominent and famous features in the park have changed in the time people have been watching. It will be a loss, but an educational one, when this very famous feature of the Park Service also changes.
Here are some optional websites you might also want to explore! (No, these won't be on the quiz!)
Soil Erosion
(An extensive collection of animations on this subject)
Mass Wasting/Landslide Animations
(An extensive collection of animations on this subject)
Optional Enrichment Article
Optional Enrichment Article: Why the Wind Spins
All large flows on Earth appear to turn along their path, because of the Coriolis effect, which arises because the Earth rotates. You can find serious discussions of the Coriolis effect in any good textbook on meteorology or oceanography. The material in this optional Enrichment article provides a more intuitive version. This isn’t a complete explanation… but we don’t know of a complete explanation that avoids serious math and physics.
The rotation of the Earth is surprisingly fast. If you buckled a belt around the Earth at the equator, the belt would need to be 25,000 miles (about 40,000 km) long. The Earth spins once every 24 hours. This means that the Earth’s rotation is moving a point on the equator at just over 1000 miles per hour (1600 km/hr). In comparison, a point near the pole is essentially stationary (the pole itself stays in place as it rotates). Dr. Alley has walked around the South Pole in three steps, but he couldn’t walk around the equator in a day. If this doesn’t make sense, get a tennis ball or the head of a friendly classmate, draw an equator, and try it out!
If you stand on the equator, the wind is not blowing 1000 miles per hour. This is fortunate indeed because the “mere” 150-mile-per-hour winds occasionally reached in hurricanes can cause immense disasters. Instead, the air near the surface of the Earth is, on average, moving with the surface, dragged along by the mountains and trees and such. You may have seen something similar if you have driven down a highway at 65 miles per hour with a bug stuck to your windshield. The wind at 65 miles per hour surely is strong enough to blow a bug, but the wind very close to the windshield is very much slower than 65 miles per hour—really strong winds don’t blow close to surfaces, because of the friction of the surface, and instead, the air close to the surface does almost the same thing that the surface is doing.
Now, suppose that you watch a parcel of air that rises from the sun-warmed surface at the equator and begins moving towards the North Pole in a convection cell. Once the air has moved many miles north, the Earth under it is no longer rotating at 1000 miles per hour, but is somewhat slower, perhaps 900 miles per hour, and the farther north the air goes, the slower the surface is moving, dropping toward zero at the pole. But aloft, there aren’t trees and mountains to slow the air down from the 1000 miles per hour it had at the equator. Thus, this continues to move at 1000 miles per hour, and “gets ahead” of the Earth beneath. The Earth rotates to the east—you see the sunrise in the east as the rotation of the Earth brings the sun into view—so, the equatorial surface air is moving east at 1000 miles per hour. As this air rises and moves northward over slower-moving land, the wind will appear to turn to the right or east as it blows, getting ahead of the ground. Wind heading south from the equator will also move east ahead of the surface, making a left turn.
Similarly, wind moving from the pole to the equator in the returning limb of a convection cell will lag behind the rotating surface of the Earth, again seeming to turn to the right in the northern hemisphere (and to the left in the southern hemisphere). Thus, the wind cannot go directly to where it “wants” to go; instead, it turns and tends to go in circles. The circular airflow around low-pressure systems and hurricanes occurs because the Earth rotates.
As noted earlier, more-precise definitions are possible of this “Coriolis effect,” which explains why all large flows turn on a rotating Earth. The intuitive explanation given above will fail you if you think of a wind moving due-east or due-west because those winds also turn. Starting from the conservation of angular momentum might be better. Notice, however, that the explanation given above will get the right answer for you, in how much the wind will turn, and which way.
Notice also that Coriolis turning affects large, fast flows, not large slow flows or small ones at any speed. The geological convection deep in the Earth is large, but it is too slow to feel Coriolis much. The difference in rotation speed between opposite sides of a kitchen sink or a bathroom toilet is so tiny that Coriolis turning has no significant effect on the direction that the water swirls as it goes down. Instead, those water swirls are controlled by the design of the sink or toilet, and by any motion in the water at the time the drain was opened; get the water swirling in a sink and then pull the plug, and the water usually will keep swirling in the way you started it as it goes down. Dr. Alley has seen both clockwise and counterclockwise flows in Pennsylvania and Greenland, and in New Zealand and Antarctica.
More Enrichment: Why Cold Air Sinks but Valleys Are Warmer than Mountain Peaks
When air moves up, it expands, which requires that work is done in pushing away other air to make room for the expansion. The work requires energy, which comes from the heat energy in the air, so the rising air cools. Similarly, when air moves down, it contracts as the surrounding, higher-pressure air squeezes the sinking air parcel, and this squeezing is work that is done on the sinking parcel and warms the parcel. If this is happening near the surface of the Earth, and the air is dry, the change in temperature is about 1oC per 100 m of vertical motion. This applies everywhere, at all times. So, it was complete nonsense in the 2004 movie, The Day After Tomorrow, when huge storms brought air down from above so rapidly that the air didn’t have time to warm up.
As noted in the main text, air can cool by expanding as it rises, but also by losing energy by radiation or by conduction into colder land or water beneath. Imagine that a “chunk” or parcel of air, sitting somewhere on the side of a hill, cools a little by losing energy, perhaps by radiating energy to space as the sun goes down in the evening. Will that air parcel sink now, flowing along the hill into a valley? The answer is that it will sink if, after it has sunk and warmed, it is colder than the air that started out in the valley and had to be displaced as the sinking air arrived.
Consider an example. You measure the temperature of your parcel, add 1oC for the warming from sinking 100 m, and if your air is still colder than the air it must displace 100 m below, then your parcel will sink. (If you do this really carefully, friction comes in as well—if your parcel plus 1oC would be only a tiny bit colder than the air it must displace, motion is unlikely; you need a notable difference to overcome the friction and really move.)
Overall, a balanced, stationary atmosphere will cool upward by about 1oC per 100 m under dry conditions, and somewhat less under wet conditions, as described in the main text. Vertical motions will be triggered when cooling or warming creates air that is anomalously cold or warm relative to this stationary profile. So, cold air on a mountaintop won’t necessarily sink, unless that mountaintop air is colder than you would expect from this profile. But on an October evening in the Appalachians, when fog develops and holds heat in the valleys while the mountaintop radiates heat to space, the mountaintop air will become anomalously cold and sink to the valleys.
A Rocking Review
A Rocking Review: Somewhere Over the Puddle
If you want another look at the weather system, and the difference between the Redwoods and Death Valley, the Wizard of Odd takes you Somewhere Over the Puddle in this review revue. (The Sierra tops out over 14,000 feet but in most places is lower, so don't let it bother you that the air in the GeoClip went a little higher than the air in this song--both are right, depending on just where the air goes over.)
Video: Somewhere Over the Puddle (2:54)
Dr. Alley: (SINGING) Somewhere over the rainbow, raindrops drops. Sun and rain make a rainbow with your eyes in between, that's all. Sun falls straight on the equator, just skims the poles.
So tropical heating is greater. Air rises and sinks in rolls. Air lifted in these currents great expands as it feels lesser weight, brings cooling. Air cooling holds less H20, condenses to rain, clouds, or snow. That fall, no fooling.
When there's evaporation, it takes energy That is why perspiration drying cools you or me. Equatorial evaporation stores solar heat that's released by cloud condensation. Energy is conserved, pretty neat.
This heat from Condensation slows. Cloud cooling as it upward grows while raining. But when this air comes down, it's dry, and squeezing drives its fever high. And you know from your training.
Three degrees F per 1,000 feet upward, cools and rains. Five degrees F per 1,000 feet downward warms up the downwind plains. Somewhere over the rainbow, raindrops fall.
Sun and rain make a rainbow with your eyes in between, that's all. Wet redwoods, cold sierra high above Death Valley set to fry. That's why.
Module 5 Wrap-Up
Module 5 Wrap-Up
Review Module Requirements
You have reached the end of Module 5! Double-check the list of requirements on the Welcome to Module 5 page and the Course Calendar to be sure you have completed all the activities required for this module.
Reminder
Exercise #2 is due and Exercise #3 opens this week. See the Course Calendar for specific dates and times.
Comments or Questions?
If you have any questions, send an email via Canvas, to ALL the Teachers and TAs. To do this, add each teacher individually in the “To” line of your email. By adding all the teachers, the TAs will be included. Failure to email ALL the teachers may result in a delayed or missed response. For detailed directions on how to do this, see How to send an email in GEOSC 10 in the Important Information module.
Module 6: Tearing Down Mountains: Groundwater & Rivers
Welcome to Module 6
Welcome to Module 6
More on Tearing Down Mountains: Groundwater and Rivers
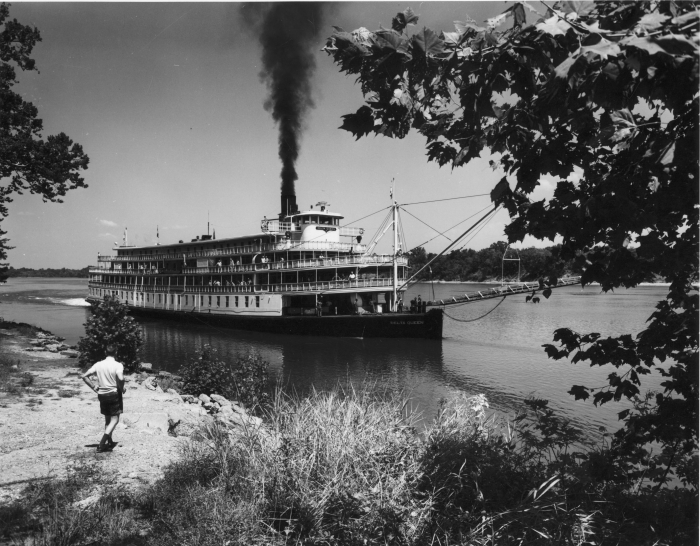
We have seen how landslides and other mass movements supply rocks and dissolved materials to rivers, which carry the material to the sea; from there, the material goes down subduction zones or gets squeezed in obduction zones to make new mountains that produce new landslides. Here, we will look at the way rivers work, how they move their load of rocks along their beds and otherwise interact with this great cycle, and how they are fed by water in the ground.
Video Overview (2 minutes)
The following video is a parody of Proud Mary (Rollin' on the River) and helps introduce some of the topics we will see in Module 6.
Left a big cliff in a landslide, loosened by the rain and an earthquake, too... Started on an epic trip to the delta, and on down a trench 'neath the ocean blue. River Keep On Movin', bed load keep on groovin'. Rollin', rollin', rollin' with the river. Shot through a braid in the mountains, then wrapped around a big old meander bend, but I cannot see the good side of the river, a reservoir trapped me away from my friend. River can't keep groovin', when dams stop the sediment movin'. Holdin', holdin', holdin' from the river. If you go down to the river bet you're going to see some houses too near. They might want to worry, storms are in a hurry, when the levies fail, there is something to fear. River will get moving, wildness will be proven, rollin', rollin', ever rollin' river. Rollin', rollin', ever rollin' river
Learning Objectives
- Recognize that rainwater soaks into the ground and flows through the ground to rivers
- Discuss how rivers must adjust to move both the sediment and the water
- Explain how caves and other karst features form in rocks that dissolve easily
- Understand how these processes affect people, our cities and our drinking water
What to do for Module 6?
You will have one week to complete Module 6. See the course calendar for specific due dates.
- Review all of the course materials
- Take the RockOn #6 Quiz
- Take the StudentsSpeak #7 Survey
- Continue working on Exercise #3
Questions?
If you have any questions, send an email via Canvas, to ALL the Teachers and TAs. To do this, add each teacher individually in the “To” line of your email. By adding all the teachers, the TAs will be included. Failure to email ALL the teachers may result in a delayed or missed response. For detailed directions on how to do this, see How to send an email in GEOSC 10 in the Important Information module.
This course is offered as part of the Repository of Open and Affordable Materials at Penn State. You are welcome to use and reuse materials that appear on this site (other than those copyrighted by others) subject to the licensing agreement linked to the bottom of this and every page. Students who register for this Penn State course gain access to assignments and instructor feedback and earn academic credit. Information about registering for this course is available from the Office of the University Registrar.
Main Topics, Module 6
Overview of the main topics you will encounter in Module 6.
"It was kind of solemn, drifting down the big, still river, laying on our backs, looking up at stars, and we didn't even feel like talking aloud..."
— Mark Twain, Adventures of Huckleberry Finn, Chapter 12.
Water, Rivers, Floods, and Caves: Canyonlands, Delta, and Mammoth Cave
- Most of the rain that falls then evaporates, primarily from plants; most of the water that is not used by plants soaks into the ground.
- Soil and shallow rock usually have air as well as water in spaces; deeper, below the water table, the spaces are all water-filled.
- The water table looks like a smoothed version of the ground surface, and reaches the surface at lakes and rivers.
- The ground acts something like a sponge, with spaces filling during rains, and draining to keep rivers running between rains.
- So, the water table rises in elevation during wet times and sinks during dry times.
Rivers Move Rocks
- Most of the water that reaches rivers flows through the ground first.
- Mass movement supplies most of the rocks that reach rivers.
- If more rocks arrive at a river than the water can move away, the rocks pile up, steepening the river flowing away from the pile so it can move more of the rocks.
- When the rocks are mostly small clay particles, which tend to stick together, the river often has a single, deep meandering channel, and many small rock particles are transported while suspended up in the water.
- When the rocks are mostly larger pieces such as sand, gravel, or even larger chunks that don’t stick together, the river often has many channels that split and rejoin, and is called a braided river; more of the rock transport occurs as bed load bouncing or rolling along the bottom.
Dams Make a Big Difference
- When a river carries rocks into a reservoir (the lake behind a dam), the rocks are dropped as a sediment deposit called a delta (deltas also often form where rivers carry sediment into other lakes or the ocean, although strong currents in a lake or the ocean may carry away the sediment, too).
- A delta builds out into the reservoir but also builds upward so it continues to slope downward into the reservoir, and this “backs up” sediment that can bury fields and houses for some distance upriver.
- Dams typically reduce or eliminate floods farther downriver.
- This makes a huge difference for what lives on a floodplain (in particular, it favors humans over nature).
- Without floods, big rocks are no longer moved by rivers.
- Clean water released by dams picks up small rocks such as sand, removing sand bars and affecting river ecosystems.
Ignoring rivers can be dangerous
- A delta is a big pile of sediment, which slowly compacts under its own weight.
- The Mississippi Delta is miles thick and compacts a lot.
- Naturally the sinking was balanced by new mud from floods, which usually happened every spring.
- Humans hate mud in our houses and floods on our roads, so we have built levees, often on top of natural levees, to keep the rivers out of cities and towns.
- But the delta continues to compact and sink—much of New Orleans has subsided below river level, and some is beneath sea level.
- Wetlands south of New Orleans toward the Gulf of Mexico have been lost as levees and dredging for shipping and oil production have kept floods from depositing mud to balance sinking.
- The city now is low in elevation, beside a higher river and sea as human-caused warming raises sea level, with reduced wetlands that would have protected the city if they still existed, and all of this can lead to huge disasters when hurricanes hit.
- Before recent hurricane disasters happened, scientists, disaster planners, many journalists, and others repeatedly warned that the disasters were coming.
- The sinking of the city and rising of the sea are continuing; rebuilding without major changes will cause the next disaster to be even worse.
Caves are Cool
- Some rocks (esp. limestone) dissolve easily; if such rocks start with just a few cracks, the dissolution will be focused in just a few places.
- Such focused dissolution makes low spots called sinkholes at the surface, with caves beneath, commonly with springs and other features, giving a landscape called karst.
- Caves tend to form near or below the water table and to be filled with water initially, but the water may then drain out leaving the cave air-filled; water dripping in then may lose extra CO2 picked up from the soil, depositing dissolved limestone to make cave formations.
- Water goes through caves quickly; pollution discharged today may harm someone farther downriver tomorrow.
- Water usually moves through other types of rocks much more slowly so pollution released today may not “get” anyone for a while, but once it does, clean-up is usually very hard and very slow.
- Scientists and engineers have developed some clean-up options, but the best option is to keep poisons out of the ground.
Canyonlands National Park
Canyonlands National Park
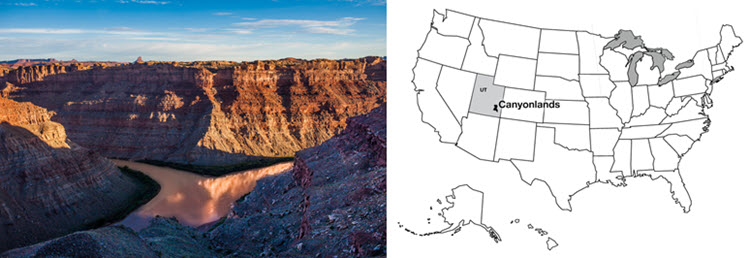
Right: R. B. Alley © Penn State is licensed under CC BY-NC-SA 4.0
Southwest of Moab, Utah lies Canyonlands National Park. A “rough” park with few services available, little water (except for the rather muddy rivers), pot-holed roads, and awesome mountain biking, Canyonlands preserves the confluence of the Colorado and the Green Rivers. Many “visitors” to the park never actually enter it, choosing to gaze down on the Colorado from the vantage point at Dead Horse Point State Park. The two rivers of the park are incised a third of a mile (half a kilometer) or more into the red sedimentary rocks of the Colorado Plateau. Those rocks, mostly sandstones (made from sand) and shales (mud rocks, made from pieces smaller than sand), give the distinctive cliff-slope pattern of the canyons—resistant sandstones form cliffs and cap the flat-topped mesas, while softer shales form slopes.
The great Colorado Plateau, flanked by the spreading regions of the Basin and Range to the West, and the Rio Grande Rift to the east, occupies large parts of Utah and Arizona plus some of Colorado and New Mexico, and includes Zion, Bryce, Capitol Reef, Arches, Grand Canyon, Petrified Forest and Mesa Verde National Parks as well as Canyonlands, and many national monuments and other public treasures. The Colorado Plateau is noted for reddish, flat-lying, rocks from the Paleozoic of a few hundred million years ago.
Take a tour of Canyonlands National Park
The details are not fully known of how the Colorado Plateau avoided extreme deformation for hundreds of millions of years, while the rocks in most of the West were being bent, broken, or pierced by volcanic eruptions. The silica-rich continental rocks of the Plateau may be a bit thicker than in its surroundings, so the spreading of Death Valley was unable to tear the Plateau apart and instead jumped across to the east side of the Plateau to continue as the Rio Grande Rift (the valley in which the Rio Grande flows). The spreading even seems to have nibbled away at the Plateau, with a few big pull-apart, Death-Valley-type faults visible in places such as Red Canyon just west of Bryce (see the picture below). However, our concern here is slightly different— the role of rivers.
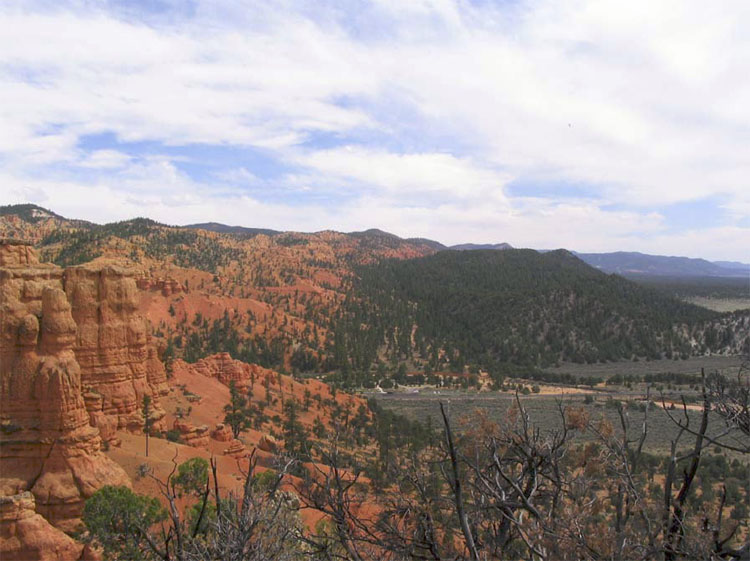
Want to see more?
Here some more information you might also want to explore! (No, it won't be on the quiz!)
Canyonlands National Park
(Provided by USGS)
Rain, Rocks, and Rivers
Rain, Rocks, and Rivers

The rivers of the Colorado Plateau are nearly as well known as their parks, for great rafting, incredible scenic views, and deep canyons. Rivers including the Colorado, the Green, the San Juan, the Fremont, the Virgin, and others have taken their place in history. But what are those rivers doing down there in the canyons?
Simply put, a stream or river is a conduit to take excess water, and sediment, from high places to low ones and usually to the ocean. Looking first at the water, rain or snow falls on the ground. (Streams are just smaller rivers, and streams are sometimes called runs or creeks or cricks or other names… and they all do more-or-less the same things, so you can use the terms interchangeably here.) Averaged around the world, rainfall (plus snowfall after it melts) is about 3 feet per year (1 m per year) (if you kept all the rain that fell in a year, and didn’t let any of the water evaporate or flow away or soak into the ground, it would make a layer about 3 feet deep). Pennsylvania's annual rainfall is also near the global average, as is the rainfall in much of the tree-covered eastern US. Some of this water evaporates directly, but most is used by plants and then transpires (evaporates) from their leaves. The evaporation from plants usually is lumped together with evaporation from other surfaces and called “evapotranspiration.” In a humid temperate climate such as central Pennsylvania, roughly two-thirds of the rainfall is returned directly to the sky by evapotranspiration; in dry climates, a larger fraction of the rainfall—often almost all of it—may be returned to the air by evapotranspiration.
Of the water that avoids evapotranspiration, a little actually falls on lakes or rivers, and some may fall on the land surface and then flow directly and rapidly over the surface into lakes or rivers, especially from the surfaces that humans have covered with buildings, roads, and parking lots, thus keeping the rain from soaking in. But most of the rain that avoids evapotranspiration soaks into the ground to form groundwater.
Soils and most rocks contain interconnected spaces, including gaps between grains of sand, cracks in the rock (which often are called joints), caves, and other openings. The ground acts a little like a sponge, with water soaking in and then slowly draining out to the rivers. We will discuss this groundwater flow a bit more when we visit Mammoth Cave, next; for now, simply note that because gravity pulls water down, rocks near the surface usually have some air in the spaces even where conditions are damp, and deeper rocks usually have all their spaces filled with water. The surface separating the deeper rocks with all spaces water-filled from those closer to the surface containing some air in spaces is called the water table, and where the water table intersects the surface of the Earth, a river or lake occurs.
Rivers flow even when it isn't raining because water is slowly draining through the ground from beneath hills to the rivers. The water table rises in elevation during wet times as the “sponge” of the Earth fills up with rain, and the water table falls during dry times as the sponge drains to keep the rivers flowing. And the water table is just below the surface in valleys and actually hits the surface at rivers, but you must drill deeper under ridges to penetrate the water table and complete a water well.
Video: Water Table (3:48 minutes)
The following video shows the movement of water in the atmosphere and land. Rainfall supplies evapotranspiration back to the air, runoff along the surface, and groundwater that flows through spaces in rocks to reach streams. The water table rises as rain fills the "sponge," and the water table falls between rains as the "sponge" drains to the stream.
Let's have a look at water interacting with the ground. Here's a bird flying over a diagram that we're going to use to understand some of these features. This is what you can really think of. This is Shavers Creek Environmental Center of Penn State. This is a little stream that flows into Shavers Creek, just downstream of the dark, cliffy spot, which is well worth a visit if you get a chance.
But we'll go back to our diagram. You know that usually it is not raining, so we'll make the rain go away. And now it's not raining, but you need water for drinking and cooking and flushing your toilet. So maybe you need to drill a well. If you start drilling your well, initially you're going through rock or soil that may be damp, but there is some air in some of the spaces, and at some depth you will hit water.
You'll hit what we call the water table. Below that, you're drilling through rock or soil, in which all the spaces are full of water. You can pump that water out and use it. If you were to drill your well closer to the stream, you don't have to drill as deep. The water table is sort of a smooth version of the upper surface, and the water table hits the surface at streams and lakes.
Now we put the rain back in and ask what happens to it. A little runs off more if it's raining on a paved parking lot. But in natural systems, only a little bit of this goes into direct runoff directly to the stream. Most of it, two thirds in central Pennsylvania, starts to soak into the ground, but then it's grabbed by roots, or maybe a little bit just evaporates directly. Most of it grabbed by roots, goes through trees.
It then goes back to the air. We call that transpiration. Add in the part that evaporates directly and it's evapotranspiration. And sort of two thirds of the rain that falls in Pennsylvania just goes back up in the air where it can make new clouds and rain again. With two thirds evapotranspiration, only a little bit runoff that leaves almost one third to soak into the ground, eventually move through those water filled spaces, over to the stream and down the stream headed for the ocean.
Yep, there's a little coming in from the other side of our diagram too. When the water is reaching the water table faster than it flows away, you'll start to fill some of those spaces that had air just above the water table. And the water table rises in elevation. If it rises all the way across, it can make a flood, and we need to know about things like that. Most of the time, though, water is not arriving, but water is leaving down the stream.
And so, you start to drain water out of some in those spaces, and the water table drops in elevation. If it drops too far, the stream may dry out. If it drops too far, your well may dry out if you didn't drill it deep enough. And you may have to find a different source of water. So, back to Shavers Creek and a few of the things to know about water and the landscape.
Video: Grand Canyon Groundwater (1:43 minutes)
Water pumped out of the ground does not flow naturally to springs and rivers. Sometimes, we use that water to flush our toilets or in other ways, and then dump the water back into the river farther downstream. Other times, we use the water to grow crops or lawns and lose the water to evapotranspiration, so the water never reaches springs or rivers, which could dry up as a result. Here’s another vintage CAUSE video on how this sort of water use could impact nature at the Grand Canyon. Such issues are increasingly important across the world.
So now we're on the rim of the canyon. The rim of the canyon does not have streams on the surface. When it rains, which is not all that often, but when it rains, what happens is that the water soaks in. So if you had a rainstorm, you see the water start to make a stream, but then it soaks in. What happens to that water? It goes down through the spaces in the rocks until it hits a rock that it can't get through, such as the Bright Angel Shale. Then it runs along laterally and it comes out at those beautiful springs that we see in the canyon.
Now what's happening here is there's more and more people want to live here, and they want to have water, so they drill wells. And after you drill a well, you suck the water out and you use it to water your grass, or your crops, or your golf course, or to drink or flush or what have you, and eventually it evaporates. And so what you're doing is removing the water that should be running to the springs. And there's worry-- it's not happening yet, but there is worry-- that someday, we may start to lose the springs in the Grand Canyon and the unique biota, the wonderful ecosystems, that live down there because of development outside of the park up here.
Rearranging Rivers
As we saw back at the Badlands National Park, weather attacks rocks to produce loose pieces through the processes that cause weathering. And as we saw at the Gros Ventre slide near the Grand Tetons, processes on hillslopes including soil creep and landslides deliver the loose pieces (which we can call sediment) to rivers. A river is then faced with a balancing act; it must transport both the water and the sediment delivered to it.
You may be able to think of many ways for the river to adjust if it receives more or less water, more or less sediment, bigger or smaller sediment pieces, or “stickier” or “less sticky” sediment pieces (those more or less likely to clump together). For example, if more sediment is delivered to a river than it can remove, then the sediment will pile up, raising the elevation of the bed of the river where the sediment is being delivered. This steepens the river flowing away from the pile—the elevation of the ocean where the river ends has not changed, but the elevation of the riverbed is higher above the ocean—so the river flows faster and is better able to move the sediment. If nature delivers more water and less sediment, the river will tend to wash away all of the sediment supplied and have energy left over to carve into the rock of the riverbed. This cutting downward will make the river less steep from there to the sea—because the river ends at sea level and can’t lower sea level, lowering the upstream reaches of the river must make the slope to the ocean less steep. A less-steep river will carry less sediment and so reduce or eliminate erosion of its bed, and often will flow over loose sediment without removing that sediment and reaching bedrock. Such a river tends to reach a balance in which it just removes the water and sediment supplied to it. In the process of reaching this balance, rivers also may adjust the width, depth, and shape of their channels as well as the steepness.
That background, it should not surprise you that rivers are highly diverse. A white-water rafter braving the rapids of the Grand Canyon sees a very different setting than a cruise passenger on the Mississippi River going to New Orleans! The white-water guide and the cruise ship captain have jobs that require understanding rivers, and so do hydroelectric-plant managers, fisheries experts, city planners, designers and architects trying to protect people from floods, water-supply professionals, and many others. When Europeans settled in North America, they often moved inland from the coast along rivers to establish towns that became cities, and trade moved along rivers. Thus, today many people live near rivers, and all of us interact with rivers, if only by traveling over them on bridges and trusting that the engineers understood the way that the river interacts with bridge foundations.
Each river is unique, but we can find a few repeating patterns that will help you see the bigger picture. We will briefly discuss three of them: straight, meandering, and braided.
Straight Rivers
The only way to make a truly straight river is to dig a trench and line it with concrete… and that really isn’t a river. But, in many cases, a river flows in a single channel, often eroded into bedrock. If you look upstream or downstream along such a river, the canyon walls often look a little like the letter V with the river flowing in the bottom. Such rivers are often eroding slowly into the bedrock, with the water able to carry away all the sediment that is supplied plus the little extra rock that they break loose from their beds.
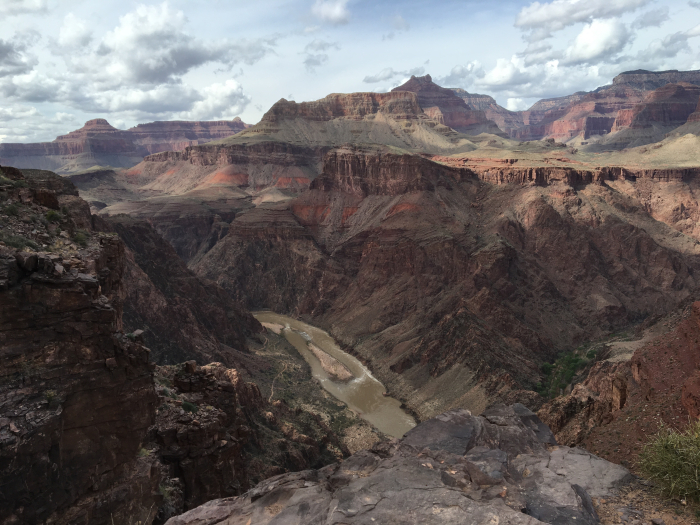
Video: Making a Sand Canyon / Grand Canyon National Park (1:30 minutes)
Downward erosion by a river into its bed produces steep river banks that then erode back, so you see the river banks making a sort of V if you look along the river, as in the picture of the Grand Canyon just above. In this vintage CAUSE video, Dr. Alley makes a very small-scale demonstration of how this happens, in sand near the Grand Canyon.
[MUSIC PLAYING]
If you make a canyon, and you deepen that canyon, the sides fall in. And one can see the sides avalanching in there merrily, eating back over time. See waves of adjustment going on. It's really beautiful to see.
I steepen it, and it steepens at the bottom. And then it eats its way back, and then it eats back at the head, eventually. Well, that's exactly what's going on here.
And so we can see across the river. The river is cut down. And then above it, there's that slope of rocks that have fallen off of the cliff. And as the river cuts down, that slope will be lowered and rocks will fall off of it and come avalanching down in exactly the same way as what we're seeing going on here in a very small scale. And you'd see all these little waves and nick points, and there are quite a number of very exciting things going on here.
Meandering Rivers
In addition to these “straight” rivers, we often see rivers in patterns called meandering and braided (see the pictures). These patterns are common in rivers that have received more sediment than they could move, so the river flows across some of its own sediment. A meandering river generally has a single, deep channel, but that channel flows in great curves or meanders. A braided river, in contrast, tends to be wide and shallow, with the water splitting and rejoining around many sand bars or gravel bars scattered across the river.
Much of the difference between the braided and meandering rivers is related to the type of sediment they carry. If you have ever worked with clay in a pottery class, you know that it is made of very small pieces (you cannot see or even feel the individual pieces, the way you can see and feel larger grains of sand or gravel or boulders), and those tiny pieces stick together well (you can make clay pots, or you could make and throw balls of clay). When the sediment delivered to a river is rich in these small clay pieces, their stickiness allows the river to form a single deep channel with steep banks that don’t collapse. When the river does knock some sediment loose, that sediment tends to stay suspended up in the water (we call this “suspended load”), which flows rapidly because it is far from the river bed where friction with tree roots and the bed itself slows the water.
Such deep streams typically curve back and forth, or meander, along their paths. Put a tree’s roots, or a boulder, or almost anything else in the way of the river, and the water flow will be deflected away from the obstacle, hitting the other bank of the river and eroding it, so once started, a meander bend will grow. Meandering rivers usually occur in relatively flat, lowland regions towards the coast, such as the Mississippi heading for New Orleans, but you can find meandering streams elsewhere. (Meanders even develop without obvious causes, as in some streams flowing on top of the ice of melting glaciers—something disturbs the flow, and then the pattern of hitting the other bank and eroding it or melting it on a glacier leads to meanders.)
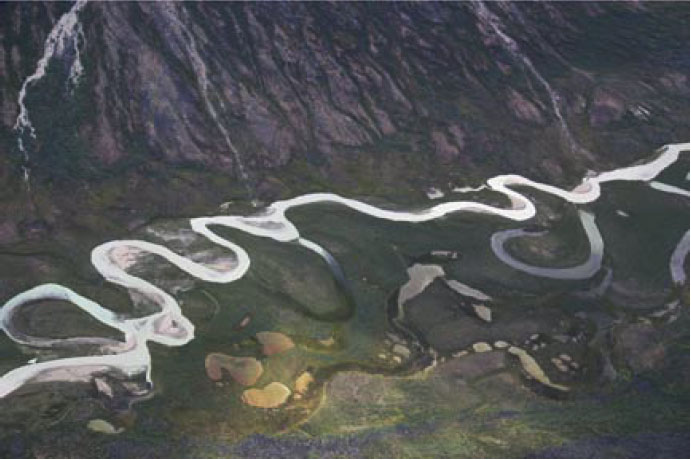
Braided Rivers
a river receives lots of sand and gravel or even bigger chunks rather than clay, the large pieces do not stick together well enough to form a steep river bank, and instead tend to collapse into the water. The single deep channel of a meandering river would become wider and shallower if its river banks collapsed, and a wide, shallow river is good at rolling sediment along its bed. Sediment rolled along a river bed is called “bed load”. Often, the bed load will be piled into a lot of sandbars or gravel bars in the river during a flood, and the bars will be left sticking out of the water as the flood ends. Water then must flow around these sandbars. When viewed from above, the splitting and joining of parts of the river around the sandbars looks something like ropes of water that have been braided together, so these are called braided rivers. They are common in upland regions, where steep mountain slopes shed landslides of coarse sediment into the channels, but you can find braided rivers elsewhere.
Whether straight, meandering, or braided, rivers move water and sediment downhill. And, when people build dams to form reservoirs for flood control, recreation, or other purposes, we interrupt the sediment transport as well as the water flow, with consequences that we discuss next.
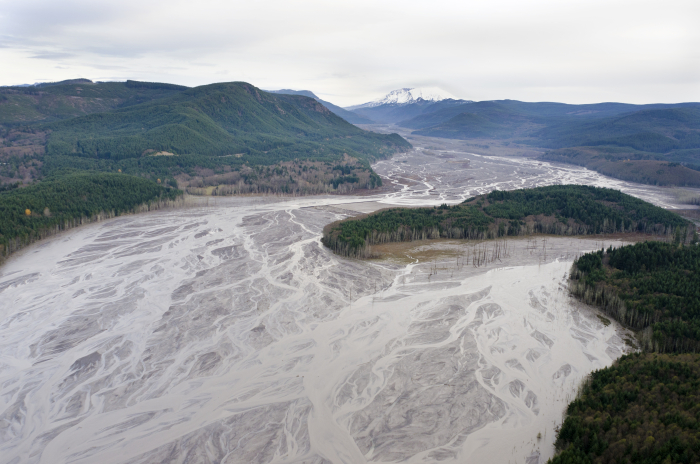
Dams and Deltas
Dams and Deltas
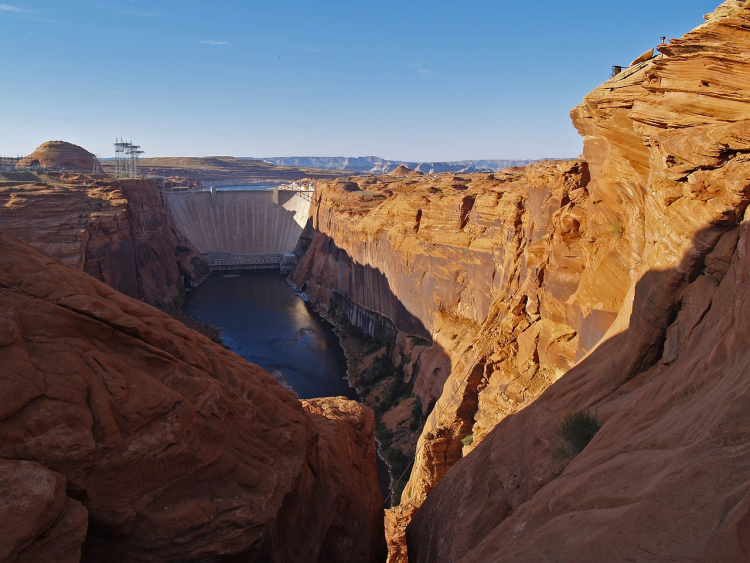
Video: How Dams Work (2min, 27sec)
So let's take a look, a strange look, at a river. This is going along the river towards the sea. And this river happens to have trees that grow up on the riverbank. So you can get an idea how we're looking at this.
And what we want to do is ask what happens when we build a dam on this river. And we're concerned about the future of a couple of houses that used to be along the river, one just below the dam right down here, and the other one up above the dam up here, sitting along the riverbank. Well, they build the dam, and the dam fills with water, and it doesn't quite take out the house up above.
But the river's carrying mud. It's carrying sediment. And the sediment starts to deposit out into the lake to fill it with a delta.
Now, rivers have to go downhill. So as the lake is replaced with the mud, if the river were to hit a perfectly flat spot like this, you know what it has to do. It has to build up so that it's headed downhill. And so as the river builds the delta out into the lake to fill the lake, why, you have to bury the house, and that makes the person who lives there mad.
Now, at the other side, it's even more interesting. There's no floods anymore, so the river loses the ability to carry gimongous rocks, which might make the homeowner happy. But the water coming out from the dam is clean. It has no sediment in it. And if there's sand below the dam, why, the water will start washing that sand away.
And that will do a number of things. Your house, now, rather than sitting there right next to the riverbank-- you'll look out some morning and you're ready to fall into a giant hole that's been cut. And you get out there and you fall and then you say, oh, no, and you're very unhappy.
You are not nearly as unhappy as the salmon that are trying to come upstream, because as you may know, salmon like to get really amorous around sand and gravel bars. And if the river has washed away the sand, then you can't have fun with your honey and then leave your eggs there to do well. And so you have a big loss in salmon, as well as getting people's houses unhappy. And so putting a dam on a river makes a big difference.
Dams are generally built to influence water, but as noted on the prior page, dams always influence sediment, too. An important example of a dam influencing sediment as well as water, and sediment influencing many other things, occurs downstream of Canyonlands National Park and upstream of the Grand Canyon along the Colorado River. The Glen Canyon Dam was built on the river in the 1960s. The dam stopped floods coming down from the Rocky Mountains through Canyonlands. Water from floods that had raged through the Grand Canyon is now stored in the reservoir and then released gradually. Several things began happening to the Colorado River once the dam was completed. The dam traps the sediment carried by the river, and releases clean water, so the reservoir is filling with sediment, and in a few centuries or less will be full. Unique fish species that thrived in the muddy waters of the Grand Canyon suddenly are much more easily visible to predators and thus easier prey, often for introduced species, so many of the native species are endangered and disappearing. Evaporation from the large surface of the lake trapped by the dam removes water from the river, increasing the scarcity of water downstream.
In this “straight” river mostly flowing over bedrock, floods in the past had washed sand into corners along the river to make sand bars. This stopped when the floods stopped. However, the clean water released by the dam still flowed fast enough to remove some sand, so the existing sand bars below the dam were slowly washed away. But, many types of wildlife depend on sand bars, and thus were harmed—cottonwood trees had grown in the sand, birds lived in the cottonwoods, and deer could drink from the river by standing on the sand bars but not from the rocky cliffs. Floods on un-dammed side streams continued to dump large rocks into the Colorado, but the Colorado lacked the high flows to move this material onward, so the rapids in the main river at the mouths of the side canyons began to steepen.
In the spring of 1996, efforts began to rebalance the system by releasing artificial floods from the dam. The first flood was a partly successful experiment, rolling some of the big rocks out of the rapids at the mouths of the side streams, freeing sand trapped beneath, and putting some of that sand into bars. But, those bars weren’t very big and didn’t last very long. Additional human-made floods have been released more recently, timed to occur when natural floods coming from side streams were delivering additional sediment, to help make bigger sand bars. Additional attempts may be made because these artificial floods really have helped. Such human-caused floods cost money (lost hydroelectric power when extra water is routed around the hydroelectric plant in the dam to get water into the river in a hurry) and require lots of planning (you need to warn people camping or hiking in the Canyon before you suddenly flood them out!), and may be stopped during times of drought when other uses for the water are considered to be more important.
Video: How Deltas Work (2min, 23sec)
We're flying along in our helicopter out over the ocean, and we're looking towards shore at a beautiful beach we just saw there. And we're seeing the pretty waves of the ocean underneath us. And we see a great river coming down to the shore, something like this, meandering along the way some of these great rivers do.
Now if we could somehow hang along in our helicopter and wait for a flood, what we'd notice is that sitting next to the river, there's a bunch of trees that are growing. And when the flood happens, the water would start trucking out of the river into both directions. And as the water came trucking out of the river, it would slow down when it got into the trees.
And as it did so, it would start depositing a layer of mud. And that layer of mud would be thickest very close to the river, and then it would thin on out across the flood plain of the river. And this would be happening on both sides of the river. And so after a while, we would see that the river is contributing to building a natural levee that sits along the river and runs all the way out to the mouth.
Now, if we could keep watching this happen over very long times, over hundreds or thousands of years, we would see that in many places, the ocean is not strong enough to get rid of all the mud that the river delivers. And so the river would start building out into the ocean, and it would just extend its way out there, building a levee. And as it did so-- not a very high one-- but as it did so, the river itself would lengthen. And so it would be coming out in there, and the water would be flowing down to the sea.
And when this is going on, it has to keep going downhill. So it builds up, as we saw earlier, as well as building out. And so you start getting higher walls that hold the river in, on up here, to allow it to flow downhill and run out like that.
And so as the bed of the river is raised, and it gets higher walls, it's like being on the log flume at the amusement park. And at some point, there's a flood, and that wall breaks, and the river takes the short way down to the sea. And then the whole process will start over again. It'll start building a new wall, and building out that way. And eventually, sometime in the future, this one will become big, and then it will do it over again. And so rivers build deltas. They switch from one place to the other as they build out.
Meanwhile, as sediment fills the reservoir, sediment will also accumulate along the river upstream of the reservoir. For the tributaries to Lake Powell behind the Glen Canyon Dam on the Colorado River, there aren’t many people living in places where this sediment accumulates, but if there were, their fields and houses would be buried by mud. A river slows down as it enters a reservoir, or any other lake or the ocean, and sediment is dropped from the slowing water. Unless strong waves and currents in the reservoir or ocean take that sediment away, a pile called a delta forms. But the delta cannot be perfectly flat on top. If it were, then the stream would drop its load when it hit the flat spot and slowed down, and that would raise the flat spot. So, as the delta grows into the lake, the upstream end of the delta must build up so that the river still flows downhill, and that, in turn, will cause sediment to build up for some distance upriver (see the figure below).

When two dams were built between 1910 and 1926 to supply hydroelectric power from the Elwha River, which flows north from Olympic National Park in Washington state, the dams caused major problems because of their effects on sediment and water, and wildlife. The dams were built without ways to allow passage of salmon farther upstream to spawn. Most of the salmon had spawned upstream, but some had spawned in sand and gravel downstream of the dams, and the river washed that sand and gravel away after the supply of new sediment was blocked by the dams. The annual “flood” of more than 300,000 salmon that returned to the river before the dams were built turned into a trickle of barely 3,000 salmon. (Instead of building fish ladders to allow salmon to move around the first dam and continue upstream, a fish hatchery was built, but the hatchery was quickly abandoned.)
After the river washed away the sand and gravel in which the salmon had spawned, the river quit delivering sediment to the beaches of the Strait of Juan de Fuca (an arm of the Pacific Ocean). Those beaches then washed away. Without the beaches, the native peoples were no longer able to carry on their traditional shellfishing because the shellfish were lost after their sand-and-gravel beaches were lost. The nearby harbor of Port Angeles had been guarded by sediment-fed sandbars that also washed away, requiring more money to be spent on human-constructed protection for the harbor. The little bit of hydroelectric power being produced did not come close to covering the costs of all these damages.
In an ambitious plan to help the port, the people, the beaches, the river, the salmon, and the park, the federal government purchased the dams to remove them.
Beginning in 2011, both dams were removed. Within a few months after removal, salmon were returning to the river. The river, beaches, harbor and more will take a while to get back to "normal," because so much was changed by the dams, but there is much optimism about the recovery, which is proceeding rapidly. You can see the amazing changes at the mouth of the river in the pictures below.
Conflicts such as these between dam-builders and those who prefer free-flowing streams are not new. You don’t need to know these details, but it might interest you to learn that In 1731, a mill dam on the Conestoga River near modern Lancaster, Pennsylvania was torn down because it was ruining the fishing industry, which, in a petition in 1763 to remove other dams on that river, was said to include shad as well as salmon, rock fish, and trout in tributary streams. In 2018, a dam on the Neuse River in Raleigh, North Carolina was removed to allow natural fish runs of shad as well as striped bass and Atlantic sturgeon.
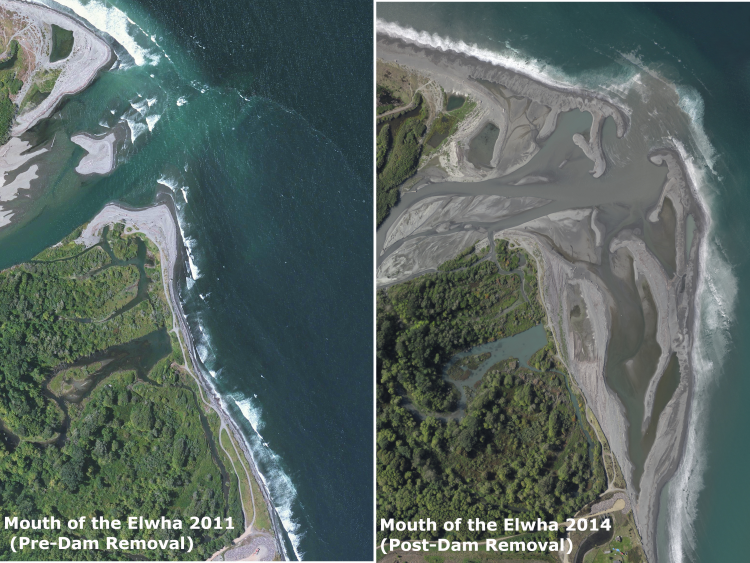
Video: Dam It! (2min, 44sec)
Dams cause huge changes on rivers, both upstream and downstream. In this film clip, Drs. Anandakrishnan and Alley discuss the Glen Canyon Dam and Lake Powell on the Colorado River. Huge changes were caused by this project, including in the Grand Canyon far downstream. The CAUSE 2004 class used some clever editing to manufacture a disagreement between the professors, who are much closer to being on the same wavelength than you might imagine by watching this.
Today we're going to go see one of the most extraordinary manifestations of man's desire to tame the wilderness.
We're looking, standing here above what was once a vast and deep and beautiful canyon and has turned into a wonderfully used lake that people like to go boating on and people like go swimming in. And so we've seen a great change in what happened here from a world that was used by very few who love solitude to a world that's used by many who love running around in motor boats.
Well, I think a lot of the early settlers really wanted to place their mark. They said, we are not going to be defeated by this land that has only a few inches of rain per year. We will live here. And the way to do it is to get lots of money from Washington that we collect out East and bring it out West here and build these dams. And these places just do not belong. They are magnificent creations. They are incredible engineering masterpieces. But they should not be here.
And so it obviously does a tremendous amount of good, and it's very clean. Once you have a dam, once the lake gets here, you don't dirty anything up. You're not running out smoke from your smokestack that will dim the air in the Grand Canyon.
They should not be here. And I think we've learned that over and over again. But you go to India, you go to China, and they're doing the exact same thing. The Three Gorges Dam in China, one of the most enormous, incredible engineering projects, displaced millions of people, is an absolute ecologic disaster.
If you've got hungry people, and you can save that water and ship it to them, it's food. If you've got people who need power to do things, and you can ship them the power then they can use it.
Dams are amazing human achievements, but they have incredible costs associated with them. So to me, it's very much of a bittersweet kind of a thing. As a former engineer myself, I can appreciate the artistry and the mastery that goes into building these. But as a practicing geologist, as a practicing resident of this planet, I find them a little depressing to be quite honest.
We're going to argue this one again on a lot of rivers in a lot of places for a lot of time.
The Delta National Wildlife Refuge
The Delta National Wildlife Refuge
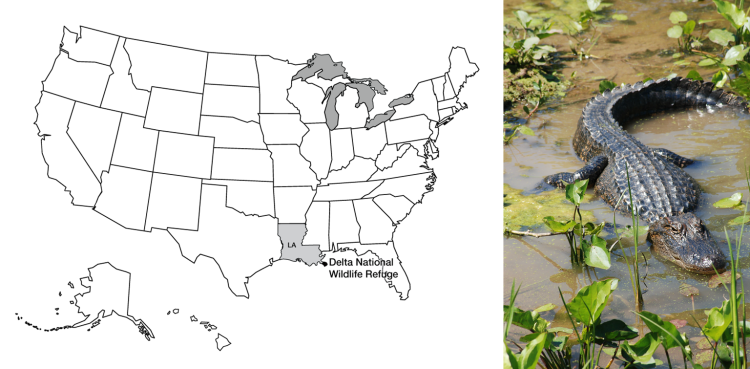
Right, © Deanna / stock.adobe.com
If you look back at the pictures of the delta of the Elwha River, you can see the regrowth of the delta after the dams were removed. The right-hand picture in that pair shows a large delta, which looks something like the delta from before the dams were built. Erosion of that delta from before the dams were built gave the no-delta situation shown in the picture on the left, taken while the dams were in place. Similar loss of deltas is happening in other places, including the delta of the Mississippi River, which we will visit next.
At the tip of the Mississippi Delta lies the Delta National Wildlife Refuge. This is one of several wildlife refuges along the US coast of the Gulf of Mexico. These refuges are homes for a great range of resident wildlife, and also draw migrants from the north. Ducks and geese, herons and cranes, gallinules and rails, the wetland birds of much of the North American continent fly in through the autumn, and then spread north again in the spring. (Yes, technically, a National Wildlife Refuge is not a National Park, but it is a national park, so we’ll cheat a little and use it—it makes a good story. And, it is just down the river from the wonderful bayous of the Barataria Reserve in the Jean Lafitte National Historical Park and Preserve—well worth a stop if you're in the area!)
Take a tour of the Mississippi River Delta… and some other deltas
Here are a few pictures of deltas in Greenland, and some from the Mississippi River.
Take a tour of the Bayou, Barataria Preserve, Jean Lafitte National Historical Park and Preserve, Louisiana
Here are a few scenic pictures of a wonderful park set aside to preserve nature on the Mississippi Delta below New Orleans, with a little information about fossil-fuel formation in the last two slides.
Want to see more?
Here is another optional vTrip you might also want to explore! (No, it won't be on the quiz!)
Jean Lafitte National Historical Park and Preserve
(Provided by National Park Service)
Controlling Rivers and Wrestling with Mud
Controlling Rivers and Wrestling with Mud
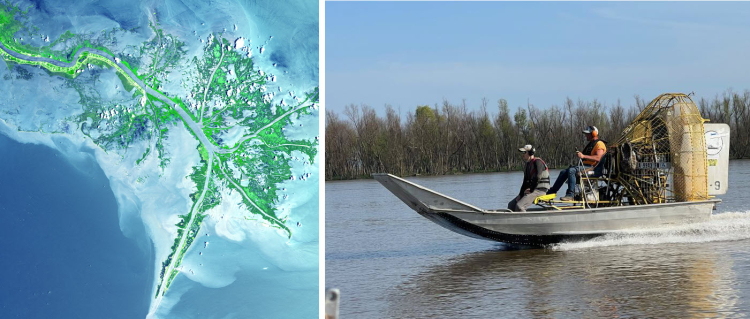
Right: Research using an airboat by Oak Ridge National Laboratory, US Department of Energy, Mississippi Delta.
Controlling Rivers
Unfortunately, the wetlands of Delta National Wildlife Refuge and Barataria Reserve in the Jean Lafitte National Historical Park and Preserve are disappearing at an astonishing rate, because of the indirect effects of human activities. Estimates are that every year Louisiana is losing over 100 square kilometers of wetlands (equal to loss of a square with sides more than six miles long). Whether the wetland birds will continue to stream north for generations to come may depend on how humans respond to the challenge.
The Mississippi Delta is a massive pile of mud and sand from the Rockies and Appalachians, transported by the river and dumped into the Gulf of Mexico. Long ago, the Gulf of Mexico extended much farther north into the heartland of what is now the U.S.; over the last 70 million years, the delta has grown southward from near Cairo, Illinois (up by St. Louis), until now the former embayment has been turned into a projection from the end of Louisiana out into the Gulf. There, the delta is as much as seven miles thick. If you have ever watched mud settle in a bottle of water, or if you have observed how your boot packs mud down if you step in it, then you know that, over time, mud will compact under its own weight or under the weight of anything placed on it.
As the delta grew into the Gulf over the ages, a natural balance was reached. The compaction that occurred during a year would leave a little space at the top, but the springtime floods would bring new mud to fill that space. Trees and other vegetation would grow up through the new sediment, or re-seed on top, and the system would continue, wildly productive and vibrantly green.
Wrestling with Mud
Humans don’t interact well with this natural system. Many people have settled near the river. Plants can grow through the mud of floods, but people don’t enjoy having their houses slowly fill up with mud. So, humans have built control structures. We built dams upriver, which trap sediment behind them, and which hold some floodwaters in check. Because large floods do happen even with those dams upriver, we also built levees along the river in its downstream reaches, great walls that hold the river in and attempt to channel the floods to the Gulf rather than letting the floods cover fields and towns and roads upriver. We also dredge the river, deepening it to carry the water—and shipping. Other channels have been cut through the delta for oil and gas prospecting and production. The great floods that shoot down the river then do not spread over the floodplain and the delta, and thus do not deposit fertile sediment to fill the space left by compaction of mud, but instead are piped to the Gulf through these human-made or human-deepened channels, carrying the sediment far offshore to settle in mile-deep water.
Way back in 1996, when the very first edition of this course was taught, we wrote:
"Today, much of New Orleans, which does lie on the delta, is well below sea level. A tanker in the river between its levees is higher than the playing field of the Superdome. Rainfall, and water seeping from the river, must be pumped out so that the city doesn’t fill with water. If the pumps were to fail, the city would become a lake. The city steadily sinks deeper, and the levees are steadily raised by the Army Corps of Engineers, as instructed by Congress, to keep the river caged. Meanwhile, the wetlands of the delta, unnourished by new sediment, are sinking beneath the Gulf..."
Students in Geosc010, and in many other classes at Penn State, learned what elected officials and coastal planners and students at other schools also learned, that New Orleans was a disaster waiting to happen.
In 2005, this sadly came true, when the powerful hurricane Katrina came ashore near New Orleans. Almost 1400 people lost their lives, damages exceeded $100 billion (that is more than $300 for each person in the USA), more than a million people were displaced from their homes (and more than half a million were still displaced a month later, often because their homes were gone). Where natural wetlands should have slowed the waves from Hurricane Katrina (which was not a really huge storm by the time it got to New Orleans!), the high waters of the storm surge roared almost unimpeded from the Gulf. Parts of the levees failed. The pumps failed. The city filled with water, as much as 20 feet deep.
A slideshow of the aftermath of Katrina
But the city has been (mostly) rebuilt where it was, the sinking will continue, the loss of wetlands will continue unless many things are changed, and the levees that have already been raised will need to be raised more. With the likelihood that the strongest storms will get stronger and sea level will rise in the future (we’ll revisit this later in the semester), the scene will be set for an even more horrific disaster at some future date. Many options are available, including restoring wetlands, filling parts of the city with debris or other materials, moving construction to higher parts of the city, moving out entirely, and more; it will be interesting to see how much of this will be done. But primarily, the donations and tax dollars from the rest of the country after the 2005 disaster were used to rebuild the city directly in harm’s way, with the knowledge that the rest of the country will once again foot the bill when disaster strikes.
Another story is being played out in this region as well. The river wants to leave New Orleans. The city has a love-hate relationship with the river, fearing the floods but needing the drinking water and the shipping channel. The river can harm the city rapidly by flooding, or slowly by leaving.
To understand this tendency of the river to leave New Orleans, note that especially large, muddy, flood-prone rivers normally have natural levees (which are much lower than the human-made ones). When a flood happens, the water spreads out of the main channel onto the flood plain, which is the flattish region of river-deposited mud next to the main channel. As the water spreads out into the trees or houses of the flood plain, the flow of the water slows, and the water drops some of its muddy load. Although some mud is deposited wherever the floodwaters flow, more of the sediment is deposited very near the river where the water first slows. Hence, the mud layer from a flood is thicker next to the river than farther away, forming a natural levee. Humans have raised these natural levees in many places.

When we discussed reservoirs, we saw that the delta of sediment formed when a river enters a lake must build up as well as out, so that the river still flows downhill into the lake. The same is true for a river entering an ocean. The Mississippi River, with its levees, naturally dumps mud into the Gulf of Mexico, slowly building out and up, lengthening and raising the riverbed. After a while, the river is a bit like a log flume in an amusement park, following a long path to the Gulf; a break in the levee wall would allow a much steeper, shorter, and more exciting downhill trip. The recent history of the Mississippi Delta is that, roughly every 1,500 years, the main outlet of the river has broken through the natural levee, like a log full of park-goers breaking through a curve in the ride, and the river has then followed that new shortcut. But, as mud is deposited along that new shortcut, it builds out and up, lengthening until it is like a long log flume, and then the river breaks through its side again, someplace else. This break-build-break-build helps create the classic shape of a delta.
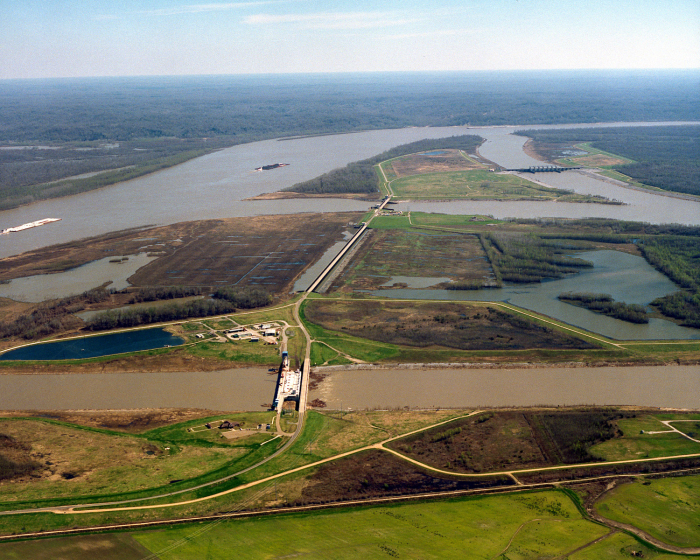
During the 1940s and 1950s, the Mississippi started to break out, into a side stream called the Atchafalaya River. To save the shipping channel and the water supply for New Orleans, the Army Corps of Engineers has used levees and dams, especially the Old River Control Structure, to allow some water to go down the Atchafalaya while keeping a vigorous flow in the main log-flume channel past New Orleans. During a flood in 1973, the Corps very nearly lost the Control Structure, and the river, when a giant whirlpool undercutting the dam came close to causing it to collapse. The task of the Corps is very difficult, taming immense natural forces as the system becomes more and more out of balance.
Video: How New Orleans Doesn't Work (2min, 26sec)
Here's a great tree. And the great tree is standing up on a bluff looking down on the Mississippi River, which sits down in a valley. And the river has a little natural levee-- this, we haven't gotten to human built ones yet-- and it sits down in a valley.
And then, over on the other side, there's another natural levee, and then you go up another bluff to the top. And the river itself sits down in its river valley like this. And it is flowing towards you, which is what the head of this arrow shows.
And the river is sitting on a few miles thickness of mud that have accumulated over the years as the delta has built out into the Gulf of Mexico. And whenever you get a few miles of mud, everything is sinking under its own weight. And that, in turn, means that the surface is sinking, as well.
Now, nature has a way of handling this surface sinking problem, which is that during a big flood, the water spreads out over the flood plain. And mud falls out of the water, and the mud makes a new layer. And so as the surface sinks, more mud is added. And so there's no net change in the elevation. And that's just fine, except for one little problem.
Over here you have a city. And you've built this big city. And you really don't want that flood coming into your city. So you just call up the Corps of Engineers and you say, make a big wall, and make sure that that flood is not going to get into my city.
Well that's just fine, except that doesn't stop the sinking, because the thing is going down. And so if you come back later, what you'll find is that the surface has moved down to a place like this, and your city has moved down to a place like this. I'm using a darker line so you can see where it's gone to from where it was.
And so you tell them to make the wall bigger. But meanwhile, the city is sinking even deeper. And you've gotten up somewhere way down here, now.
And things are getting really nasty, because at this point, there's a really big storm. And it manages to get just over the top, and it fills your city with water. And then you're underwater and you're very, very unhappy. And this happened to New Orleans. And the sinking is not stoppable, so if it's rebuilt, it is likely that it will happen again.
An excellent account of this is given in John McPhee’s book The Control of Nature, 1989, Farrar, Straus and Giroux, New York, which may be a little out of date but is still fascinating, and shows that policy-makers and others were warned about the dangers in the area long before the disaster of the 2005 hurricane.
Mammoth Cave
Mammoth Cave
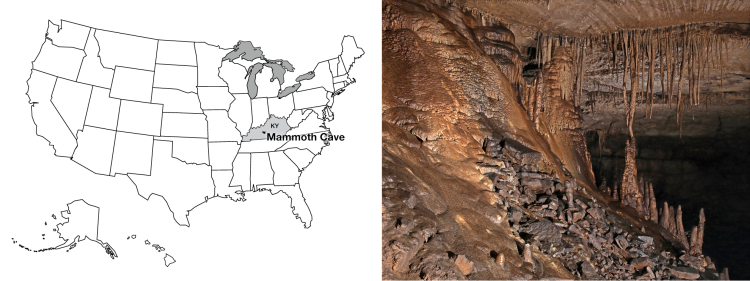
Right, Violet City. Jackie Wheet, National Park Service (NPS) (Public Domain).
Near the start of this Module, we discussed how rainwater soaks into the ground and moves toward rivers through spaces in the rocks. This process is always important, but it usually is not very dramatic. Occasionally, though, it makes spectacular features worthy of being national parks… caves. The cave with the greatest total known length of passages is Mammoth Cave, deep beneath the rolling hills of Kentucky. Mammoth Cave has more than 425 miles of surveyed passageways (almost 700 km), and the Park Service estimates that there may be 600 more miles to be mapped (almost 1000 km). And, Mammoth Cave National Park includes more than 200 other smaller caves that are not known to connect with the big cave.
Mammoth Cave has been used by Native Americans for at least 5000 years. After European settlement, the cave was mined for saltpeter (containing nitrates) for use in gunpowder, especially during the war of 1812. The source was bat guano (the polite name for it) deposited over the ages by great flocks of bats. There are over 1000 archaeological sites in the cave.
Take a tour of Mammoth Cave
Want to see more?
Here is another optional vTrip you might also want to explore! (No, it won't be on the quiz!)
Mammoth Cave National Park
(Provided by USGS)
Forming caves, cave formations, and their surroundings
Forming caves, cave formations, and their surroundings
Caves typically are found in special landscapes, usually called “karst”, that have certain special features. These karst landscapes give us beautiful parks, but cause major challenges for construction and drinking water.
Dissolving a cave
Mammoth Cave and its surrounding karst landscape, like the great majority of large caves, was dissolved in a rock type called limestone. The limestone was deposited in shallow seas during the Paleozoic Era (a few hundred million years ago), and comes from shells and other materials deposited by sea creatures. Mammoth Cave is so big in part because the limestone lies beneath a strong sandstone layer from old beaches, which provides a “roof” that does not collapse easily as the cave is dissolved into the limestone.
As we saw in discussing rock weathering to make muds for the Badlands back in Module 5, rainwater and soil water are weak acids. Chemically, the calcium carbonate that makes up the limestone is especially prone to attack by acid. (In fact, the usual test for limestone is to drip a little weak hydrochloric acid on a sample; limestone fizzes vigorously as the rock decomposes to free carbon dioxide gas, but most other rocks react much more slowly and do not fizz.) Where soil waters move through limestone, the rock dissolves and washes away. You wouldn’t see much change from year to year while a cave is forming, but the rock dissolves very rapidly compared to many geologic processes.
Not all limestones make big caves when they dissolve. If the limestone has lots and lots of cracks, the water may spread out into so many different paths through those cracks that not enough rock dissolves along any one crack to make a cave. But if the limestone has just a few cracks for water to flow through, all of the dissolution will be concentrated in those few places, and cave passageways may form. Caves usually form while filled with water, but nearby rivers then may cut downward, draining water from surrounding rocks and lowering the water table, as Kentucky’s Green River has done near Mammoth Cave. This can empty the water from all or part of a cave, letting it fill with air.
Forming cave formations
The beautiful stalaCtites (from the Ceiling), stalaGmites (on the Ground), and other cave formations that tourists love to see in caves can then develop. You might be surprised that nature first hollows out the cave and then starts to fill the cave again, but this really does make sense.
Many processes in soil, such as dead things decomposing and worms exhaling, release carbon dioxide, and some of that carbon dioxide is picked up by rainwater as it soaks in and becomes groundwater. Thus, groundwater is more effective than rainwater at dissolving limestone. Occasionally, a cave may be so isolated from the surface that dangerous levels of carbon dioxide build up in the cave’s air, but caves usually exchange enough air with the outside world to have near-normal levels of carbon dioxide so that you can go into them safely (presuming you have lights and warm clothing and watch out for floods and don’t fall into giant pits...).
When groundwater drips into such an air-filled cave that has a near-normal carbon-dioxide level, the groundwater loses some of its extra carbon dioxide to the air. The water then cannot hold all of the limestone it has dissolved, and some of that limestone is deposited to form the beautiful stone features we see.
Forming other karst features
Almost all rocks have cracks, called joints. The next time you can safely examine a cliff or road cut, you should be able to see these joints. They occur in many orientations, but some are generally near-vertical, often in intersecting sets as shown in the picture.
The rocks in the picture are not limestone, but limestones have similar joints, and where water soaks downward along intersecting cracks in limestone, the rock is often dissolved, leaving space that may make a low spot in the surface, or may partially or completely fill with mud. Such a hole, whether mud-filled or air-filled, is called a sinkhole. Sinkholes also form when the roof of a cave collapses, leaving a low spot in the surface. Somewhat confusingly, when a pipe breaks beneath a city street and a road falls into the space, people also call that a sinkhole. For this course, we will focus on the sinkholes that are especially formed by dissolution of limestone, and leave the collapsing sewer pipes in cities for a different course.

Sinkholes formed by downgoing waters are very common near Penn State’s University Park campus. The Geosciences Department is housed in the Deike Building, which required extra funding for special strengthening because the building has sinkholes beneath—a building can rest firmly on bedrock, but tends to fall into air-filled or mud-filled holes. Extra funds were similarly expended to strengthen the nearby Mt. Nittany Middle School, the runway extension at the airport, and other construction projects in the area. A newly constructed storm-water catch basin at the airport filled with water during its first big rainstorm, and the weight of the water blasted mud out of a buried cave passageway somewhere beneath, suddenly clogging nearby Spring Creek with trout-choking red mud.
Where sinkholes and caves are common, streams often disappear underground into swallow holes, only to re-emerge at springs. Spring Creek is aptly named—it is fed by a lot of Springs!—and many other similar features occur around central Pennsylvania, around Mammoth Cave, and in other such regions.

Corn cobs once were dumped in a sinkhole behind a cannery at Old Fort east of Penn State’s University Park campus, and after a rain would pop out of a spring in Spring Mills, a few miles away. A stream flowing off nearby Mount Nittany goes down a swallow hole in the town of Pleasant Gap and then comes back out in a spring a mile or so away… and once, a basketball that had washed down the swallow hole came out in the spring! Regions with sinkholes, caves, springs, swallow holes, etc., are referred to as karst, after a region in Slovenia with many such features. Karst features are present across 20% of the Earth’s surface, and roughly 40% of the US population obtain at least some of their drinking water from karst, according to the National Park Service.
In the past, people often threw trash into sinkholes. Big pieces would sink into the mud or fall into cave passages beneath, “disappearing.” When Dr. Alley was in high school and went to Sloan’s Valley, Kentucky to go wild caving (spelunking), one of the cave entrances was known as the Garbage Pit, which led into the Tetanus Tunnel. A commercial cave near Mammoth Cave was forced to close in the 1940s because of the stench from sewage draining in.
Slowly, we are learning just how stupid it is to dump things in sinkholes. A test conducted by the great Penn State hydrogeologist Richard Parizek during the building of the Nittany Mall east of Penn State’s University Park campus showed that a little harmless dye dumped in a sinkhole near the mall came out in a nearby trout stream in a day or two. It should be evident that anything else dumped in a sinkhole near the Nittany Mall (or many, many other sinkholes in the region and in other karst regions) would show up very quickly in the water used by people and wildlife.
Dr. Alley lives in a house served by a local water company well-known for its fine water from deep wells (with locations that were identified by Penn Staters Richard and Byron Parizek). But many years ago, before a reorganization of the water company and before the help from the Penn Staters, the intestinal parasite Giardia showed up in the local well water. Giardia causes intense and possibly dangerous stomach problems. Giardia usually is restricted to surface water; the spaces in most rocks are small enough to filter out the Giardia cysts before they reach a water well, or the water takes so long to go from the surface to the well through the small spaces that the cysts die of old age on the way. At the long-ago community meeting to discuss the water contamination, company officials noted that they had installed well filters to remove sticks, leaves, etc., that came out of the wells with the water. In karst country, surface water can become groundwater and return to the surface in hours or days. Whole streams go down and up, and if sticks can go through, microscopic cysts can, too. Clearly, contaminants dumped somewhere today can be poisoning someone tomorrow.
In some other regions, the groundwater-contamination problems are quite different. In sandstones, for example, the water moves slowly, pore-by-pore, through the rocks. In some places, the water can be shown to have first entered the ground during the ice age, more than 20,000 years ago, or even earlier. Contaminants dumped in such rocks may not bother people for a while. But, when the contaminants do start to bother people, clean-up can be very difficult.
Try this experiment. Squirt a little food coloring dye on a sponge, and squeeze the sponge a few times to distribute the dye well. The sponge is our rock, and the dye is the contaminant. Now, wet the sponge, hold it up, and squeeze it. Colored water will come out. Wet the sponge again, squeeze it again, and more dye comes out. Repeat, and repeat, and repeat. You may need ten or more times to remove enough dye that you no longer see it, and sensitive instruments would detect the dye through dozens or even hundreds of additional washings. Now, suppose that instead of edible food-coloring dye we had used a chemical that causes cancer in humans. If the water in the rocks naturally is hundreds or thousands or more years old, then nature takes a long time to wash out the rocks once, and washing them out ten or one hundred times will take much longer than all of human history.
There are things that can be done about groundwater pollution. You can pump clean water in and dirty water out to speed up the washing, or pump steam or hot water in and out to wash even faster (and then try to figure out how to clean the dirty water or steam once you have them back on the surface). People are experimenting with installing filters so that polluted water will flow through them, sometimes using large masses of iron filings to react with and break down some organic chemicals in groundwater. Geomicrobiologists are searching in heavily polluted sites for microbes that “like” to eat pollutants, and then trying to introduce those microorganisms into other polluted sites to break down harmful chemicals, while other biologists are trying to design pollutant-eating microbes. But, such techniques usually are very expensive and not very effective. Most people who have thought about it agree very strongly that the best way to handle groundwater pollution is to keep the chemicals out of the ground in the first place. A whole lot of money has been spent on clean-up because we did not learn that lesson soon enough—and there are days when it appears that we have not yet learned that lesson.
Optional Enrichment Articles and Videos
Optional Enrichment Articles and Videos
Incised Meanders and Geologic History
Canyonlands poses a special puzzle. The rivers in Canyonlands meander, making big, sweeping curves through the red rocks. Earlier in this module, we discussed how meandering rivers typically occur in flat, lowland regions lacking supply of big rocks to the river. This is decidedly not the situation in Canyonlands. The rivers are somewhat steep, and in places (although not just where the picture below was taken) are laden with rapids, challenging for whitewater rafters. Landslides and rockfalls from the canyon walls deliver large blocks to the streams.

The likely story is that the streams once meandered across nearly flat lowlands. Then, uplift of the rocks began, raising the Earth’s surface to a higher elevation in what is now the US West, giving the streams a steeper slope to the sea and so speeding their flow and causing them to erode. But, the uplift was gradual enough that the streams held their old courses. The streams cut downward without a change in pattern, which is called incision. Canyonlands contains clear examples of incised meanders. Similar features are preserved throughout the Colorado Plateau, documenting widespread uplift of the Plateau. The Goosenecks of the San Juan River, shown below, are also beautiful incised meanders.

Much of geology involves study such as this; the history of a region produced the modern features. One can often learn much about that history by understanding the modern features and how they were formed. Clearly, if we did not know what conditions produce meandering streams today, we would not know what conditions likely occurred in the past when the meandering streams developed. The geological saying that captures this idea is “The present is the key to the past.”
More About Sinking Mud
Down at the Mississippi Delta, we saw that the mud under New Orleans is compacting under its own weight, contributing to sinking of the city. A couple of other things also contribute to the sinking.
As the delta grows, the weight of the mud pushes down the rock beneath, with soft, hot rock much farther below flowing away laterally, like air flowing out from beneath you if you sit on an air mattress. The sinking of the Earth under the weight of more mud can take thousands of years. And, just as the strength of the air-mattress cover spreads the dimple around you when you sit down, a fairly large region around the delta is pushed down by the weight of the delta. So, adding some mud anywhere near New Orleans causes a little sinking in New Orleans for a while.
Perhaps more importantly, as we saw with mass movements at the Grand Tetons (and as you can see in the picture of Canyonlands just above, by the cliff on the inside of the meander), rocks tend to fall off steep slopes. Sometimes a single rock falls, or a thin layer of rocks slides. Other times, large thicknesses of material move. The Mississippi Delta is a giant pile of mud towering above the deep waters of the Gulf of Mexico, and that “cliff” is subject to downward motion of its materials. Some of this occurs along faults that are something like pull-apart Death-Valley-type faults—the fault intersects the Earth’s surface well inland, sloping down toward the Gulf, and the mud on top slides down and toward the Gulf.
After Hurricane Katrina devastated New Orleans, geologists renewed their efforts to understand what is going on geologically—such understanding should help in planning how to slow down the next disaster. An argument has erupted about the relative importance of the various reasons for sinking in and near New Orleans, with faulting probably more important (and mud compaction less important) than previously believed, and with sinking of the rock beneath the delta small but not zero. All of these are almost certainly contributing, but with a little work remaining to figure out just how much to blame on each one. Naturally, all of them contributed to lowering of the surface, and sediment deposited from the river's floods filled that space—the river doesn't really care why the surface dropped, and deposits sediment in low places formed by any process.
Video: Erosion at Bryce Canyon National Park (1:04 minutes)
We can measure the uplift of mountains, which may occur slowly, or suddenly in earthquakes, and we can watch volcanoes erupt. But overall, nature tears down mountains about as rapidly as they form, and we can watch and measure the tearing-down, too. The slow disappearance of names from old tombstones, the hubcap-rattling holes in late-winter city streets, and the maintenance budget for university buildings all attest to the effects of nature on human-made things. Here, Dave Witmer takes you to Bryce Canyon, one of the many, many places where you can see nature removing natural things.
Hi, I'm standing here up at the top of Bryce Canyon. And right over here we have a great example of how quickly erosion takes place here. As you can see, the roots of this tree are exposed. And this tree is only about 100 years old, but it looks like it's trying to jump out of the ground. And that's because of the ground that was up here has been washed down the canyon exposing the tree's roots. Luckily for this tree, the roots go very deep into the ground to get all the moisture it can. And that's why it's still able to surviv.
Video: Chain of Events / Zion National Park (1:18 minutes)
Geologists observe the wear-and-tear of nature on human-made and natural things, gaining clues to help understand how mountains are torn down. When climbing the sheer cliffs of Zion National Park into the mysterious crevice of Hidden Canyon, the intrepid hiker clings to a rather precarious-looking chain to avoid falling into the stream-carved potholes just beside the trail, and on down to the Virgin River, in the Canyon a hair-raising drop below. In these two clips, Dave Witmer and Dr. Anandakrishnan show how rocks are worn away, a little at a time, and what this has to do with south-Indian cuisine. You might begin thinking about what this wearing-away of rocks has to do with the Virgin River in the Canyon far below.
Student: Hey Sridhar, look here.
Sridhar: What's going on there?
Student: The chain that we are using to climb up the hillside here in Zion is actually causing some mechanical weathering. And you can see how everybody that grabs on to the chain as it goes up--
Shridhar: Ah, cool. Check it out.
Student: It carves into here. It actually carves into the sandstone.
Shridhar: It's made these little scallop marks where the chains that are turned in this way go in a little bit deeper. And the chains that are out that way are back a little bit farther.
Student: Yep. It would be just like a rock in a stream or even a glacier pushing stuff along. It's just scooping things up at a constant pressure along the side of the rock.
Shridhar: And so this stuff is actually fairly friable. It breaks apart reasonably easily. This chain's probably only been here 10, 15 years. And already it's cut in, what 1/25 of an inch, an 1/8 of an inch, something like that.
Video: Pothole Grinding / Zion National Park (1:27 minutes)
[MUSIC PLAYING]
So the water came along this way and carved out those holes coming around the bend. And then as it started to make the corner, it came down and it swirled around in these big holes. Probably, you can even see down there, there's some pebbles stuck in there and gravel size bits. And in a big flood, it would carry those size rocks and larger, bring them down.
And it's just like my grandmother grinding rice to make dosas and idlis which are these magnificent South Indian dishes, where you take rice, you put them down in a mortar and a pestle, and you just grind them around, add a little bit of water, grind them around. And you get this wonderful flour that comes out of it. That's the exact same thing happening here.
The water comes pounding down, carrying rocks, and it swirls them around because it's making the turn. And it's going fast enough that as it makes a turn it can't just go straight, it's got to curve around. It's just beautiful, it's magnificent. And we can even see some of the rocks left down in there from the last time we have a flood coming through here.
Module 6 Wrap-Up
Module 6 Wrap-Up
Review Module Requirements
You have reached the end of Module 6! Double-check the list of requirements on the Welcome to Module 6 page and the Course Calendar to be sure you have completed all the activities required for this module.
Reminder
Continue to work on Exercise #3. See Course Calendar for specific due dates.
Comments or Questions?
If you have any questions, send an email via Canvas, to ALL the Teachers and TAs. To do this, add each teacher individually in the “To” line of your email. By adding all the teachers, the TAs will be included. Failure to email ALL the teachers may result in a delayed or missed response. For detailed directions on how to do this, see How to send an email in GEOSC 10 in the Important Information module.
Module 7: Glaciers, Ice, and Permafrost
Welcome to Module 7
Welcome to Module 7
Glaciers, Ice, and Permafrost—Yosemite, Glacier, and Bear Meadows

Although not quite as large as minivans, musk oxen have better cornering and can surely accelerate rapidly. This picture shows musk oxen thundering across the tundra of east Greenland. If you had been in central Pennsylvania's Bear Meadows with a camera 20,000 years ago, you might have taken this picture--tundra and musk oxen very similar to these existed in Pennsylvania and adjacent states back then, while an ice sheet even bigger than modern Greenland's loomed just to the north. How do we know that the ice came and went, and what caused the changes? Look both ways for musk oxen or minivans, depending on where and when you are, and let's go see.
When we try to pick out anything by itself, we find it hitched to everything else in the Universe.
— John Muir, My First Summer in the Sierra, 1911, p. 110
Learning Objectives
- Recognize that glaciers behave in predictable ways because of physical processes that are shared with other materials, including pancake batter spreading on a waffle iron.
- Understand how glaciers uniquely make certain features that are found today in many places without glaciers, suggesting that ice ages with larger glaciers occurred in the past.
- Discuss how this ice-age hypothesis leads to many predictions that have been tested and found to be correct, giving very strong confidence that ice ages did occur, and helping us understand how and why the ice ages occurred.
What to do for Module 7?
You will have one week to complete Module 7. See the course calendar for specific due dates.
- Take the RockOn #7 Quiz
- Take the StudentsSpeak #8 Survey
- Submit Exercise #3
- Begin working on Exercise #4
Questions?
If you have any questions, send an email via Canvas, to ALL the Teachers and TAs. To do this, add each teacher individually in the “To” line of your email. By adding all the teachers, the TAs will be included. Failure to email ALL the teachers may result in a delayed or missed response. For detailed directions on how to do this, see How to send an email in GEOSC 10 in the Important Information module.
This course is offered as part of the Repository of Open and Affordable Materials at Penn State. You are welcome to use and reuse materials that appear on this site (other than those copyrighted by others) subject to the licensing agreement linked to the bottom of this and every page. Students registered for this Penn State course gain access to assignments and instructor feedback and earn academic credit. Information about registering for this course is available from the Office of the University Registrar.
Main Topics: Module 7
Main Topics: Module 7
Overview of the main topics you will encounter in Module 7.
Ice Is Nice: Yosemite, Glacier, and Rocky Mountain National Parks, Bear Meadows, and Greenland
- All piles tend to spread under their weight.
- A glacier is a pile of ice and snow that forms where snowfall exceeds melting long enough to make a pile that is big enough to spread under its own weight.
- A glacier takes water (as ice) and sediment from the accumulation zone (where snow accumulates faster than it melts) to the ablation zone (where melting, also called ablation, exceeds snow accumulation) or to calve icebergs that float away in surrounding oceans or lakes to melt elsewhere.
- A glacier flows in the downhill direction of its upper surface (where ice meets air), even if that means the bottom flows uphill like pancake batter spreading across the bumps on a waffle iron.
Which Way Did It Flow?
- A glacier moves by deformation within the ice, and if the bed is warmed to the melting point, by sliding over the glacier's bed or deforming the sediment there.
- Most deformation in the ice of a glacier happens near the bottom where stresses are highest, but the top of a glacier moves fastest because it rides along on the deeper layers.
- The ice of a glacier deforms under stress because the ice is almost hot enough to melt, even though the ice feels cold to us.
Glacier Tracks
- Glaciers erode by plucking rocks loose, sand-papering (abrading) the bed, and through the actions of subglacial streams that occur beneath some glaciers.
- Glaciers with thawed beds, especially those with surface meltwater reaching the bed, change the landscape more rapidly than is typical for landscapes shaped by non-glacial streams, wind, or mass movement.
- Abrasion (sandpapering) under ice makes striae (scratches) and polishes rock.
- Abrasion smooths the up-glacier sides of bedrock bumps, while the glacier plucks blocks loose from the down-glacier sides of bumps.
- Glaciers erode valleys to give them “U”-shaped cross-sections, often with the floors of side valleys flowing into the main valley left "hanging" above the floor of the main valley; streams make “V”-shaped valleys without hanging valleys.
- Glaciers gnaw bowls called cirques into mountains.
- Glaciers deposit till, which contains rock pieces of all different sizes.
- Melting glacier ice also feeds streams that deposit outwash (because it is washed out of the glacier); the pieces in outwash are sorted by size (mostly sand in some places and mostly gravel in other places). Till and outwash often form ridges called moraines that outline the glacier.
Evidence of Ice Ages
- Some of the features that glaciers erode and deposit are not produced in other ways, and such features from a time interval centered on roughly 20,000 years ago are observed now across broad areas of the Earth where glaciers do not now occur, suggesting that we have had an ice age or ice ages in the past.
- This hypothesis of past ice ages has led to many predictions that were then confirmed, including that the land now should be rising where the ice was, and sinking just beyond where the ice was, and that the return of water to the oceans as the ice melted would have flooded old river valleys and killed shallow-water corals on the sides of islands.
- The success of the ice-age hypothesis in predicting things that have since been observed, and the failure of other hypotheses to do so, give us high confidence that ice ages did occur.
How Many Ages of Ice? An Ocean of Clues
- The history of ice ages is clearer in ocean sediments than on land, especially in the isotopic composition of shells buried in mud on the sea floor.
- Isotopically lighter water evaporates more easily.
- An ice sheet is formed from water that evaporated, mainly from the ocean, and then snowed, so during an ice age the water remaining in the ocean is isotopically heavier than observed today, causing shells that grew then to be isotopically heavier.
- The history of the isotopic composition of shells recovered from cores of mud from the ocean floor shows that the ice grew and shrank, with the biggest ice every 100,000 years, and smaller wiggles in ice size about 41,000 and 19,000 years apart.
- These timings were predicted by the scientist Milankovitch decades before they were observed because they are the timings of features in Earth's orbit that control the distribution of sunshine on the planet.
- Ice has grown globally when the far north was getting relatively little sunshine, especially in midsummer.
- The rest of the world has cooled when ice grew in the north, even though parts of the world were getting extra sunshine, and the world has warmed when the ice melted in the north, even when some places were getting less sunshine.
- This seemingly bizarre behavior occurred because the changing ice and other features of the climate changed atmospheric CO2, which rose when the ice melted and fell when ice grew, and the CO2 controlled global temperatures.
Bear Meadows
- Ice sheets today cover about 10% of the land area; at the height of the ice age the ice sheets covered about 30% of modern land; central PA was just beyond the edge of ice that grew in Canada and flowed into the USA.
- The high parts of Rocky Mountain National Park and the coastal parts of the NE Greenland National Parks are among the places that have permafrost today—soil at some depth is frozen year-round.
- Rocks in permafrost regions are especially affected by freeze-thaw processes that break rocks, and by downhill soil creep (during the summer, the meltwater can't drain downward through the frozen soil beneath, so the soil gets very soggy and creeps easily).
- These characteristics of permafrost regions contribute to the formation of distinctive features, which are observed in places such as central Pennsylvania that were just south of the ice-age ice sheets but which are not forming there today.
- This shows that central Pennsylvania, and other such regions just south of the ice-age ice sheets, were very cold during the ice age.
Yosemite
Yosemite
What Glaciers Do, Erosion and Yosemite

When your tour guide, Dr. Alley, was much younger (the year he graduated from high school, 1976), he traveled with his sister Sharon and cousin Chuck on a camping tour of the great national parks of the American West (in Chuck’s car, a 1962 Ford Galaxy 500). At Yosemite, they hiked the 10-mile round trip to Glacier Point, climbing almost 1 km (0.6 miles) in elevation. The trail switch-backs up the granite cliffs, opening increasingly spectacular panoramas across the great valley of the Merced River. The view from Glacier Point, across the side of Half Dome and the thundering Vernal and Nevada Falls, is truly spectacular. It was here that John Muir helped convince President Theodore Roosevelt of the need for a National Park Service to care for the National Parks, which were protected by law but not by rangers for some decades after the parks were established.
The hikers were a bit disheartened by the crowd at Glacier Point—the view is also accessible by Glacier Point Road. While they sat and lunched, a tour bus pulled in. Most of the passengers headed for the gift shop, but three settled at a picnic table while a fourth strolled over to the railing to see the scenery for a few moments before joining the others at the picnic table. One of the three asked, “Anything out there?” To which the ‘energetic’ fourth replied “Nah, just a bunch of rocks. Let’s go check out the gift shop.” It must be a sad person indeed who would not walk 50 feet to see the glory of Yosemite.
To anyone with open eyes, Yosemite Valley—the “Incomparable Valley”—is well worth inspection. It is carved into the granites and similar rocks of the high Sierra Nevada of California. Once, this granite was magma (melted rock below the surface), far beneath an earlier mountain range. The magma may have fed subduction-zone volcanoes much like those of the Cascades, which continue to the north of the Sierra. However, stratovolcanoes along this part of California have died as the East Pacific Rise spreading center ran into the trench along the west coast, forming the San Andreas Fault but ending subduction, as you learned earlier in the course. Such a fate eventually awaits the Cascades volcanoes, some millions of years in the future.
The Sierra Nevada was raised above Death Valley and the rest of the Great Basin by motion across great faults. Earthquakes that continue to occur, and breaks in recent sediments caused by earthquake faults, show that the mountain range is still being lifted above the still-dropping Great Basin.
The tough granite of the Sierra Nevada is more resistant to weathering and erosion than most rocks, however, granite does eventually break down, and some streams have managed to exploit weaknesses and cut deep channels through the range. These streams include the Tuolumne River, which carved the mighty Hetch Hetchy Valley, now dammed so that a valley that rivals Yosemite is lost underwater. The Merced River, which runs through Yosemite Valley, also cut into the range.
The stage was then set for the ice ages. Glaciers gathered on the high peaks, flowed into the valleys, and began to change the landscape. Later in the course, we will briefly discuss why the climate changed naturally to bring the ice ages, and why knowledge of these natural changes fully confirms our scientific understanding that human fossil-fuel burning is warming the climate today. For now, we’ll look at what a glacier is, what it does, and how we know glaciers were much more widespread during the ice ages than they are today.
Take a Tour of Yosemite National Park
Which Way Did It Flow?
Which Way Did It Flow?
Richard has some nice slides of Cindy making pancakes and he hopes to add a narrated version of them to this page.
A glacier is a mass of snow or ice that deforms and moves. Glaciers form wherever snowfall exceeds melting over enough years to make a pile big enough to flow. In places with extremely high snowfall, this can occur where average temperatures are near or even slightly above freezing, such as on the mountains of the Olympic Peninsula. In dry places, glaciers may be absent even if average temperatures are well below freezing. Such places have frozen ground instead, called permafrost (because the frost is permanent).
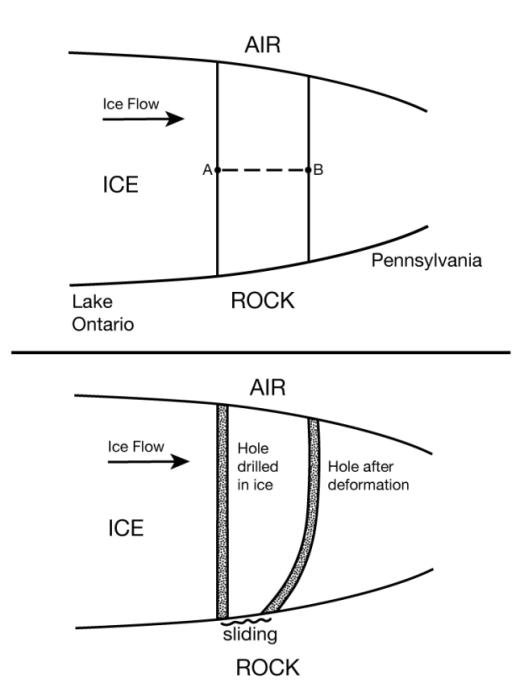
A glacier is a mass of snow or ice that deforms and moves. Glaciers form wherever snowfall exceeds melting over enough years to make a pile big enough to flow. In places with extremely high snowfall, this can occur where average temperatures are near or even slightly above freezing, such as on the mountains of the Olympic Peninsula. In places with very little precipitation, glaciers may be absent even if average temperatures are well below freezing. Such places have frozen ground instead, called permafrost (because the frost is permanent). We will spend a little while looking at how glaciers flow, in part because glaciers are important, and in part, because they reveal processes that are important in many other settings—pancakes, landslides, swimming pools, huge cathedrals, and glaciers, and many other things have some behaviors in common.
If you pour water onto a tabletop to make a pile, the water will spread out across the table and eventually drip off onto the floor. Pour pancake batter onto a griddle, and the pile will spread, although the spreading will be slower and the pile will be thicker than for water. All piles tend to spread under their own weight, because the pressure at the bottom of the pile is higher than the pressure outside the pile, giving a net push outward. Spreading may be avoided if the pile is strong enough—a hot griddle cooks the pancake batter, making it stronger and stopping the spreading. Most buildings are strong enough to resist spreading, too. However, builders of early cathedrals faced the problem that the roofs tended to cave in as the walls bulged out because the “pile” of the cathedral was spreading, requiring the invention of flying buttresses to support the walls and prevent pile-spreading collapses.
The diagram illustrates the spreading of a pile, with water or ice or pancake batter moving away from where the upper surface is highest. This occurs because the pressure at point A (the weight of the material above point A) is larger than at point B because there is more ice above A than above B. The higher pressure at A gives a net push from A to B. Thicker or steeper piles give larger pushes, and tend to spread faster. Typically for glaciers, ice thicker than about 50 m (150 feet) will deform and flow fast enough to be easily measured, making a glacier.
If you make a pile of pancake batter on a waffle iron, rather than on a flat griddle, some of the batter may flow along the low grooves and then move up to cover the bumps, but the flow will still move away from the place where the upper surface of the pile is highest. In the same way, ice can flow up a hill in the bedrock if the flow is going in the “down” direction of the upper surface. (If you want more detail on this, just for fun or some other class, we recommend the text The Physics of Glaciers, by brilliant Penn State grad Kurt Cuffey, which is available at the Penn State library and in many other libraries) For example, farmers in northeastern Pennsylvania grow food in soils made of pieces that were brought across Lake Ontario and New York by the glaciers. The bottom of that glacier climbed out of the low spot that now is the lake basin, driven by the upper surface of the ice sloping down from Canada to the U.S.
If you have ever slipped on the ice, you know how slippery ice can be, and you won’t be surprised by the second part of the figure. Where glaciers are thawed at the bottom, they generally slide over the rocks or soil beneath (shown in the figure), and if the material is loose soil, it often deforms in a sort of slow landslide that lets the glacier go even faster. And, all glaciers deform internally, like your slow pancake batter spreading on the griddle. A vertical hole drilled in a glacier will deform as shown in the figure. The stresses are the largest, causing the most intense deformation (the permanent bending of the hole shown in the figure), in the deepest ice. The upper ice rides along on the deeper ice, so the velocity is the fastest at the top of the ice.
Recall that rivers adjust to move sediment and water from one place to another. So do glaciers. Frozen water is supplied where snowfall exceeds melting in the accumulation zone. The frozen water flows to where melting exceeds snowfall, called the ablation zone, or else flows to where icebergs break off (called calving) and drift away to melt elsewhere. For ice sheets covering continents or for smaller ice caps covering plateaus or mountain tops, the ice forms a dome and spreads out in all directions. For glaciers on the sides of mountains, the ice flows down the mountain.
When melting decreases or snowfall increases, a glacier generally thickens and advances—its terminus, where it ends on land or calves icebergs, moves over land or water that did not have ice before. When melting increases or snowfall decreases, the terminus retreats and the glacier gets smaller. Notice that ice almost always continues flowing in the same direction, from the accumulation zone through the ablation zone to the terminus, whether the glacier is advancing or retreating.
Some people find it strange that we can walk on glaciers (being careful not to fall into crevasses!) and even land airplanes on glaciers—which clearly are solid—yet the glaciers flow. We have met something similar before, though. Like the soft rock of the asthenosphere down in the mantle, or the soft chocolate bar in a hot pocket, or the red-hot horseshoe in the blacksmith’s shop, ice in all glaciers on Earth is nearly warm enough to melt, and so can flow slowly. As a general rule, materials heated more than halfway from the coldest possible temperature - absolute zero - to their melting point can flow slowly, and flow becomes easier as the temperature increases closer to the melting point. For ice, the coldest yearly average temperature on Earth is about eight-tenths of the way from absolute zero to the melting point, so ice at the Earth’s surface is always “hot” and can flow. For more on this, and on the occurrence of crevasses as well as flow, see the Enrichment.
Glacier Tracks
Glacier Tracks
A glacier frozen to the rock beneath does not erode much. However, thawed-bed glaciers, especially those with surface meltwater streams draining to their beds through holes (something like cave passages, although formed in different ways), can erode even more rapidly than streams or wind erode, creating features made only by glaciers. Consider for a moment the Great Lakes of the U.S. and Canada - these lakes were carved by glaciers. The bedrock beneath Lakes Superior and Michigan is well below sea level, and was carved by glaciers, not rivers! Today, rivers carry sediment into the Great Lakes, slowly filling them up. We will see later that over the last million years, times when the glaciers were eroding have alternated with times when streams were filling the lakes back up with sediment, and the streams have had more filling-up time than the glaciers had eroding time. And yet, there are the lakes, not the least bit full of sediment. The glaciers have been much better at their “job” than the streams. The same can be said for many other places. It is not too extreme to say that the regions that had glaciers 20,000 years ago and are free of ice today still preserve a glacial landscape.
Ice moving over bedrock “plucks” smaller rocks free, then uses those rocks to abrade or “sandpaper” the bedrock, scratching and polishing it. As ice flows over a bedrock bump, the side the ice reaches first is abraded smooth while the other side is plucked rough, as you can see so clearly on slide 15 of the Yosemite VTrip earlier in this module. Subglacial streams sweep away the loose pieces and may cut into the rock.
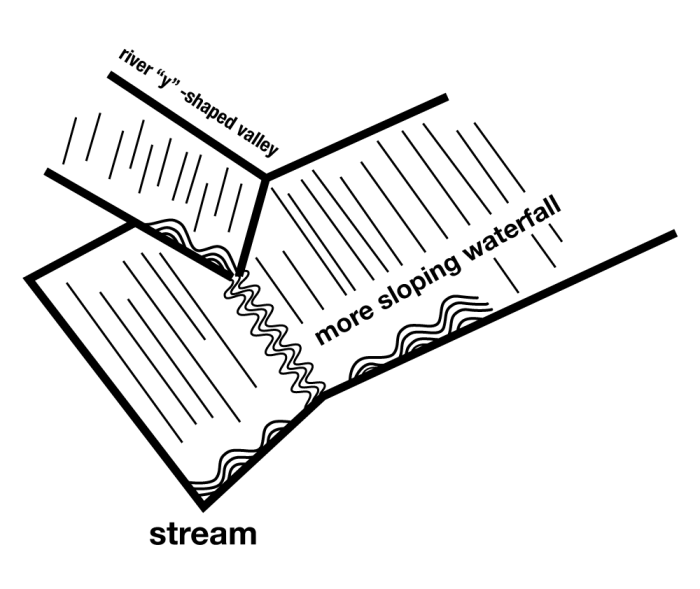
Plucked and abraded rocks show clearly that glaciers were present, but so do big features, such as Yosemite Valley. The steep walls and nearly flat bottom of the valley make a characteristic “U” shape. A river without a glacier tends to cut downward and then mass movement processes remove material from the walls, giving a "V' shape. (Where a V-shaped stream enters an ocean to make a delta, the outward and upward growth of the delta over time may eventually fill the bottom of the V with mud to make a flood plain, as we saw with the Mississippi, but initially, when a stream is cutting down, it tends to make a V.) However, glaciers are quite wide and can erode across a broad region, giving the classic "U" shape.
Yosemite is famous for its waterfalls from “hanging valleys” far up in the cliffs, another sign of recent work by glaciers. With streams, steeper ones generally erode faster. If a main river cuts down rapidly, its tributary streams become steeper and cut downward faster. In this way, even a small side stream can “keep up” with the erosion by the main stream so stream erosion generally produces "rapids" rather than waterfalls. Glaciers are different. A main glacier often fills its valley, burying most or all of the rock. The ice from a side glacier then does not drop steeply down into the main glacier. For various reasons, the main glacier tends to erode faster than the side glaciers. When the ice melts, a “hanging valley” is left behind — a small stream that replaces the small side glacier must plunge over a glacially carved cliff and then flow across the bottom of the “U”-shaped valley to reach the main stream. Eventually, the side stream will wear away the waterfall. But today in Yosemite, numerous streams emerge from small “U”-shaped hanging valleys to cascade down the glacially carved cliffs—the landscape is pretty much what the glaciers left. (Piles of rocks at the bottoms of waterfalls show that the streams are indeed changing things, but slowly.)
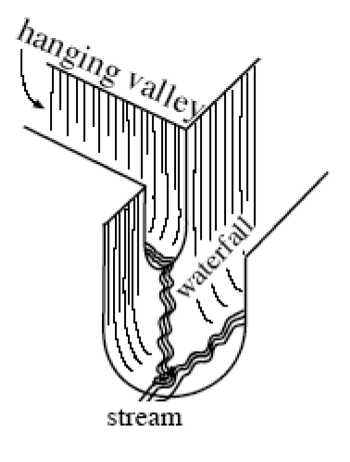
Glaciers make many other erosional features. At the head of a glacier, freezing and thawing can break rocks, and the loose pieces can be hauled away by the glacier, carving a bowl into the side of a mountain. If bowls chew into a mountain from opposite sides until they meet, a knife-edged ridge is left—such as the Garden Wall of the continental divide in Glacier National Park, which we’ll meet soon. Where three or more bowls intersect from different sides, a pinnacle of rock is left, such as the Matterhorn of Switzerland. Mountaineers have dubbed the bowls cirques, the ridges aretes, and the pillars horns, and geologists continue to use these terms.
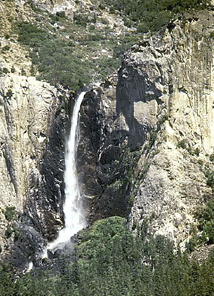
Glaciers also leave distinctive deposits. Streams, waves and wind all sort rocks by size, leaving too-big ones behind and carrying away smaller ones, eventually depositing sediments dominated by a single grain size such as sand. Glaciers don’t care how big the rocks are that the ice carries, so a deposit put down directly from the ice may have the tiniest clay particles mixed in with house-sized or bigger boulders. Such a deposit is called a glacial till. Till plus glacial outwash (sediment washed out of a glacier by meltwater) may be piled up together in a ridge that outlines the glacier, called a moraine.
Pennsylvania has a Moraine State Park, which features glacial moraines. Cape Cod is a moraine, and a moraine is draped across Long Island, showing some of the places where glaciers from the ice age ended.
Glacier National Park
Glacier National Park
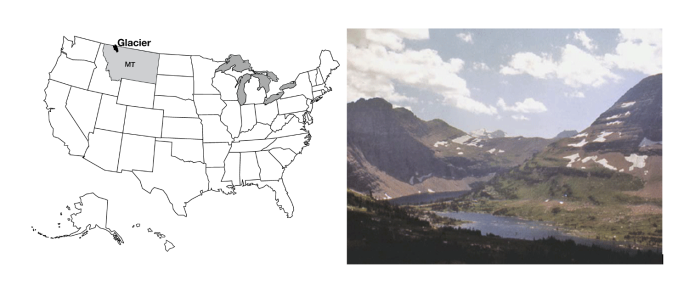
Glacier National Park is the southern part of the Glacier-Waterton Lakes International Peace Park, extending north-south across the Canadian-U.S. border and east-west across the great Front Range of the Rockies. Glacier is home to wolves and grizzly bears, mountain goats balanced on cliffs, moose munching on water plants, and beautiful flowers such as beargrass and avalanche lilies. Going-to-the-Sun Road winds past Going-to-the-Sun Mountain, among the best-named features of the park system. The Garden Wall is a knife-edge ridge left as glaciers gnawed into the backbone of the continent from the east and the west, and in many places is the continental divide. Long, narrow lakes lie along the valleys, which sometimes host lines of lakes strung like beads on the string of the connecting river. (Such glacier-carved strings of lakes are called paternoster lakes, after a resemblance to the beads of a Catholic rosary.)
Glacier National Park had roughly 80 active glaciers in 1850, dropping to perhaps 25 in 2022. There is a little uncertainty related to exactly how big and active a mass of ice must be, to be called a glacier. Many of the former glaciers may be essentially dead now, as human-caused warming melts many away (see the changes shown by the older and more recent photos below; again, we will come back later to how we know that the changes are human-caused). Glacier National Park is now more noted for the tracks of past glaciers than for the activity of present ones. But, we suspect that “Ex-Glacier National Park” would not have made the Great Northern Railway happy when they were promoting tourism in Glacier National Park (via the Great Northern Railway, of course). When the last glacier has melted away, perhaps within a few decades, there are no plans to change the park's name.
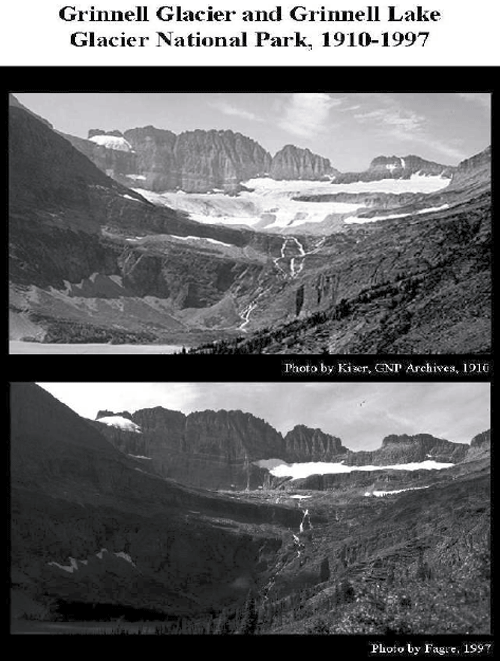
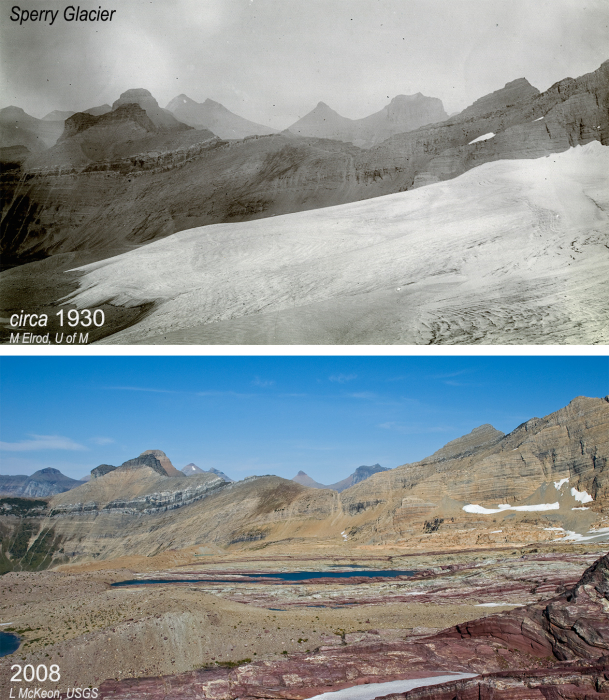
Evidence of Ice Ages
Today, permanent ice covers about one-tenth of the land on Earth, mostly in Antarctica and Greenland, with a little ice in mountainous regions. We saw at Yosemite that glacier erosion and deposition produce features that differ from those produced by mass movement, rivers, wind, or coasts. Geologically recent examples of those features, produced by glaciers, from roughly 20,000 years ago, are spread across almost one-third of the modern land surface—in places such as Wisconsin, northern Pennsylvania, Yosemite, and Glacier National Parks, and many others, the mark of the ice is unmistakable. The 10,000 lakes of Minnesota, the Great Lakes, the gentle moraines of Illinois, and many more features reveal a glacially-dominated landscape. Such features in Europe first motivated the hypothesis that ice ages have occurred.
This ice-age hypothesis makes many predictions, which allow testing. In times before modern geology, the glacial deposits were called “drift” because they were thought to have drifted into place in icebergs during Noah’s flood. Other people have suggested that the deposits were splashed into position by a giant meteorite that hit Hudson Bay, and other hypotheses have been advanced. But, the ice-age hypothesis makes predictions that differ from the Noah’s-flood hypothesis or the meteorite hypothesis in many ways, and the ice-age predictions are confirmed beautifully, while the others failed. (The biggest difference is that icebergs and meteorites do not make features that even vaguely resemble those actually observed, but let’s look at other differences.)
If huge ice existed, its great weight must have pushed down the land beneath—recall that the deep rocks are hot and soft, with a “water-bed” cover of stiffer rocks on top. If the ice age peaked only about 20,000 years ago, the slow flow of the soft, deep rocks should mean that the land where the ice once sat would still be rising after the melting, while the land around the former ice would be sinking as the soft, deep rocks return to their pre-ice-age positions. The global flood hypothesis and the meteorite hypothesis do not predict such a bulls-eye pattern of rising and sinking centered on the regions with features known to be made by glaciers today—the flood would have spread evenly across the land, and would not have concentrated its weight in one place. The sudden blast of the meteorite would not have left its weight long enough to push the slow-flowing deep rocks far. Measurements by GPS and other techniques show just the pattern expected from the ice-age hypothesis, a pattern not predicted and not explained by the other hypotheses. (We will show you some of the evidence for this, and for the flooded river valleys described just below, when we visit Acadia in our discussion of coasts in Module 8.)
The water for huge ice sheets would have been supplied by ocean evaporation, with the water getting stuck in the ice rather than returning rapidly to the sea in streams. Hence, if ice ages occurred recently, there should be evidence of lower sea levels when the ice was big. No such prediction comes from the meteorite or big-flood hypotheses (the meteorite might have made a wave but otherwise would not have affected sea level; the big flood would have raised sea level). Again, the ice-age prediction is borne out by the evidence, and the predictions of the other hypotheses are wrong. For example, some corals grow only in shallow waters with much sunlight. Dead samples of such corals from about 20,000 years ago can be found where they grew, down the sides of islands and now under more than 300 feet of ocean water. Other evidence also points to lower sea level in the recent past—geologic evidence shows that the Chesapeake Bay, for example, is a river valley drowned by rising ocean waters.
Take a Tour of Glacier National Park
How Many Ice Ages?—An Ocean of Clues
How Many Ice Ages?—An Ocean of Clues
So, we have an immense amount of evidence that ice ages really occurred. But, on land, one advancing glacier might erode the record of an older one. A pile of four tills deposited by glaciers and separated by soils from warmer times may record four advances, or forty, with most of the record having been eroded away and only a few deposits remaining. To learn how many ice ages there were, we go to places in the deep oceans, where sediment has been piling up without erosion for millions of years. We can identify glaciations and warmer times using characteristics of the shells in those sediments, as we discuss next, and we can learn their ages.
Water in the oceans is not all the same—roughly one molecule in 500 has an extra neutron or two in one or more of the oxygen or hydrogen atoms. Such “heavy” water is still water but weighs a little extra. (If you don’t remember isotopes, go back and look at the introduction to chemistry near the start of the course.) Not surprisingly, light molecules evaporate more easily than heavy molecules. Water vapor, rain, and snow thus are slightly “lighter” than the ocean; that is, the ratio of light water molecules to heavy ones is larger in vapor, rain, and snow than in the ocean from which the vapor, rain, and snow came.
During an ice age, roughly 300 feet of this slightly light water evaporates from the ocean and piles up on land as gigantic ice sheets, leaving the oceans a bit heavier isotopically. When the ice age ends and the ice melts, that light water from the ice sheets is returned to the ocean, making the ocean isotopically lighter.
These changes are small - the ocean is water at all times! Rounding just a little, in the modern ocean 1 of each 500 water molecules is heavy, which is the same as saying that 1000 of each 500,000 water molecules are heavy. When the ice sheets were big, roughly 1001 of each 500,000 water molecules were heavy. This difference does not affect the water, but it is easy to measure with modern instruments.
Many plants and animals that grow in the ocean build shells of calcium carbonate (the stuff of limestone) or silica, both of which contain oxygen obtained from the water, and record the isotopic composition of the water. During times with more ice, the shells that grow and then fall to the sea floor have slightly heavier oxygen isotopes. As the shells pile up, they record a history of the ice volume on Earth with the youngest layers on top. With enough care, knowledge, and instrumentation, dedicated workers can obtain consistent, reproducible data that tell a wonderful, clear story. (There are a few additional details, but the main story is this simple.)
Amazingly, the story was predicted correctly decades before scientists gained the ability to test it, as we’ll see in the next section! The story is that, over the most recent 800,000 years, ice has generally grown for about 90,000 years, shrunk for 10,000 years, grown for 90,000 years, shrunk for 10,000 years, etc. Superimposed on this are smaller wiggles, with a spacing of about 19,000 years and 41,000 years. (As described in the Enrichment, the ice was growing and shrinking more than 800,000 years ago, and there have been times in Earth’s history with no ice on Earth, and other times when the Earth was completely ice-covered. We will revisit some of these issues later.)
Are Glaciers Really Changing?
Optional: Want to see more?
The Cold of Space
The Cold of Space
During the 1920s and 1930s, a Serbian mathematician named Milutin Milankovitch, building on work by earlier scientists, calculated how the sunshine received at different places and seasons on the Earth has changed over a long time in response to features of Earth's orbit. As the sun, moon, Jupiter and other planets tug on the Earth, the orbit changes a bit. Earth wobbles with a 19,000-year periodicity, the pole tilts a little more and then a little less with a 41,000-year periodicity, and the orbit changes from nearly round to more squashed or elliptical and back with a 100,000-year periodicity. NASA animations of these are shown below. With modern computers, these changes are relatively easy to calculate for many millions of years; for Milankovitch, the calculation was the labor of a lifetime. (He did it very well, though, even correctly noting that the 19,000-year periodicity goes from 19,000 to 23,000 years and back, a pattern that is indeed observed in the data testing his prediction! Also note that the NASA animation for precession says that it is a 26,000-year cycle, which is correct, but it interacts with other cycles to cause variation in sunshine with periodicities of 19,000 to 23,000 years. The ability to calculate these variations accurately really is amazing.)
Video: Changes in Eccentricity (Orbit Shape) (00:07)
Video: Changes in Obliquity (Tilt) (00:01)
Video: Axial Precession (Wobble) (00:04)
These orbital wiggles have little effect on the total sunshine received by the planet, but they do move the sunshine from north to south and back, poles to the equator and back, or summer to winter and back in various ways. For example, today the northern hemisphere is farther from the sun in northern summer than in northern winter. (Remember that summer is controlled by the tilt of the planet’s spin axis relative to the plane in which the planet orbits, not by the distance from the sun!) In the few millennia centered 9000 years ago, the northern hemisphere had slightly warmer summers and cooler winters than recently because the Earth was closer to the sun during northern summers and farther from the sun during northern winters than today. (Note that this was reversed in the south.) The drop in summer sunshine in the north over the last 9000 years allowed mountain glaciers to slowly expand a little, culminating in the so-called "Little Ice Age" of the 1600s to 1800s; the strong melting of glaciers since then is mostly the result of human-caused warming. (We will discuss this later in the course.)
Summer in the northern hemisphere is most important in controlling ice ages, because the northern hemisphere is mostly land and can grow big ice sheets, but the southern hemisphere is mostly water, and already has ice on Antarctica, so can’t change its land ice much more. In the north, even during warm winters the highlands around Hudson Bay are cold enough to have snow rather than rain. During times when features of the Earth's orbit gave reduced sunshine in the north, ice has survived summers and grown; increasing summer sunshine has melted the ice. The way the various cycles interacted led to larger or smaller changes, and thus to the ice ages we know.
You may guess that this is slightly oversimplified so far. For example, during times when Canada has received more summer sunshine, allowing its ice to melt, the southern hemisphere or the tropics often received less sunshine, yet they warmed too! How Canada told the glaciers of Patagonia and Antarctica to shrink was a great puzzle for a long time. The answer involves global warming from atmospheric carbon dioxide. The growth and shrinkage of the vast ice sheets, the changes in sea level, and other changes had the effect of shifting some carbon dioxide (CO2) from the air into the deep ocean during ice ages and bringing the CO2 back out into the air during times when the northern ice was melting. The orbits affected the ice, which affected currents and sea level, and plants and other things, which affected CO2. But, as we will discuss later in the semester, CO2 in the air warms the Earth's surface no matter how CO2 gets into the air. And, the changing CO2 explains why, when the ice was growing, places getting more sunshine still got colder, and why, when the ice was shrinking, places getting less sun still got warmer.
Climate records show many other types of changes. Very large, rapid changes have been caused by sudden surges of ice sheets, and by jumps in the way the ocean circulates. We do not understand these faster changes well enough to know whether they could happen again. We're cautiously optimistic that we will avoid crazy climate jumps, but we're more worried about Antarctic ice-sheet surges raising sea level. Naturally, the Earth’s orbit right now is in an intermediate state, orbital changes are causing almost no change in the climate, and we should be looking forward to another 50,000 years or more with little change in the climate from orbits before we begin the natural slide into a new ice age. (See the Enrichment for a little more on this.) However, humans almost certainly are now more important to the climate than are such slow changes, as we will see later, and we probably have already stopped the next natural ice age.
Trail Ridge Road and Bear Meadows
Trail Ridge Road and Bear Meadows
Permafrost and Periglaciation
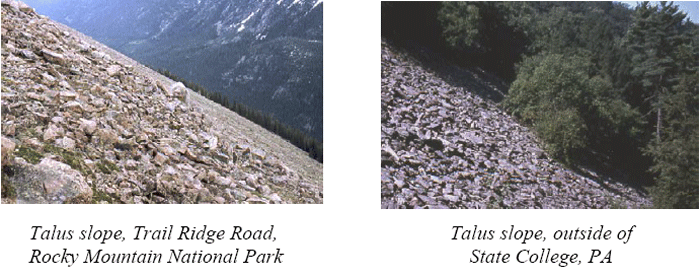

Meanwhile, when the ice age had covered such places as today's New York, Chicago, Minneapolis, Seattle, and much of Europe, with thick ice, what was happening in central Pennsylvania and other areas around that ice? The evidence is clear that the ice ages cooled all or almost all of the Earth. And, some of that evidence comes from central Pennsylvania, which was a real frozen tundra.
If you climb the ridges of Central Pennsylvania, perhaps up in the Seven Mountains just southeast of Penn State's University Park campus - go up Bear Meadows Road past the ski area, for a start - you may notice several interesting things geologically. Beneath the Pennsylvania forest, the soils, streams, and hillslopes have more in common with the high meadows of Trail Ridge Road in Rocky Mountain National Park, or with the regions around the ice sheet in Greenland, than with the modern climate of University Park. Trail Ridge Road crosses tundra, where small, hardy plants grow atop permafrost. Although the uppermost soil along Trail Ridge Road thaws during the brief summers, and the deep Earth is thawed by the heat of the Earth, the materials between are frozen year-round in permanent frost. (Such areas are sometimes called “periglacial,” because they may occur around the perimeter of a glacier, but sometimes they are far from glaciers, so "permafrost" is the better name.)
The Bear Meadows National Natural Landmark, just over the ridge from Penn State’s University Park campus, was recognized by the National Park Service in 1966 as a site that “possesses exceptional value as an illustration of the nation’s natural heritage.” Although many guidebooks somehow have decided that Bear Meadows is 10,000 years old, the Meadows are much older, having formed during the most recent ice age, roughly 20,000 years ago (and possibly earlier). Here, take a walk just above the Meadows, and learn why Pennsylvania hikers, like those in the high country of the Rocky Mountains, are wise to wear sturdy shoes. Then, see what this has to do with the Formation of the Meadows — they really are related.
Video: The Formation of Bear Meadows (1:56)
So here we are at Bear Meadows, perhaps the biggest and best natural wetland in central Pennsylvania. Natural wetlands, lakes, bogs, are fairly rare in Central Pennsylvania. And that's because nothing has been making them recently. And nature fills them up. Rocks wash in streams. Trees fall and leaves fall. And wetlands fill up. So when you see a wetland, you have to say geology made this fairly recently. Or humans made it. And this one's natural.
If we were to go out into this bog and stick a pipe down in the mud about 20 feet and pull it up and split it open, the mud on top has sticks and leaves and twigs of things that live here today. At the bottom, it has remnants of things that live on the north slope of Alaska today. It has evidence of tundra. This formed during the Ice Age. Below that is rocks.
And so it's rocks and then Ice Age and then stuff that lives there today. So this formed when the climate was different. And it formed by those beautiful rivers the rocks that we were looking at just up the hill. When this was tundra, when this was the North slope of Alaska or the top of Rocky Mountain, the hillsides were creeping down in these great rivers of rocks. And one of those dammed the stream. And that made a lake. And since then the lake has been filling in to give us this beautiful wetland that's full of good things all year.
Back in Module 5, we saw how freeze-thaw cycles can break rocks. We also saw how ice crystals can grow under rocks that have been broken free and push them upward, allowing smaller rocks to fall underneath and thus raising the bigger rocks toward the surface. This behavior is especially common in permafrost regions, causing them to have broken-up big rocks sitting on top of soil or smaller rocks.
Ice under rocks very near the surface melts in summer. In warm places, as we saw in Module 5, the water drains down through spaces in the ground, with some of the water eventually reaching rivers. But, in permafrost regions, the deeper spaces are clogged with still-frozen ice. The upper layers then become saturated with water, which can lubricate the downhill motion of the rocks on top of the soil. Permafrost regions thus commonly have blockfields extending downhill from ridges, with big rocks on top of soil, often with the blocks tipped up on edge and pointing downhill. Such a moving mass that reaches a valley may dam a small stream to make a wetland or small lake, and then the mass may turn and move downhill, filling the former stream valley with rocks much too big for the stream to wash away.
Features such as this are still developing today in parts of Alaska, around the ice sheet in Greenland, and on top of Trail Ridge Road in Rocky Mountain National Park, where the role of permafrost can be documented in detail. And, features such as this are spread across the mountains of central Pennsylvania and into surrounding states. Hikers on the Appalachian Trail, Mid-State Trail, and other trails in Pennsylvania are wise to wear sturdy shoes, and often complain bitterly about “Rocksylvania”, where hiking boots go to die.
The resistant sandstone layers that form the backbones of many ridges in Pennsylvania were broken by freeze-thaw cycles and produced blockfields that crept downhill and into the valleys during permafrost times of the ice ages, damming a small stream to make Bear Meadows, and giving the large blocks that fill other stream valleys. It takes a little investigation to find a road cut or other excavation cutting through one of these block fields, but if you do, you will see that the big sandstone blocks are on top, with smaller pieces of soil below, and then a different type of bedrock (commonly shale) below that. Note that the trees growing on top of the blockfields stand straight and tall, and roads bulldozed through the blockfields are not being buried or carried downhill—the motion largely or completely stopped when the ice age ended, waiting for the next occurrence of permafrost.
Permafrost produces many other features that are easily recognized. In nearly flat places, wintertime cooling often causes the ground to contract so much that it breaks into patterns, with summertime meltwater flowing into the cracks and filling them. Such ice wedges are still present in modern permafrost, and ancient ones can be recognized where they cut across other layers and then filled with things washed in as the ice melted. Such former ice wedges have been found in parts of Pennsylvania.

Also on nearly flat places in permafrost regions, the freeze-thaw processes combined with such ice wedging may sort the larger and smaller rocks into patterns, and such patterns have been found in Pennsylvania. (Note that many of these features, such as those on Big Flat near Bear Meadows, were described by geologists during times when logging and fire had removed the thick vegetation; the features are hard to see and almost impossible to photograph today but can be found during careful bush-whacking.) But if you're not an expert walking in thick vegetation on uneven blockfields, we recommend you just take our word for it.
Bear Meadows even records the history of warming from the ice age. A core collected from the sediment in the bog has silt with little evidence of vegetation in the oldest layer at the bottom. Above that, pollen and other remains of cold-weather plants appear, dating to the first bit of warming from the ice age, followed by a progression to warmer-weather types and on to the modern, productive bog with its blueberries and bears and other interesting plants and animals. A nearly barren tundra of the Trail Ridge Road type, with a creeping permafrost lobe that dammed a stream, followed by warming, would have produced the sediments we see.
The conclusion is nearly inescapable—Trail Ridge Road in Rocky Mountain today is an excellent picture of what Pennsylvania looked like during the ice age. Permafrost is common across much of northern Alaska, Canada, and Siberia, around the coast of Greenland, and in high-altitude regions. Permafrost poses grave problems for construction — the heat of a building can melt permafrost beneath, causing uneven settling that breaks the building. Permafrost also records the climate changes that have come to central Pennsylvania and other regions.
Rivers of Rocks and Permafrost
So why do hikers in Central Pennsylvania carry so many ace bandages? And the answer is that there's rocks on top of everything. All the trails in Central Pennsylvania are covered with rocks that are sitting up on a edge like this on top of the dirt. Why do the rocks get on top of the soil? And that story's sort of interesting. If you ever have a cat and you buy a bag of kitty litter, and you shake the bag and then you open it, you'll find the big pieces are on top.
You may find this in cereal boxes too that you'll get the big pieces floating to the top. And that's linked to a very simple geometric fact which is that little pieces can fall under big ones. And big ones cannot fall under little ones. If you want to find things like this that are happening today you won't find them here. These trees are not being rolled over by rocks that are moving. Our trees are perfectly happy here.
To find places where things like this are really moving today, you go to the top of Trail Ridge Road in Rocky Mountain National Park. You go to the North slope of Alaska. And there the ground is permanently frozen at some depth. And the rocks are slowly creeping down in the summer on top of that, lining up and turning up as the freezing and thawing move things around.
Here if you thaw the snow, it just soaks down through the rocks. It goes through the spaces. It goes down the river and it's fine. If it's frozen underneath, it can't soak down. And so you get soft mud that's full of water. It can't get rid of its water. It's sitting on top of slippery ice. What's it do? It slides downhill slowly. And so you go to the North slope of Alaska. You go to the top of Rocky Mountain. And all the hillsides are moving. And they're tipping the rocks up on edge and they're lining the rocks up in the direction they're going. And they're making things that look just like this without the trees. And so what we see here is a route of the Ice Age.
Take a Tour of Bear Meadows
An Important Aside: Is This Storytelling or Science? (Hint: Science...)
An Important Aside: Is This Storytelling or Science? (Hint: Science...)
Much of the science we have covered so far in this course is based on measurements taken today or very recently. The slow motion of drifting continents really can be measured with various techniques such as GPS, landslides are obvious to people whose houses are carried away, and the silt on the teeth of anyone who foolishly drinks untreated water from many rivers will prove that sediment is being moved.
But, much of our science involves history. For example, humans were not around with GPS receivers and satellites when Africa crashed into North America to raise the Appalachian Mountains. We are increasingly moving into subjects that involve “historical” geology, and reconstructing the events before modern humans were measuring the motions and writing down the results. We have presented a little of the evidence documenting past ice ages in this Module, in part to get ready for historical parts in future Modules.
We have focused on the scientifically accepted answers, but consider how scientists got those answers. If you go up to Bear Meadows and look around carefully, you will see the blockfields of big rocks extending down from ridges, sitting on soil, and then shale bedrock.
Many hypotheses could explain this observation—space aliens dropped the big rocks, or bulldozers pushed the rocks into place; or, the rocks slid down in a catastrophic, fast-moving giant landslide; or, they came creeping down slowly in permafrost; or, … you could probably think of others. Each hypothesis leads to predictions. If a bulldozer pushed the big rocks into place, we should find the bulldozer tracks, and we should be able to trace back in historical records to who was driving the bulldozer, and why. The first settlers, who arrived before bulldozers were invented, should have found hillslopes free of big rocks. Landslides start with big falls or slumps from particular places, so a landslide should have a big scar at its head where the rocks started, whereas creep slowly collects rocks as they are worked loose and carries them along, lining them up as they go.
So, scientists have looked for evidence that supports or refutes each hypothesis. The early settlers complained about the big rocks, and old cabins were built on the big rocks, so the bulldozer hypothesis wouldn’t work. There is no evidence of a landslide scar anywhere at the heads of these features, despite evidence for lots of different “stripes” of big rocks extending downhill from a ridgetop source where the bedrock of the same type as the big rocks sticks out.
You could follow the earlier scientists and quickly come to the realization that the rocks look like soil-creep deposits extending down from the ridge crests; the predictions from the other hypotheses fail, but each of the predictions from the soil-creep hypothesis is supported by additional data collected for testing purposes.
You can also note that the material is not now creeping—roads and trails are not being slowly buried by big rocks today, the trees are not knocked over, etc. Tree roots hold many of the rocks in place and prevent motion. So geologists looked for a time in the past when tree roots were not holding the rocks in place. The geologists collected the additional information given above (and much more!) - the big rocks are on top of smaller rocks and soil, not on the bottom, the big rocks are often standing on the edge, the rocks show patterning of coarse and fine, etc. Other geologists were scanning the whole planet, laboring over centuries, and learning the conditions of creeping hillslopes in the tropics, the deserts, the temperate zones, and the poles. By talking to other geologists, reading the literature, and devoting careers to careful study, they learned that the things you can see today on the slopes of Central Pennsylvania resemble features of permafrost and not features of any other modern setting.
But, if you are correct and these are permafrost features, there should be other evidence of cold conditions in the past, at the time that these features were active. Taking a core from the bog showed that the bog started in a very cold time (the deepest pollen is from plants that today are found only on the tundra), and the bog seems to be dammed by one of the soil-flow lobes, linking the soil-flow lobes to the time of the tundra cold. (It's true, no one has used a backhoe to take the dam apart to look for buried space aliens, but we'll stick to vaguely plausible things here).
Next, scientists ask whether this makes sense. Scientists have tentatively concluded that the hillslopes of Pennsylvania recorded cold conditions at a particular time in the past. Is there a reason why cold should have been here at that time? Well, just to the north, glaciers were pushing up moraines at the same time. Astronomers making orbital calculations find that the high northern latitudes were receiving about 10% less sunshine than today during that glacial age. Climate modelers who test whether such a drop in sunshine would be sufficient to grow glaciers and make conditions very cold find that cold indeed makes sense, especially when the modelers include the effects of the drop in atmospheric CO2 levels that was triggered by the change in the sunshine and that is recorded in ice-core bubbles from the time.
Now, a modern geologist who tells this “story”—Pennsylvania hikers risk twisting their ankles on permafrost deposits—actually has a lot more evidence than the little sketch provided here. For example, hypotheses often suggest new measurements that have never been made before but that can be used in further testing. Penn State researchers have even measured the concentrations of rare isotopes that are produced in the rocks by cosmic rays only very near the surface where abundant cosmic rays penetrate, showing the increase in erosion and transport caused by the onset of ice-age conditions. A vast amount of information collected by centuries of Earth scientists is combined in our modern understanding.
A Rocking Review
A Rocking Review
The most recent ice age may have ended, but there is still a lot of ice remaining in Antarctica and Greenland. Here’s a little more about the Antarctic ice, who lives around it, how it behaves, and why we might care. We’ll explore the warming effect of rising CO2 in Module 12; for now, just note that we are raising CO2 in the air, and it does have a warming influence, based on fundamental physics discovered in part by the Air Force for military applications.
Video: Snowflake: An ode to traditional folk song, "A Fox Went Out On A Chilly Night" (4:08)
DR. RICHARD ALLEY: Oh, snowflake out on a chilly night. Over the ocean of blue and white. Southern Cross as a guiding light and heading for South Pole-Oh, Pole-Oh, Pole-Oh. Southern Cross as a guiding light and heading for South Pole-Oh.
Over the albatross soaring through. Penguins plying the krill-flecked blue, seals and skuas and great whales, too, all playing around South Pole-Oh, Pole-Oh, Pole-Oh. Seals and skuas and great whales, too, all playing round South Pole-Oh.
One flake's a miracle, two a display. Three and you might wreck your car today, but make a two-mile pile and they're on their way flowing from South Pole-Oh, Pole-Oh, Pole-Oh. Two-mile pile and they're on their way flowing from South Pole-Oh.
The physics are simple, all piles spread, water, batter, or cats on a bed, or a continent-wide two-mile pile snow-fed and heading from South Pole-Oh, Pole-Oh, Pole-Oh. A continent-wide two-mile pile snow fed and heading from South Pole-Oh.
Slow in the middle, thick and cold, down through the mountains carved and old, picking up speed in the ice streams bold, don't fall in a crevasse-oh, crevasse-oh, crevasse-oh, picking up speed in the ice streams bold, don't fall in a crevasse-oh.
Ice streams at the sea don't make bergs right away, they flow across the ocean for many a day. As great ice shelves in a rock-bound bay with friction from sides-oh, sides-oh, the sides-oh. A great ice shelf in a rock-bound bay with friction from the sides-oh.
If we raise CO2, warm the air and sea, melt the shelves away, and let the piles spread free, it'll raise the oceans towards you and me while it shrinks that two-mile pile-oh, pile-oh, pile-oh, raise the oceans towards you and me while it shrinks that two-mile pile-oh.
Arctic fox on a chilly night by another ocean of blue and white, if we melt their ice, would that be right? Both poles are on the same trail-oh, trail-oh, trail-oh. If we melt their ice, would that be right? Both poles are on the same trail-oh.
Oh, a snowflake out on a chilly night.
Optional Enrichment Article
Optional Enrichment Article - A little more about glaciers
Types of Glaciers
Glaciers occur in different forms and sizes, and you might occasionally find knowledgeable scientists who disagree about what to call a particular glacier. An ice sheet is huge - the size of a continent, or at least the world's largest island (Greenland) - and spreads in all directions. An ice cap or ice dome is a smaller version of an ice sheet, sitting on a mountain top or high plateau, and also spreading in all directions (or at least in several directions). Many glaciers flow down from some mountain peak and may be called mountain glaciers, or valley glaciers, or just glaciers. An outlet glacier is a fast-moving part near the edge of an ice sheet or ice cap, especially if it flows between rock walls; fast-flowing parts near the edges of an ice sheet or ice cap flowing between slower-flowing ice are called ice streams. And yes, there are cases where an ice sheet is drained by a fast flow with ice on one side and rock on the other. Classifications such as this help us talk about things but are not precise.
Flowing Solids and Hot Ice
Dr. Alley has spent months of his life living on the great ice sheets of Greenland and Antarctica. (And Dr. Anandakrishnan has spent a lot more time on the ice sheets than Dr. Alley has!) Eating and sleeping and working at -30º, it is hard to think of ice as being a hot material, but that is exactly what it is, as noted earlier in this module.
Recall that heat is the vibration of atoms or molecules in a material and that in most solids including ice, the atoms or molecules are arranged in regular, repeating patterns. Melting of ice occurs when the typical molecule vibrates fast and hard enough to break free from the bonds that tie it to its neighbors and escape from that regular arrangement. When a material is almost hot enough to melt, the atoms vibrate almost hard enough to break free from their neighbors and move around, so it is relatively easy with a little extra push to move a few molecules at a time past their neighbors. The gravitational stresses caused by the surface slope of a glacier supply that little extra push and the ice deforms. (This deformation is primarily by dislocation glide - something like moving a carpet by making a rumple on one side of the room and then slowly shoving that rumple to the other side of the room.) When a material is not nearly hot enough to melt, the molecules are not even close to vibrating hard enough to break free from their neighbors, a whole lot of extra push is required to move molecules, and moving even a few molecules at a time is very difficult. The material then deforms elastically, or it breaks, but it does not creep and deform permanently in the way that a glacier does.
Most people measure temperature on a scale that gives “nice” numbers (something between 0 and 100) for typical daytime temperatures, so talking about the temperature is easy for us. But, other temperature scales make more sense in physics. If you slow the vibrations of molecules by cooling them, you can imagine that there must be some temperature at which vibration stops because all the heat has been removed. We call that temperature “absolute zero” or just zero on an absolute temperature scale. (Yes, in a quantum world, the Heisenberg uncertainty principle means that the last tiny bit of vibration can’t be removed, but vibration is almost completely stopped at absolute zero.) If we set the zero on our temperature scale to this “absolute zero,” and then use degrees that have the same size as in the commonly used Celsius or Centigrade scale, we get the Kelvin scale. Ice melts at 273ºK and water boils at 373ºK; there are 100 degrees between melting and boiling in Kelvin, just as in Celsius. (The Rankine scale uses Fahrenheit-sized degrees and absolute zero as zero, with ice melting at 460ºR and water boiling at 640ºR, but almost nobody uses Rankine anymore, so you are welcome to forget you ever heard about it.)
As a general rule, little or no permanent deformation (creep) occurs when the temperature (in Kelvin or Rankine!) is less than about half the melting temperature, and creep occurs rather easily when temperatures exceed about three-quarters of the melting temperature. The coldest mean-annual temperature on Earth today is about eight-tenths of the melting temperature of ice (that is 217ºK, which is also -56ºC or -69ºF, in case you still like old-fashioned thermometers). Most ice is as close to melting as red-hot or even white-hot iron being worked by a blacksmith. This is why glaciers usually flow rather than break—although breaking is still possible where deformation is very fast and where the pressure is very low, producing crevasses. So, you may find wintertime ice to be uncomfortably cold, but as a material, it is still hot!
Glacier Erosion
Ice can be well below freezing, or at the freezing point. Anyone who has ever defrosted an old-style freezer knows that subfreezing ice built up on the walls of the freezer is VERY hard to remove, but warming it until it reaches the melting point allows the ice to suddenly move easily and slide off. If you are using a chisel or screwdriver to chip the ice away, the sudden motion when the contact with the freezer thaws may cause you to scratch or gouge the freezer. Glaciers that are frozen to rocks beneath them don’t slip over those rocks rapidly and don’t erode those rocks rapidly, but if enough geothermal heat or other heat is supplied to thaw the contact between glacier and rock, the ice slides and can erode rapidly.
Erosion by thawed-bed glaciers occurs mostly in one of three ways: plucking, abrasion, and subglacial streams. We'll describe them a little more here.
First, recall that ice is an unusual material—higher pressure lowers its melting point rather than raising it, opposite to most materials. Ice has a sort of tinker-toy or construction-set structure with a lot of empty space between the molecules, and squeezing ice tends to force molecules to move closer together, making denser water. Most materials have less space in the solid than ice does, and melting requires knocking molecules out of orderly arrangements in ways that take up more space, a change that is opposed by higher pressure.
If a glacier is sliding across a bump in its bed, ice will tend to melt on the up-glacier side of the bump where the pressure is higher. The meltwater will flow around the bump to the down-glacier side, where the lower pressure will allow the water to refreeze. The heat given up by the refreezing will be conducted back through the bump, to allow more melting. But, you may remember that melting and freezing can open cracks in a rock. So, a glacier sliding over its bed can work rocks loose, and then freeze those rocks onto its base, in a process known as plucking. (When water spreads over the bed of a glacier in the spring as melting on the surface starts to feed water downward, the friction with rock that holds the ice back becomes concentrated on smaller regions of the bed not lubricated by the water, and this stress concentration breaks rocks, helping to cause plucking.) And, sometimes basal ice picks up rocks, and those rocks get stuck for a while against the rock beneath and then break free in a little earthquake. The quake pulls ice away from the downstream sides of bumps, lowering the water pressure there, while high-pressure water persists in cracks and spaces in the thawed-bed rock beneath a glacier, allowing a sort of hydrofracking that breaks rocks. )
Once glacier ice contains rocks at the bottom, it is like sandpaper—it drags those rocks over other rocks, scratching and polishing and knocking loose smaller rocks. This process is called abrasion. If you examine rocks on the walls of Yosemite, many still retain a polished appearance with parallel scratches or striations, showing where abrasion was active. Bumps are smoothed and even polished on one side—the up-glacier side—but may be rough and jagged on the down-glacier side where rocks were plucked off of them.
The melting of glaciers can produce a lot of water. The toe of a fast-melting glacier may supply more water to streams than does a similar-sized region in the rainiest place on Earth. The glacier acts to collect snowfall from a big area and take the snow to melt in a much smaller area. Trees and grass do not grow on glaciers to use the melt water but they do grow on the ground to use rainfall. Glacier melt usually flows down holes in the glacier, called moulins, that often form at the bottoms of crevasses. (Some brave or foolhardy people like to go caving in moulins after they drain during the winter.) The moulins eventually reach the glacier bed, where they feed large, steep, fast-moving streams. These erode in the same ways as streams outside of glaciers. Glaciers with much meltwater usually cause erosion to be faster than in non-glaciated regions. Fluctuations in water pressure, as moulins fill with water during daytime melting and drain as melting slows at night, contribute to cracking rocks for plucking.
More on the History and Future of Ice Ages
As we will see later in the course, the climate has changed naturally. Some times far in the past were very hot—too hot for people to live in large parts of the Earth—with the heat primarily from naturally higher concentrations of atmospheric carbon dioxide. (Humans are raising carbon dioxide in the atmosphere now primarily by burning fossil fuels. We are raising carbon dioxide faster than almost all of the natural changes, and human decisions will control how much we raise carbon dioxide and thus how hot we make the climate). Times of very high temperatures had no ice even near the poles, and are sometimes called “hothouse climates”. (Melting all the ice on Earth would raise global sea levels a bit more than 200 feet (60 m).) Natural processes including the formation of fossil fuels have caused cooler times to occur as well, when ice existed near the poles; such times are sometimes called “icehouse climates”, even though most of the world did not have ice. During a few special times, ice spread to cover the whole Earth; these are called “Snowball Earth” events.
The ice has not been constant during icehouse climates, but has gotten bigger and smaller—the ice-age cycles discussed earlier. Recall that these have been paced by features of Earth’s orbit rearranging sunshine by location and season, with the effects made global by changing atmospheric carbon dioxide levels. We are still in an ice-house climate, with ice in Antarctica and Greenland. When this icehouse was established millions of years ago, the ice grew and shrank fairly rapidly, with spacings of 41,000 years between big-ice times especially common. Then, about 800,000 years ago, the behavior shifted (for reasons that are not fully understood, although we have some good hypotheses) to cooling and ice growth for roughly 90,000 years, followed by warming and ice melt for roughly 10,000 years, then repeating. The rate of cooling initially has been slow, so you may read about 10,000 years of warmth followed by cooling. Today, the northern hemisphere has been in the not-much-change/slight-cooling phase for almost 10,000 years already, and you might expect that we are ready to begin sliding into the next ice age. But, it isn't quite that simple.
The 100,000-year pacing of a 90,000-year-cooling/10,000-year-warming world is linked to the interaction of the different orbital cycles, but the 100,000-year cycle in the out-of-roundness of the orbit is important. The orbit goes from nearly round to more squashed and back in about 100,000 years, largely controlled by the tiny tug from the gravity of the planet Jupiter as we pass it in our orbits. And, there is a slower modulation of the out-of-roundness that takes about 400,000 years. More or less, the orbit goes from nearly round to a little squashed, to nearly round, to more squashed, to nearly round, to even more squashed, to nearly round, to not as squashed, to nearly round, to barely squashed, and then this whole thing repeats, with the nearly-rounds spaced roughly 100,000 years apart. We are in the barely-squashed part now, and the last time that the orbit was in the barely-squashed mode, the warm time of the ice-age cycle lasted 30,000 years rather than 10,000 years. Climate models have confirmed that this points to our natural future; actually with roughly 50,000 more years of warmth before the next ice age starts. However, human burning of fossil fuels has already released enough carbon dioxide to warm the climate more than 50,000 years into the future, likely stopping that next ice age. (If we were truly interested in stopping that next ice age, we would wait until the cooling was due and then release the carbon dioxide.)
Also, note that the 19,000-year cycle noted in the text is an oversimplification. There is instead a “quasi” periodicity ranging from 19,000 to 23,000 years, as we mentioned briefly, and this was calculated by Milankovitch and is observed in the data collected to test Milankovitch's calculations, beautifully confirming his predictions. The whole story is a little more complicated than we can fit into a short Enrichment section here, but the basics are clear—orbits pace the ice ages by moving sunshine around on the planet, and this causes environmental changes that shift carbon dioxide between the deep ocean and the atmosphere, globalizing the changes.
Central Pennsylvania and Glaciation
During at least one old glaciation (probably over 1 million years ago), ice flowing south from Canada dammed the West Branch of the Susquehanna River and formed a lake in the Lock Haven area of Pennsylvania. If that lake filled to the next lowest bedrock outlet (into the Juniata River along the Bald Eagle Valley at Dix), then the water would have lapped at the steps of Old Main on Penn State’s University Park campus. There is no evidence of such a large lake, and before the lake filled all the way, it probably drained through the failure of the ice dam, but we’re not sure. With ice so close, however, central Pennsylvania was cold during the ice ages.
Isotopic Ratios of Dead-Bug Shells
In the main text, you learned how the changes in ice volume control the isotopic composition of water in the ocean, and how we can reconstruct the ice-age cycle from the history of shell isotopic compositions in a sediment core because the shells record the water isotopic composition. As usual, things are a bit more complicated than that. Shell isotopic composition also is affected by temperature. When there is more ice on land, the ocean has heavier isotopic ratios in its water, and this gives heavier isotopic ratios in shells growing in the water, but colder temperatures also give heavier isotopic ratios in shells. (At high temperatures, both heavy and light atoms have plenty of energy to jump out of a shell; at low temperatures, the heavy ones tend to get stuck in shells while the light ones can jump out.) Because both colder water and ice favor isotopically heavier shells, measurement of shell isotopic composition cannot tell you the relative importance of temperature versus ice volume.
One way around this is to go to a place that is cold today; the water was above freezing during the ice age (shells were living in it…), so there the signal must be primarily one of ice volume. Other approaches include finding additional paleo-thermometers, such as estimating the temperature from the species living in a place and leaving their shells, or using changes in other “contaminant” ratios in shells that depend on temperature. Yet another way is that there is water in spaces in mud, and the water in some sediments is from the ice age, so just measure the isotopic composition of that water.
The result of this is that isotopic ratios did change because there was much more ice during the ice age than today and because most places were much colder during the ice age than today.
Module 7 Wrap-Up
Module 7 Wrap-Up
Review Module Requirements
You have reached the end of Module 7! Double-check the list of requirements on the Welcome to Module 7 page and the Course Calendar to be sure you have completed all the activities required for this module.
Reminder
Exercise #3 is due and Exercise #4 opens this week. See the Course Calendar for specific dates and times.
Supplemental Materials
Following are some supplementary materials for Module 7. While you are not required to review these, you may find them interesting and helpful in preparing for the quiz!
- Website: Glacier National Park
- Website: Yosemite National Park
Comments or Questions?
If you have any questions, send an email via Canvas, to ALL the Teachers and TAs. To do this, add each teacher individually in the “To” line of your email. By adding all the teachers, the TAs will be included. Failure to email ALL the teachers may result in a delayed or missed response. For detailed directions on how to do this, see How to send an email in GEOSC 10 in the Important Information module.
Module 8: Coasts & Sea-level Changes
Welcome to Module 8
Welcome to Module 8
Coasts & Sea-level Changes (Cape Cod & Acadia)

The cod has been an extremely valuable resource for several centuries in Massachusetts. Its extensive use as a food dates back to the earliest period of European settlement in coastal New England. In colonial times, it was deemed so important that in 1693 the General Court of the Massachusetts Bay Colony ordered that farmers could no longer use cod as fertilizer. This action was one of the first recorded attempts at natural resource conservation and management on this continent.
Although one of the earliest fisheries resources to be broadly utilized after European settlement in New England, cod populations along the US coast proved to be very resilient. Cod apparently withstood more than 3 centuries of harvest without displaying major, long-term regulations in abundance. However, mid-twentieth century advances in fishing technology and the introduction into the northwest Atlantic of distant-water foreign fishing fleets during the late 1950's led to a period of reduced abundance and major annual fluctuations in population size. During the mid-1980s commercial vessels captured mostly 3 to 5 year old fish, indicating that few larger, older individuals remain along the North American coast.
—From the Massachusetts Division of Marine Fisheries
Will cod fishing continue to be valuable in the future, feeding people and supporting jobs? We don’t know… human decisions on climate change and energy, and on rules governing fishing, are more important for the future of cod than anything else.
Will Cape Cod be there in the future? Looking out a few millennia, the answer is probably "no." Beaches, like rivers, are controlled by the interactions of water and sediment. Sand is supplied, and sand is lost. If these processes are interrupted, the coast or the river must change. And in the distant future, Cape Cod is likely to be the new Georges Bank, a shallow underwater place that could be home to great masses of fish, if we leave enough fish to populate it and we leave the cool waters that these fish need.
Learning Objectives
- Explain how coasts are highly complex environments that can change rapidly.
- Understand that some coastal changes were started by the ice age or other long-ago events, while other coastal changes are being caused by humans now.
- Explain how human actions to modify coasts can achieve their goals but also can fail greatly.
What to do for Module 8?
You will have one week to complete Module 8. See the course calendar for specific due dates.
- Take the RockOn #8 Quiz
- Take the StudentsSpeak #8 Survey
- Submit Exercise #4
- Begin Exercise #5
Questions?
If you have any questions, send an email via Canvas, to ALL the Teachers and TAs. To do this, add each teacher individually in the “To” line of your email. By adding all the teachers, the TAs will be included. Failure to email ALL the teachers may result in a delayed or missed response. For detailed directions on how to do this, see How to send an email in GEOSC 10 in the Important Information module.
This course is offered as part of the Repository of Open and Affordable Materials at Penn State. You are welcome to use and reuse materials that appear on this site (other than those copyrighted by others) subject to the licensing agreement linked to the bottom of this and every page. Students registered for this Penn State course gain access to assignments and instructor feedback and earn academic credit. Information about registering for this course is available from the Office of the University Registrar.
Main Topics: Module 8
Overview of the main topics you will encounter in Module 8
Just for fun!
Traditional sea shanties are work songs that were used by sailors to help them coordinate their physical labor while making the work more enjoyable. This one was used by sailors from Cape Cod…
Cape Cod boys don't have any sleds
Look away, look away,
They slide down dunes on codfish heads
We're bound for Australia.
Cape Cod girls don't have any combs
Look away, look away
They comb their hair with codfish bones
We're bound for Australia.
Cape Cod cats don’t have any tails
Look away, look away
They lost them all in Cape Cod gales
We're bound for Australia.
Getting the Most from the Coast: Cape Cod, Acadia, and Friends
- There are many "types" of coasts (beaches, reefs, mud flats, cliffs, deltas, etc.); here, we’ll especially focus on beaches.
- Waves move LOTS of sand, mostly in, out, in, out…, which sorts by size to give sandy beaches.
- Waves move a little extra sand out during winter storms (breaking waves come in through the air without sand, and go out along the surface with sand).
- And waves move a little extra sand in during summers (a wave surges up the beach a bit faster than the water flows back out, and thus the wave moves a bit more sand in than out).
The Coast Is Friendly—the Ocean Waves
- Waves go slower in shallower water.
- The first part of a wave to approach the coast slows and waits for the rest of the wave to catch up, so the wave "piles up" to break, and turns to come almost straight in.
- But "almost" is not "completely" straight in, and this slight angle drives longshore drift of sand and water along the shore.
- Eventually, some sand is lost to deep water below the reach of waves.
- A beach thus needs sediment supply to balance this loss, or else the beach is eroded.
The Coast Is Friendly—Buoy Meets Gull
- New beach sand is supplied by longshore drift from river-fed deltas, or by erosion of the coast behind the beach.
- Erosion of land behind the beach, and loss of houses, roads, and other things there, is promoted by:
- dams on rivers, which trap sand in reservoirs so the sand cannot reach beaches (for example, the Elwha River dams in Olympic National Park) caused beach loss,
- “dams” along the coast (jetties or groins) that stick out will block longshore drift, trapping sand and letting clean water pass to erode beyond),
- past sea-level rise, which flooded river valleys so river sediment now is trapped where rivers enter bays and does not reach outer beaches (e.g., Chesapeake Bay),
- past deposition by glaciers or other processes that formed coastal land (e.g., Cape Cod) where there are no big rivers to supply sand,
- ongoing sea-level rise or sinking of the land surface along the coast, flooding beaches and washing sand into deeper water.
But Many Coastal Residents are Crabby
- Most U.S. coasts are retreating (about 75%)
- Beaches are retreating because of the processes mentioned in the previous section ("The Coast Is Friendly—Buoy Meets Gull")
- Beaches are especially retreating because humans are raising sea level
- Human-caused global warming is melting glaciers, releasing water that reaches the sea
- And global warming is causing the ocean water to expand
- We also are adding a little more water to the ocean by pumping it out of the ground faster than nature replaces it
- We also contribute to beach retreat by pumping groundwater, oil and gas from beneath beaches, allowing the beach to compact and sink
- Upward or downward motion of the land from natural mountain-building or from ongoing response to the changes in weight from the melting of the ice-age ice sheets is causing beaches to advance or retreat in different areas.
Cape Cod National Seashore
Cape Cod National Seashore
Coasts and Cape Cod
Your tour guide, Dr. Alley, is a lucky fellow. Through a fortuitous sequence of events, which involved marrying the right woman who had the right grandfather who was related to some people who have roots in the right place and worked hard to preserve those roots, our family has been able to stay for a week or two during many summers in a wonderfully historic house, built in the 1700s, in Eastham on Cape Cod. The land has been given to the National Park Service as part of the Cape Cod National Seashore. The house has access to the bicycle trail to the Coast Guard Beach, the Salt Pond Visitor Center, and the great Nauset Marsh. Dr. Alley has visited most of the National Parks, but he has spent more time at the Cape Cod National Seashore than any other. A few pictures from his family visits are given in the following slideshow.
Take a Tour of Cape Cod National Seashore
licensed under CC BY-NC-SA 4.0
We’ll start here to tell you some background about the Cape in case you want to visit, and to help you understand the geological setting that we will discuss in more detail soon.
Cape Cod is a glacial moraine, a deposit that outlines the former extent of the ice-age ice sheet that flowed south from Canada. The part of Cape Cod that attaches to the mainland marks the end of a lobe of the Canadian ice sheet. The “forearm” where the Cape points north is an interlobate moraine—while one tongue or lobe of the ice sheet filled Cape Cod Bay between the Cape and Boston, a second lobe lay farther east in what is now the Atlantic Ocean, and built a moraine that is now the fertile fishing grounds of the Grand Banks. (You will see this when you reach the geologic map later in this section.) The northward-pointing “forearm” of the Cape is composed mostly of outwash, the sand and gravel that were transported and deposited by meltwater rivers flowing off these two ice lobes into the narrow space between them. Till, the deposit made from pieces of all different sizes dropped directly from the glacier ice, is found more commonly along the part of the Cape that attaches to the mainland.
The forearm part of the Cape thus is an outwash plain, and most of the numerous freshwater ponds of the Cape began their lives as ice blocks buried in outwash sand and gravel. Melting of the ice later allowed the collapse of the outwash that had been deposited on top of the ice blocks, forming kettle ponds. Soon after it formed, the Cape had more ponds than we see today, but many have been filled with logs, sticks, leaves, peat, and other organic material. The logs and other materials in these former kettle ponds can often be seen eroding out on the bluffs along the Atlantic beach, including along the Coast Guard Beach that is so easily reached from the Salt Pond Visitor Center of the National Seashore. Radiocarbon dates on such deposits, together with other information, show that the ice was retreating from the Cape Cod region roughly 15,000 years ago.
The sandy soils of the Cape, and its numerous kettle ponds, are home to cranberries, blueberries, and wild orchids. Beach plums produce their small but sweet fruit late each summer, and blackberries and dewberries vine across old dunes. Deer and grouse still inhabit the uplands, and turkey are multiplying rapidly as oaks spread across regions that were logged by humans but are being allowed to regrow.
Much of the interest at the Cape focuses on the sea. Nauset Marsh, for example, is a wonderful place to visit for bird-watching, fishing and kayaking in protected waters that are miles long and a good chunk of a mile wide. The protection for the marsh comes from the “outer beach,” a long sand bar between marsh and ocean, which is split by one inlet (or occasionally more inlets, depending on what year you visit) allowing water to flow into and out of the marsh with the tides. Deep channels in the marsh are home to crabs, scallops, starfish and striped bass, often pursued by seals coming in from the open ocean. Between the channels, great flats of marsh grass flood during high tides and dry as the tide falls. Flocks of wading birds and shorebirds, from large herons and egrets to tiny plovers and sandpipers, breed there or stop to feed during their migrations. Osprey survey the marsh from high nests on perches constructed by the Park Service, as well as nests in trees along the shore.
One year, a hurricane had driven unusually warm waters to the Cape, bringing ctenophores from the south. Ctenophores are also called comb jellies, and look something like jellyfish. In the sun these creatures often appear as if they have small rainbows down their sides, because the light is broken on the cilia or hairs that the creatures beat to move themselves around. At night, this particular type (Leidy’s comb jelly) is bioluminescent, glowing with a beautiful blue-green light when the waters around them are disturbed. Imagine, if you can, kayaking into the marsh after dark, with golf-ball-sized “fireflies of the ocean” glowing and swirling with every wave. Another year, tiny phosphorescent plankton (dinoflagellates) were washed into the marsh, lighting up at night with every drip from the kayak paddle and every little fish eating the plankton. Then, fast-moving striped bass slashed through, eating the little fish. (This is a likely reason why the small plankton have evolved to generate phosphorescence, protecting themselves from being eaten by the small fish by notifying the larger, predatory fish.) Indeed, the Cape is a wonderful place.
The Cape is changing rapidly, however. The large Nauset Marsh has been narrowing as the outer beach moves steadily into the marsh. Two of the Cape’s lighthouses were moved during the summer of 1996, barely in time to avoid collapsing over the bluffs into the sea as the bluffs have been eroded away, and the day will come when the light houses must be moved again or else lost.
At the ends of the Cape, to the north and south, new land is being formed, or has formed recently, from the deposition of sand (yellow on the map below). But, more than twice as much land is lost each year as is formed, and the Cape is slowly but surely disappearing. The next ice age might rebuild the Cape, but naturally that ice age is still far in the future, and our global warming is probably already so large and likely to last so long that the ice age will not occur, so the Cape appears destined to become islands and then an undersea bank over the next few thousand years, unless we humans spend a whole lot of money and effort to stabilize it somehow. The long-term retreat rate of the Outer Beach in Eastham has been about 3 feet per year over more than a century, with fluctuations and perhaps with a little recent acceleration.
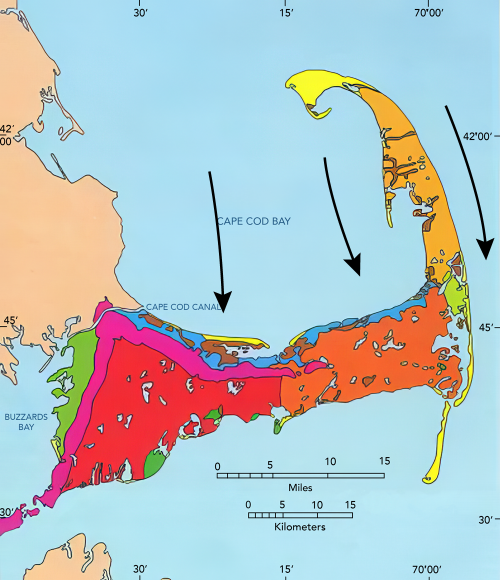
Waves and Coasts
Waves and Coasts
There are many types of coasts. North of Cape Cod at Acadia National Park in Maine, strong igneous and metamorphic rocks make sea cliffs. To the south, Virgin Islands National Park is famous for coral reefs, although they are now endangered by human-caused climate change and other impacts; the reefs are composed of the skeletons of trillions of tiny animals that have built upward from the sea bottom in shallow, clear, sunlit, oxygenated waters far from sediment that would bury and choke them. In Louisiana, we visited the Delta National Wildlife Refuge with its waterfowl-filled wetlands developed on mud delivered by the Mississippi River. At Cape Cod, we find sandy beaches.
The type of coast depends on many things: the amount and type of sediment the coast receives, how energetic the waves are that hit it, how much the tide goes up and down, the type of rocks, how warm or cold the climate is, and many other factors. We discussed some issues with the muddy delta of the Mississippi River earlier. The biological challenge of saving coral reefs from overheating, pollution and other damage is large and important, but a little beyond the scope of this class. Here, we will concentrate on sandy beaches such as those at Cape Cod, to learn about them and to gain some insights to other types of beaches.
If you watch the waves on Cape Cod beaches or any other sandy beach, you will see that those waves move a lot of water, and a lot of sand. Dig a hole just above the water level during a rising tide, and within a few minutes the hole will be mostly or completely filled with wave-carried sand. Go to the beach during a big storm and you will see immense amounts of sand moved. Hundred-foot-high bluffs may be eroded back several feet during a single storm, or layers of sand many feet thick may be added to the beach or eroded from it in hours. A movie long shown at the Salt Pond Visitors Center includes a series of photos taken of one section of beach before and after a string of storms one winter. The summer beach is an unbroken expanse of sand, but boulders many feet across (more than a meter) are buried in it, and were completely uncovered and then buried again several times during that one winter as the sand was moved off the beach into slightly deeper water and then carried back onto the beach as shown in the short video clip below.
Video: Beach Changes (:45)
Every winter the sea repeatedly removes and then returns a thick layer of sand. In the following series, watch the level of sand rise and fall on the same stretch of beach. The first scene is November 14th, a month later, 3 weeks after that, 2 days, another two days, in three more weeks, in two more weeks, and in seven more days on February 20th.
The energy for moving all of this sand is mostly supplied by the wind, which drives the waves, and to a lesser extent by the tides, which are bulges of water raised by the gravity of the moon and sun and following them in their orbits around the Earth. (We saw earlier that earthquakes and other phenomena can cause tsunamis, which also can move a lot of sand, but significant tsunamis are very rare compared to wind-driven waves, and not a big issue for Cape Cod almost all the time.) Most of the sand transported by waves is simply moved onshore—from the ocean toward the beach—and offshore—from the beach toward the ocean—as each wave comes in and goes out. Most transport is into and out from the beach, rather than along the beach, because most waves turn so that their crests are almost parallel to the beach, and their water motion is almost directly towards and away from the beach. The turning happens because waves go slower in shallower water. If a wave approaches a beach at an angle, the first part to get close to the beach will slow down, allowing the rest of the wave still in deep water to nearly catch up, as shown in the diagram below.
Video: Waves turning toward the beach (1:53)
Waves coming in from the ocean towards the beach tend to turn, so they're coming almost straight towards the beach, but not quite when they actually get to the beach. This is ultimately because waves go slower in shallower water, and the water very close to the beach is shallower than it is farther out. To see how this works, let's go to Cape Cod. This is First Encounter beach on a beautiful sunset. We're going to draw lines along the high spots, the crests of several of the waves in this picture. Here they are.
And now, think about going above these with your drone and looking down. We're going to start with a wave way out to sea beyond that blue one. It might be this one. Both ends of it are in deep water, so it's coming in fairly fast on both ends. But then the one end has gotten into shallower water, so it slows down. The other end is still going fast, so a little bit of turning is going on. As it comes in, the shallower end goes slower. We'll have the yellow one here, and then we'll have the orange one, and then we'll have the red one.
It's going slow in the shallow water on the left, but it's going very slow in the very shallow water on the right. And what has happened, it's turned, so it comes almost straight towards the beach. And that's why we saw this in the beautiful sunset at Cape Cod.
Every wave moves sand up and down the beach. On even rather quiet days, if you sit down on a Cape Cod beach in shallow water, you soon will find that sand is piling up in places around you, and being eroded in other places, and that you have sand in your swimsuit, and possibly even in your hair. This in-and-out movement of the sand with every wave dominates the sand transport, and allows for very efficient sorting of the sand by size, taking away pieces smaller than sand pieces, leaving pieces larger than sand in other places, and eventually giving almost all sand on the beach (although sometimes with buried boulders in the sand, or some fist-sized rocks just offshore where you might step on them if you wade into the water). This repeated movement of pieces in waves also knocks the sharp edges off sand grains, sea shells, old bottles, and other material on the beach, making the rocks and sand and shells rounded, and giving pretty “sea glass”.
As described in the video below, if you look out to sea during a winter storm, you’ll see high-energy breakers coming at you. The white caps of the waves rise high, curl over, and crash down, so that some of the water arrives on the beach after coming in through the air rather than washing along the sand. But the water then rushes back toward the ocean along the sand, carrying some sand seaward. Storms, which frequently occur during winter, often move some sand from the beach into slightly deeper water. This transport may remove enough sand to lower the height of the beach surface by many feet or tens of feet during the winter, exposing buried boulders as described earlier. The waves of summer are on average lower in energy, and don’t break and travel through the air as much (occasional hurricanes change this story, but most of the time the story is fairly accurate). The surge of summer waves up the beach is slightly faster than the return flow down the beach, and may carry a tiny bit more sand up than back; the net effect is to bring sand from just offshore back to the beach, burying any beach boulders that were exposed during the winter.
Video: Eroding Winter Beach (0:54 seconds)
To see why the ocean often erodes beaches in winter, we're going to use the great wave off Kanagawa, a woodblock print by Hukisai from 1831. Waves of this type are more common in winter when the storms are stronger. And so, we'll add a First Encounter beach on Cape Cod. This is a summertime picture of the beach. When waves like this big one happen, the water arrives coming through the air and it doesn't have a whole lot of sand. It crashes down on the beach and then flows back out to sea picking up sand. And so, it can erode the winter beach, exposing buried boulders and other things.
Recall from earlier, though, that the waves and the sand come almost but not quite straight in and straight out—there is still some angle. If you are playing in the waves at the beach, and ride a wave in, swim out, ride in, swim out, ride in... after a while you may find you are drifting down the beach away from where you left your towel—even though you were mostly going toward the beach and back out to sea, the waves also were pushing you sideways. In such a situation, we say that you are experiencing longshore drift—you, and the water, and sand, are moving along the shore. Eventually, when the water and sand (but we hope not you!) reach the end of the Cape (at the Provincelands to the north, or Monomoy to the south), some of the sand carried by the longshore drift builds a spit or extension of land, but some of the sand is dumped off into deeper water beyond the reach of waves. This sand is then lost from the above-water part of the Cape, and the Cape has gotten a little smaller. Most references say that the great beach facing the Atlantic is retreating at about 3 feet (1 m) per year, although it may have been a little faster recently, and the panicked rescues of light-houses before they fell into the sea were needed because retreat for a few years was much faster. We’ll look at these issues, and what might be done, after visiting Acadia.
As mentioned above, waves move immense amounts of sand, primarily up and down the beach, but also with a little motion along the beach and eventually off into deep water. In this vintage video, Dr. Alley gets cold feet on Coast Guard Beach, Cape Cod National Seashore, to show you moving sand.
Vintage Video: The Feet (1:17)
Great Outer beach of Cape Cod, facing the Atlantic Ocean. Early morning. A lone figure leaving footprints on the sands of time. And you will see that, indeed, the waves move lots of sand. As the waves come in and out, and in and out, they keep moving sand ceaselessly, relentlessly. Notice the foot is on top of the sand when the wave comes in.
The foot is getting really cold, because that water is just straight out of the Arctic Ocean, practically. And now there's sand over the foot. And when the next wave comes, and the one after, you will see that indeed, the waves are moving sand in, out, in, out.
As they do so, they sort it. Little pieces are taken out to deep water and lost. Big pieces are not moved at all. And the in-between ones are swirling around the foot. And then another wave comes in, and then that one is really cold. And the hairy-legged sole here is soon going to be buried under the sand. And you can see how much sand is moved in just a couple of waves.
Coasting Down the Coast Slideshow
Come take a trip with us to see a bit on sea-level change, some disasters, and some coastal processes, in some beautiful places. We will discuss these more when we visit Acadia, next.
Acadia National Park
Acadia National Park and Sea-Level Rise
The subduction and collision with Europe during the closing of the proto-Atlantic made great granite bodies draped in metamorphosed rocks that started as sediments. Erosion over long times has exposed these rocks that once were deep in the mountain range, and we find them at the surface in places including along the Maine coast. The ice-age glaciers scoured those rocks and left the beautiful, bald mountain tops of what is now Acadia National Park, staring out at the storm-tossed North Atlantic across Somes Sound, the only fjord on the east coast of the U.S.
The Wabanaki tribe of Native Americans probably reversed the modern tourist pattern, summering inland and then moving to the relatively more moderate coast of Acadia in the winter. Nasty winter storms do run up the coast, but the wintertime temperatures plunge far lower inland than they do on the coast. Thick piles of discarded shells from nutritious sea creatures dating back 6000 years attest to the importance of the sea to these early people.
On September 5, 1604, the French explorer Samuel de Champlain landed on Acadia’s island. Impressed by the bare, rocky, deserted appearance of the glacially scoured granite mountain peaks of the island, he named it Isles de Monts Desert, “Island of the Bare Mountains.”
French influence was important until the end of the French and Indian War, after which English and then U.S. activity came to dominate. In the mid-1800s, Mount Desert Island attracted the art world, and was featured in paintings by many artists including Frederic Church, Thomas Cole, and others of the Hudson River School. For example, see Sanford Robinson Gifford’s "The Artist Sketching at Mount Desert, Maine, 1864-1865", now in the National Gallery of Art and reproduced just below.

The artists, in turn, attracted the “rusticators,” tourists who gradually were replaced by much wealthier tourists who built summer “cottages”—the Rockefellers, Fords, Vanderbilts, Carnegies, etc. These wealthy patrons in turn invested resources and political capital in preserving most of the island as a national park.
Today, over 4 million visitors per year flock to Mount Desert Island, with most of them getting out of the gift shops and into the national park. The visitors enjoy the history, the beauty, the rather chilly ocean waters (based on personal observation by the author, even on hot summer days, more people are sitting by the sea than swimming in it!), the outstanding network of paths for bicycling, superb kayaking on lakes and sea, and much more.
Take a tour of Acadia National Park
Changing Coasts and Sea Levels
Changing Coasts and Sea Levels
Experts on events happening near coasts often say that “Change is the only constant”. The Sea Grant Program at the Woods Hole Oceanographic Institution, on Cape Cod, reported that about 75% of the U.S. coastline is eroding, with only about 25% stable or advancing. For Massachusetts, 68% of the coastline was listed as eroding, 30% advancing, and a mere 2% stable. As we will discuss soon, much of the retreat is being driven by sea-level rise, which is being driven by human-caused global warming. But, the rising sea level is interacting with a very complex coastal system, and we’ll look at a little of that complexity, too, with land still moving vertically because of the ice age, coasts responding to natural and human-caused changes in sediment supply, and more.
Up in Maine, the rocky coasts of Mt. Desert Island are among the few places that would be classified as “stable,” although very slow erosion is occurring as the sea pounds the granite headlands. But if you look further back in time, the size of the changes becomes evident. Glacial ice overran the highest peaks in the park during the ice age. Sea level was lowered 300-400 feet (100 m or a bit more) at that time to supply the water that grew the ice sheets, but the land of Mt. Desert Island was pushed down 600-700 feet (roughly 200 m) or even more by the weight of the ice.
Ice-age ice extended south of Maine, beyond Cape Cod, and that southern ice began melting before the ice left Maine, so the sea began rising, and then loss of ice on Maine caused the rocks of Mt. Desert Island to begin rising faster than the sea; these rocks are still rising slowly today. Thus, as the ice retreated, the already much-raised sea first flooded in across broad regions of Maine and adjacent parts of the east coast. Beaches and sea caves formed along the edge of the sea, and deltas were deposited. Then, these coastal features were raised out of the ocean as the land rebounded. Such coastal features can be found today in Acadia to almost 300 feet (almost 100 m) above the modern sea level, and similar features occur all along coastal Maine, often extending well inland. We include a video of similar features from Greenland; the features in Maine are covered with blueberry fields, or trees, houses, roads and such, and although the features are quite easily identified by experienced geologists, the features are not as clear as those in Greenland to the beginning geologist.
Video: Raised Deltas and Beaches (2:48)
You can see and hear the story of raised deltas and beaches in Maine, Greenland and elsewhere in this short video.
The Ice Age led to the development of beaches and deltas that are now found well above sea level, as in Acadia or in South Greenland, as shown here. Let’s see how. We will start with some land next to the ocean, under the air. You might find a moose on your land—or not. And at some time in the past, an Ice Age happened. Water that evaporated from the ocean fell as snow on the land. This lowered the ocean as the water was transferred into the ice sheet. The ice sheet immediately began sinking under its own weight, but it took thousands of years (and even longer) for the full sinking to occur—to get way down to the bottom, even though the top was way up. Then, the Ice Age ended, the ice melted, the water went back into the ocean and the ocean extended farther inland than it had originally because the land had not finished bobbing up from being pushed down under the ice. When the ocean pounded on the shore, it made a beach—or maybe a delta was built there—far inland. And then as the land continued to rise, that beach or delta was raised way above sea level, where you can find it today—maybe with a moose in Acadia, or maybe not.
So we go back to this picture of beaches in Greenland. In some of these beaches you can find shells. You can date those shells using radiocarbon or other techniques. These are about 8,000 years old from Greenland. This is a delta that formed in Greenland, where a stream was flowing into the ocean. And here's a very similar delta viewed from the air—a very nice picture from the Maine Geological Survey. This Maine delta looks red because the picture was taken in the fall and the delta is covered with blueberries that grow in the sandy soil and the blueberry leaves turn red in the fall. The little yellow box on the far right there is around some features in the delta in Maine that look almost identical to those features in the delta in Greenland. So, if you go to Acadia, you go to Maine, or you go to Greenland, you can see features that were formed on the coast; they’re now well inland and well up because the Ice Age ended.
Regions that were slightly beyond the reach of the ice-age glaciers were pushed up during the ice age to form a forebulge, where the hot, soft, deep rocks pushed out from beneath the sinking ice sheets bulged up the land just before the ice. In those forebulge regions, the land now is sinking, as the deep, hot rocks flow back to their starting point; where forebulge sinking has combined with rising sea level as the ice melted, the total sea level rise has been especially large. Far from the ice sheets, sea-level rise has been about what you would expect based on the amount of water returned to the ocean by the melting ice sheets. (If you took a more-advanced course, you would learn that the entire surface of the Earth was warped by shifting water from the oceans to the ice sheets and back during the ice-age cycle, so the changes are all a bit more complicated than you might expect, just as a wine glass balanced anywhere on a cheap air mattress or water bed may tip over if you sit anywhere on the bed).
Video: Forebulge (2:09)
To see the description of the Earth’s “water bed” responding to the ice age, watch this very short video.
These are data from NASA showing vertical motions of the land along the coasts. Because the Ice Age ended, the areas shown in red are rising and the areas shown in blue are sinking as much as about 5 millimeters a year or an inch and five years. Here's why. Let's start with some air over some land and then let's drop an ice sheet on it. And when you drop the ice sheet on the weight of the ice pushes down so the land begins to sink, the deep, hot mantle flows out to the sides and that bulges up the land before the ice sheet in what we call the forebulge. It takes thousands of years and even longer for the total motion to occur until it comes into balance. When you melt the ice, you may still just have land, the ocean may come in or a lake may form and things start to go back where they were before. If you were on an island in the middle there, you would be rising, perhaps very rapidly, and this motion can continue for thousands of years and longer. Today, globally, sea level is rising by more than 3 millimeters a year or an inch in about 7 years, mainly because of global warming. A house on land that had been been pushed down may be rising almost as fast as the sea. It may be rising even faster than the sea and coming out of the sea. But, a house on the former forebulge is flooding really fast as it sinks while the sea rises. Offshore of Pennsylvania we have a little bit of sinking going on, so sea level rise is faster than it otherwise would be. Whereas in the places of the former ice sheet we have the land rising almost as fast as the ocean or even faster than the ocean.
By now, you may be getting the idea that what happens to a particular coast is fairly complex. If mountain-building is pushing the coast up, it rises; if mountain-building is pushing the coast down, it sinks. Where plates meet, when the edges lock together and build toward an earthquake, the motion may drag one side down and push the other side up; the earthquake that follows will suddenly reverse the offset—in the great Tohoku earthquake of Japan in 2011, parts of the Japanese coast moved as much as 8 feet toward North America, and offshore the largest motions of the sea floor were more than 150 feet horizontally and more than 20 feet vertically. Where cities are built on deltas, as in New Orleans, the compaction of the mud causes sinking. Much additional sinking is caused by pumping water or oil or gas out of the ground; as the fluids are removed, the ground compacts. This is happening a little on Cape Cod, and is quite dramatic in some places. Such pumping may have contributed to problems in and near New Orleans, in Venice, and elsewhere. (Pumping fluids back into the ground can partially offset this problem, and is being used in some places, but generally does not completely fix the problem.)
So, coasts may be going underwater, or rising out of the water, because of sea-level changes as described below, and because of the land going up or down. But, coasts also may advance or retreat because of issues related to the waves moving sand and other sediment.
Beaches inevitably lose a little sediment to deep water, somewhat like losing socks behind a clothes dryer, because it is easy to drop something that falls way down there, and hard to get it back. Waves can pick up sand from below the ocean’s surface and carry that sand to the beach, but waves cannot reach sand in very deep water (no deeper than roughly half the distance between a wave’s crest and the next one). If sediment happens to slide or bounce deeper than that, then that sediment cannot be brought back easily. (The sediment can go into a subduction zone, make new mountains, and be eroded to make new sand that reaches a beach by longshore drift, but that takes millions of years or longer.)
Thus, a “happy” beach requires a supply of sediment to balance the loss to deep water. Normally, that supply comes from the material delivered to deltas by rivers, and carried to the beach by longshore drift. But if there is not enough sediment coming this way, the beach will narrow as it loses sediment to the deep ocean, and the waves will crash across the sand to erode the material behind it, gaining sediment in this way.
In some cases such as Acadia, longshore drift does not supply enough sand to sustain a beach, and the rocks are too hard for the waves to break rapidly to supply a beach. Then, the little bit of sand produced by the waves ends up in deep water, and many of the cliffs have no beaches. (There are a few small “pocket” beaches at Acadia in protected places, but most of the coast doesn’t have beaches, with the waves pounding directly on granite.) In other cases such as Cape Cod, the waves crossing the beach hit sand and gravel left by the glaciers, easily eroding the loose material to supply beaches.
In some places, dams on rivers have greatly reduced the delivery of sediment to the longshore drift, so the nearby coasts are eroding. You may recall that the dams on the Elwha River, draining Olympic National Park, caused the loss of beaches along the nearby coast. At Cape Cod, there really aren’t any rivers that humans could dam. The glaciers made a big pile of sediment in a place where rivers are not supplying much sediment to deltas, and so the Cape eventually will be lost to deep water.
Rising Sea Level and the Future
Rising Sea Level and the Future
Video: Sea Rise (2:26)
Coastal flooding is getting worse. Let's look at some of the reasons why. We will start with this simple diagram. The ocean itself is rising mostly because of humanhuman-causedal warming. One reason is that the warming melts ice in mountain glaciers and in the Antarctic and Greenland ice sheets, releasing water that reaches the ocean to make the ocean bigger. Warming is also causing the ocean water itself to expand and take up more space. In addition, not directly related to warming, we pump a little more water out of the ground than nature replaces and that extra water is reaching the ocean to make the ocean bigger. The global sea level rise is causing flooding on most coasts but, there's much variation. In some places, the land is going up or down because of mountain-building processes and because of the response to the end of the Ice Age that had pushed some land down and other land up and now it's going back to where it had been. The land may be going down in many places because of compaction of mud in Deltas or because we're pumping water or oil out of the land and causing it to compact. The land may be building out because extra sediment is arriving as in a Delta that's growing, but the land may be eroding because extra sediment is being removed. The ocean itself may be rising or falling locally. The ocean surface is not perfectly flat. In some places the winds pile water against the land, other places they move it away, and as we change the winds and the currents that can change how much water is piled up or moved away. The warming may be making the strongest storms even stronger so that they can blow more water inland. And you might think of some other complexities. So global warming is flooding most coasts, but there's real need for experts who really understand and can help.
Coasts change for many different reasons, and in many different ways. But, recently, most of the U.S. (and world) coasts have been retreating because sea level is rising, and that rise is accelerating. The total size of the ocean is increasing, as water that had been stored on land in glaciers and ice sheets and in the ground is transferred to the ocean, and as warming of the ocean causes the water already there to expand and take up more space.
The rate of rise is now more than 3 mm/year (a bit over an inch per decade), and has been accelerating. That isn’t much if you’re at the top of a cliff in Acadia, but if you are on a sandy beach that slopes very gradually, the inch of sea-level rise may cause the coast to retreat by many feet or even a few tens of feet. That in turn means that a whole lot of houses and property can be lost in a single human lifetime.
This ongoing sea-level rise is being caused primarily by the rising temperature of the Earth’s climate (“global warming”), which is being driven primarily by human activities. (We’ll return to this later in the course, but we have very high scientific confidence that it is correct.) Most of the world’s small glaciers have been melting, Greenland’s ice sheet has been melting and flowing faster into the ocean, and Antarctica’s ice sheet has been flowing faster into the ocean, adding water to the oceans. Also, as the ocean itself warms, the water expands and takes up more room.
We also build dams on rivers, and the water that fills the reservoirs is taken out of the ocean and stored on land, causing sea-level fall. But, we “mine” groundwater by pumping it out of the ground faster than nature puts it back, and that water eventually reaches the ocean to raise sea level. Today, groundwater pumping is probably more important than dam building, contributing a little to sea-level rise.
The polar ice sheets contain a huge amount of water—if they melted, they would raise sea level nearly 250 feet (roughly 70-80 m). Philadelphia and the other great port cities of the world would become undersea hazards to shipping but really great places for fish to hide out, and the southern coast of Florida would be somewhere up in Georgia. We do not expect such a fate, but we cannot rule out the possibility that a dynamic collapse of the West Antarctic ice sheet could raise sea level more than 10 feet (3 m) in a human lifetime or two. If we don’t change our behavior, Greenland and its 24 feet of sea level is also looking shaky, although it would take centries or longer to melt completely. (Melting all of the remaining mountain glaciers would raise sea level only 1 foot or so, less than 0.5 m.) Drs. Anandakrishnan and Alley spend a lot of their research trying to reduce our uncertainty about the future of the great ice sheets, a fascinating and important topic.
Policy Implications of Sea-level Rise
Even if we humans stopped warming the climate, sea level will rise at least somewhat more, because much of the ocean has not yet fully warmed from the atmospheric warming we have already caused but will continue warming to “catch up” with the warmer air, and more ice will melt before reaching equilibrium with the warming of the air we have already caused. (If you come into a cold house in the winter and turn up the heat, it will take a while until everything feels warm; we have turned up the heat in the air, and it will take centuries for the ocean and the glaciers to fully catch up.) The near-certainty of continuing sea-level rise has some policy implications. For example, disaster aid following hurricanes that allows people to rebuild in vulnerable places will simply create the need for more disaster aid in the future. Many people believe that those who wish to build on the coasts should be required to carry insurance or to otherwise demonstrate that they have sufficient resources to cover their coming losses. Similar arguments apply to those who wish to build on earthquake faults, landslide deposits, and floodplains. Many people living in relatively safe but less-scenic places object to paying for others to live in dangerous but beautiful places.
Engineering Solutions
Because people love the coasts so much, and wish to live near them, all sorts of engineering solutions have been tried. These have had some success, but many failures, and they often lead to legal and political difficulties.
One approach is to build “dams” that stick out into the water and block the longshore transport of sand. These dams are usually called “groins” if they are small, and “jetties” if they are larger. (See the figure above). By making the coast rougher, and slowing waves, the plan is to trap sediment along the coast in much the same way that a dam traps sediment along a river. This plan sometimes works. However, recall that when a dam is built on a sand-bedded river, sediment is trapped upstream of the dam but eroded downstream. The same often happens along a coast; sediment is trapped “upstream” of the groin (on the side from which the longshore drift comes), but sediment is eroded on the “downstream” side (the side to which the longshore drift goes), where the sand-free waves attack the beach to pick up more sand. Saving someone’s beach while destroying the beach of a neighbor is a good way to generate lawsuits.
Video: Groins (3:14)
Most of our coasts really are eroding. Here’s one way we sometimes try to deal with it and how this might go wrong. You can build dams sticking out from the shore, and these can interrupt the longshore drift of sediment, trapping sediment where you are and reducing erosion. But, it can go wrong. Recall first what we learned about rivers and sediment transport. Here’s a river with a canoeist going down under the sun. If you build a dam and fill a reservoir with water behind the dam, recall sediment is trapped, to build a delta. The sediment is then not released from the dam; clear water is. If the bed of the river is sandy, it’s easily eroded. Then the river is eroded there as the clean water picks up more sediment and carries it away.
Now imagine that this same diagram is an ocean next to a coast, next to land, viewed from above from your drone. This coast is eroding, like most of them on Earth, and that is endangering houses there. The longshore drift is carrying a lot of sediment past and is removing slightly more than it brings. So, recalling what you learned from the river, you could build a dam to trap the sediment. This dam is called a groin; if it’s small, it’s called a jetty if it’s large. But whatever you call it, it captures sediment to help save your house. But if the coast is easily eroded, the clean water that goes past your groin erodes your neighbor’s house, and then your neighbor gets a lawyer and sues you and there are all sorts of problems.
Here’s a version of the same diagram from the Maine Geological Survey: Longshore transport is going there. A couple of groins have been built; sediment is building up on one side to save houses; sediment is eroding on the other side to endanger houses. In between some houses, you might not be sure which one happens: erosion or sediment.
Here’s a picture of a groin. This one happens to be an old one on Waikiki Beach in Hawaii that they were replacing. In this case, the eroded side has a wall that’s protecting it, so it isn’t cutting back into the luxury hotel. And the sediment buildup side has a nice beach that people love. If we look along this out to sea, it’s a beautiful view. Some places are building these, some places have outlawed them because of the problems.
People also spend millions of dollars to go out to sea, find sand that has fallen off into deep water, and bring the sand back to the beach. This sand usually lasts a single year or a very few years before being washed back to deep water, and in one recent case was mostly washed away in less than a week, but in some especially popular tourist destinations the investment may pay off.
We saw earlier that people do other things, such as building giant walls to keep the sea out. In the case of New Orleans, huge amounts of money were spent building a levee system, and then people built their houses and businesses in the supposed safety behind the levees. When hurricane Katrina broke the walls, the losses included the cost of building the levee system, the valuable things that the levees were built to protect, and the new valuable things that people built after the levees were erected, as well as the lives of so many people.
Geologists often look at such past events and then take a “natural” view of the coasts—we should figure out where the coast wants to go and build there rather than trying to stop the coast. But many people just don’t like that, and a lot of construction is likely to occur—and be destroyed—over the coming years, especially if we drive more warming.
Optional Enrichment Article
Optional Enrichment Article
Wishing for Water - When Salt and Fresh Mix
Near the coast and in some other places, pumping groundwater out of wells for our use can cause saltwater intrusion, eventually filling the wells with water we cannot use. Freshwater has a lower density than salt water, and so floats on salt water in much the same way that an iceberg floats on water or a mountain range floats on denser rocks of the mantle. (Salty water and freshwater can mix to make less-salty water, but if the freshwater is renewed by rainfall, the mixed waters will be forced out through the beach to the ocean, and there will continue to be nearly pure freshwater sitting on salty ocean water.) If the water table is lowered by pumping fresh water for human use, the interface between salt and fresh water will rise in the same way that the bottom of an iceberg or a mountain range rises if the top is eroded. The difference in density between salt and fresh water is small; an iceberg floating in the ocean has 9/10 of its thickness below the surface, but the fresh groundwater lens of Cape Cod floating on ocean water has 39/40 below sea level. So if enough water is pumped out of the well to lower the water table by 1 m, the salt water will have risen 39 m! If the freshwater table is lowered to sea level, the salt water will rise to sea level, and there will be no fresh water left for the well to pump. Many wells on the very low land of Cape Cod were drilled below sea level into fresh water, but are starting to pump up salt water, causing large problems.
Video: Saltwater Intrusion (1:40)
Here’s a video explaining the problem, and then a single diagram if you prefer shorter explanations.
People who get their water from wells and who live near the coast, or in some other places, have to worry that if they pump too much water out of the ground they will start to get salt water into their wells and they won't be able to use that. These diagrams are from an old publication of the United States Geological Survey but the problem is still new, it's still with us. So here's a diagram that could be Cape Cod. It is of an island from this report, and there is fresh water in the ground as shown there. But it's sitting on top of salty water and there's a little zone of mixing between the two but it's not very thick. So it is possible for a well to pump up fresh water that people can use. The problem is if you pump too much and the water table drops by one foot, the level of the salt comes up by 40 feet and that can get into trouble. So here's a diagram. Start with a water well that is in fresh water at the bottom, where it's pumping from, this is before it starts pumping. When it starts pumping it will lower the water table at the top and that will raise the level of the salt water at the bottom. If it pumps too much then you raise the salt up until it hits the bottom of the well what comes out is saltwater and it's no longer useful to the people.

Three more Cape Cod stories
Enjoy these optional vintage videos.
The Can
Human impacts on the land are easy to see. We have changed the oceans greatly, but the water covers our tracks. In "The Can," Dr. Alley briefly reflects on some issues of the oceans, as he watches one of the less-beautiful pieces of the Cape Cod National Seashore.
A beautiful, natural morning at the beach. But if you turn to the sea, you can see that the evening revelers were there. I've been to the beaches in Greenland. I've been to the beaches of Antarctica, and everywhere I've been, the flotsam and jetsam of humanity are on the beach.
Oceanographers have traced the currents of the Pacific using shoes and rubber ducks that fell off of ships during storms. More importantly, we've probably taken 90% of the big fish out of the ocean. We don't know what an ocean ecosystem should look like because it isn't natural anymore. We've changed everything. We've put so much fertilizer into the ocean from runoff from farming and sewers and other pollution that they cause huge blooms of algae and when they die, they rot and they kill the life around them and make dead zones. Taking care of the ocean is a big deal. And it's a deal we need.
The Marsh
Many of the ocean’s big fish, and other denizens of the deep, rely on salt marshes as nurseries and in other ways. But, we are losing salt marshes in many places, as sea-level rise forces the “outer beach” toward the shore, but humans don’t allow the inner side of the marsh to expand into our yards or parking lots. Obvious answers are not easily available, but Dr. Alley frames the question in this next short film clip as he paddles one of the family kayaks on the Nauset Marsh of the Cape Cod National Seashore.
Beautiful morning for a paddle. The tide's coming in, and a really happy professor is going out to see who's running around in the salt marsh, the Nossett Marsh in Eastham on Cape Cod. This is a place for birding. This is a place for shelling. These sand pipers are out getting breakfast.
Salt marshes are remarkably productive places. They are the nurseries of the fish and the shellfish. They're the nurseries of the ocean. They, too, need care.
The outer beach is coming in as the ocean rises. But the inner side is often hardened by humans and not allowed to move. And if we're not careful, we won't have these nurseries.
Meet Peat!
Cape Cod is a gift of the glaciers. The numerous kettle ponds left by the ice contribute to the biodiversity of the Cape, but are slowly filling in with sand, peat, and other things. Many of the ponds have already filled, and a walk along the rapidly eroding outer beach often reveals where the sea has cut into one of these filled ponds. In this next clip, Dr. Alley shows one such exposed, filled kettle pond, just below the old Coast Guard station in the Nauset region of the Cape Cod National Seashore.
We're on the outer beach at Cape Cod at Nauset, and we're looking at where the ocean has been cutting back a little bit of the bluffs to reveal what's behind. Now, most of the Cape is sand and gravel. It's outwash from the glaciers from the Ice Age. But what we see here is the filling of a lake. A block of ice fell off the glacier, was buried in sand and gravel, and then melted out to leave a little spot, a lake, which is filled with peat that you see here. The peat is the remains of dead plants. And if you look very carefully, you will see within the peat many of the dead plants.
On top here are grasses of the modern world, but they are not down in the material. Lakes die. They fill with this stuff. When you see a lake on the landscape, you should ask yourself, why is this here? Because something recent has happened to make the lake.
A Rocking Review
A Rocking Review
Yellow Submarine
The Beatles' Yellow Submarine surely must be very high on any list of songs likely to get stuck in your brain and play over and over and over and... But, watching our beaches, with perhaps three-fourths of the US coastline retreating inland in response to rising sea level and other changes, maybe a really "sticky" song is what we need down by the shore! Anyway, we hope you enjoy this parody, which really does review a lot of the key points that are likely to show up on the RockOn quiz. "We need more sand or the beach will wash away..."
Video: Submarine Beaches, a parody of the Beatles' "Yellow Submarine" (3:54)
A one, two, three.
RICHARD ALLEY: (SINGING) Near the town where we were born, there's an ocean, not far away. And you know when rocks get worn, they make sand for beaches where we play. Suppose you ride down onto the shore, just to while away your summer day. Splash no beach there anymore.
Could that happen here? What would you say? You'd say, we need more sand, or the beach will wash away. The beach will wash away. The beach will wash away. It guards the land, and the beach can wash away. The beach can wash away. the beach can wash away.
All the waves move sand about, mostly in and then right back out. Some will drift along the shore. Crashing winter breakers take out more. If sand falls too deep, it's gone down into the subduction zone. And it may take 10 million years, eruptions, weathering till new sand appears.
So we need more sand, or the beach will wash away. The beach will wash away. The beach will wash away. It guards the land, and the beach can wash away. Beach can wash away. Beach can wash away.
If we melt glaciers into mud, sand will disappear beneath the flood. Dams on rivers will impede lots of new sand beaches need. You will not have too much luck making beaches with your rubber duck. Chunks of houses might suffice. But for volleyball, that isn't nice.
So we need more sand, or the beach will wash away. The beach will wash away. The beach will wash away. It guards the land, and the beach can wash away. The beach can wash away. The beach can wash away.
If beaches fade beneath the sea, you might need a yellow submarine.
[LAUGHTER]
[MUSIC PLAYING]
Module 8 Wrap-Up
Module 8 Wrap-Up
Review Module Requirements
You have reached the end of Module 8! Double-check the list of requirements on the Welcome to Module 8 page and the Course Calendar to be sure you have completed all the activities required for this module.
Reminder
Continue to work on Exercise #4. See the Course Calendar for specific due dates.
Supplemental Materials
Following are some supplementary materials for Module 8. While you are not required to review these, you may find them interesting and helpful in preparing for the quiz!
- Website: Cape Cod National Seashore
- Website: Acadia National Park
Comments or Questions?
If you have any questions, send an email via Canvas, to ALL the Teachers and TAs. To do this, add each teacher individually in the “To” line of your email. By adding all the teachers, the TAs will be included. Failure to email ALL the teachers may result in a delayed or missed response. For detailed directions on how to do this, see How to send an email in GEOSC 10 in the Important Information module.
Module 9: Deep Time: Stratigraphy and the Sedimentary Record
Welcome to Module 9
Welcome to Module 9
Deep Time: Stratigraphy and the Sedimentary Record
With apologies to the great detective Sherlock Holmes, here is a brief introduction to the science of geological history and multiple working hypotheses, together with some bad Sherlock Holmes jokes. If you don’t know anything about Sherlock Holmes, just note that scientists and detectives can learn what caused events in the past. One way we do this is through “multiple working hypotheses”. After you observe something, you generate as many hypotheses as you can about what produced the thing you observed, figure out what each of the hypotheses predicts about additional things you could observe, and make those observations to see which of your hypotheses comes closest to being correct.
"Holmes, did you realize that this chess board is exactly 12 inches long?" I asked, as we sat across the table in our Baker Street lodgings.
"Come, Watson. The game is a foot," he replied. "We must explain the Giant Splat of Sue Matra's birthday."
"The Giant Splat? Holmes, I know that Sue Matra is a friend of your brother Mycroft, but how came she to have a giant splat on her birthday?"
"Sue returned home from her job as a scientist measuring the air speed of swallows carrying coconuts and discovered a splat on the floor. Here is a brief diagram of the situation."
Holmes rapidly sketched the following:
"This takes the cake," I commented sweetly, after studying the diagram.
"No," he replied, "The cake was left on Sue's floor."
"Holmes," I said, "You know that my medical training exposed me to the scientific method and that in my military experience, I conducted forensic investigations, learning what people died of. I was even exposed to geology and paleontology during my studies at the college. Your science of detection shares much with forensic medicine, and with the fields of geology and paleontology. Something has happened, and you try to determine what."
"Indeed, Watson, I am aware that you are among those few individuals who have been trained to reason from effects to causes, so unusual in a world full of people who reason only from causes to effects."
"But it is more than that, Holmes. When faced with an effect, we quickly try to think of all possible causes that are consistent with the available data and with our other knowledge about the world—call these 'multiple working hypotheses'. Then, we see what each of them predicts that we might discover or measure—each possible hypothesis is a possible cause, and we reason to its effects in the same way that other people reason from causes to effects. But we go further, and we make those measurements or observations that will identify the effects of each of our likely causes, using the results to eliminate some of the hypotheses. For example, if we postulate that a horse stomped on the cake to make the giant splat, then we expect the mark of a horseshoe in the cake."
"Even if the horse missed, the shaking of the ground might have caused the cake to fall. Close counts in horseshoes and hand grenades, as you know."
I ignored his attempted witticism, and said, "Holmes, allow me to send a few telegrams to test some hypotheses, and we will soon have the answers."
An hour later, I was ready to explain the giant splat to Holmes. "Sue Matra is married to a diligent and helpful husband, who is also an amateur cook. He confirms that he was baking a birthday cake for Sue, and made it in three layers, putting down a layer of cake, then icing, cake, icing, cake, icing. Then, he put candles in, and carefully carried the cake across the study toward a table. Unfortunately, the couple owns a large and boisterous retrieving dog, which jumped up and took a large bite out of the cake."
"The curious incident of the dog in the daytime," Holmes muttered.
"Yes," I said, "the dog did much in the daytime. You will notice that your highly accurate sketch shows that the dog's bite has severed one candle, and that the candle was shoved through the icing, so the order of events is clear. The actions of the dog so surprised the husband that he dropped the cake, which was unbalanced by the dog anyway. Given the height from which it dropped, and the rotation imparted by the dog, the cake flipped halfway over and splatted to the floor. The husband, distraught, and worried lest the suddenly sweetened canine should have an accident on the floor, took the beast for a walk, and during this interval, Sue returned home and discovered the splat."
"And how," asked Holmes, "did you determine that the dog bite occurred before the splat."
"If the splat occurred first and the dog then bit the splatted cake, the bite would not run smoothly through the whole thickness of cake, or else the dog's teeth would have scarred the floor or become stuck in the wood, yet the bite through the cake runs smoothly the whole way."
"Well," said Holmes, "I hope they have some good old H2O to clean up the mess."
"Elementary, Holmes," I replied, "elementary."
Could you have explained Sue's splat? If so, you understand some of the secrets of being a geologist. If not, then stick with us, and you should have it figured out by the end of the module.
Video: The Cake (3:31)
It's the weekend, and you're baking a cake for the game for the big game. And so you put down a layer of cake like this. And then it's gotta be for the Penn State game. So then you're going to put in a little blue icing, so it's more enjoyable. And you're going to make another layer cake on top of that, still sitting there. Boy, you're a good baker. It's really very impressive.
And we'll put some more Penn State blue icing in the middle. And then you put down one more layer of cake to make the top of the thing. And wow, this is getting to be fairly serious when all is said and done. And then you're going to ice the top of that, and wow, isn't that beautiful?
And then you want to put some candles on. It's going to be a Wisconsin game, and Wisconsin's going to get burned. So you better put on some Wisconsin red candles, and they have a little wick sitting out the top of them like that. And then you're carrying the cake across the floor and your big dog comes up and takes a gimungous bite out of your cake, which doesn't necessarily make you entirely happy. And so now your cake is going to look something more like this with this big hole out of it. And the hole goes all the way down, something like that.
Oh dear, what a mess the dog made out of the cake. And you're really very, very unhappy about what your dog did to it because you were carrying the cake while this happened, and you happen to know that if you're carrying the cake while it happens that you may lose your grip, and the cake turns upside-down, which is now a real mess, and the candles gets scrunched, and so they're no longer sticking down the way they're supposed to be. They're actually sort of sticking off to the side the way they get bent over.
Now, if you were to see this, if you were to find this cake on the floor, you would have absolutely no trouble telling what happened, and the sequence of events in which they happened. In the same way, a geologist faced with something such as a rock viewed edge on that has some mud cracks in it like this, there's a crack, says oh, this rock is right-side up, it has not been turned over because we know that when mud cracks, that the cracks go down in the rock, not up.
In the same sense, if the geologist was faced with some sort of a footprint, and let's make a dinosaur footprint here if you would like to. Do, de-do, de-do. Here's the big footprint. OK. And the footprint is stuck down in the rock, something like that. And so you can see this is how it might have happened somehow. And that's not the world's finest footprint drawing, but you get the idea what we're trying to do. That has been shoved down into a rock so there's a big hole here where the footprint was made.
If you were to happen to find that footprint, and you're going to have to find that footprint as being upside-down, as we can make it very easily with the foot vertically, you wouldn't know that. And so geologists do that. They can put things in order in the same way you that could look a that squished cake and put it in order.
Learning Objectives
-
Understand that sedimentary rocks are produced from sediments by well-understood processes.
-
Explain how characteristics of sediments and sedimentary rocks, and the fossils they contain, reveal the conditions under which they formed.
-
Be able to interpret sediments and sedimentary rocks to put them in geological order.
-
Explain how putting sedimentary rocks in order puts their fossil types in order, showing gradual changes over long periods of time.
What to do for Module 9?
You will have one week to complete Module 9. See the course calendar in Canvas for specific due dates.
Questions?
If you have any questions, send an email via Canvas, to ALL the Teachers and TAs. To do this, add each teacher individually in the “To” line of your email. By adding all the teachers, the TAs will be included. Failure to email ALL the teachers may result in a delayed or missed response. For detailed directions on how to do this, see How to send an email in GEOSC 10 in the Important Information module.
This course is offered as part of the Repository of Open and Affordable Materials at Penn State. You are welcome to use and reuse materials that appear on this site (other than those copyrighted by others) subject to the licensing agreement linked to the bottom of this and every page. Students registered for this Penn State course gain access to assignments and instructor feedback and earn academic credit. Information about registering for this course is available from the Office of the University Registrar.
Main Topics: Module 9
Overview of the main topics you will encounter in Module
Nice Bryce: Stories in Sediment
- We saw earlier that weathering changes large rocks into small pieces and salts.
- And we saw that after being transported, these small pieces and salts are deposited as sediment.
- Sediment, then, is slowly changed to sedimentary rock.
- Transformation is NOT magic, but happens because:
- Hard water deposits cement grains together;
- Squeezing from the weight of more sediment compacts, shoving grains closer together;
- Recrystallization, as new minerals grow, creates interlocking grains.
Classy classification
- We generally classify sedimentary rocks as either clastic (made of clasts- another name for pieces) or precipitates (made of materials precipitated from dissolved salts, such as rock salt or Death Valley borax).
- Limestone might be called both clastic and precipitated because it is often made of shells that are clasts, but shells are made of materials that creatures precipitated from water.
- We generally subclassify non-limestone clastic rocks by the size of the clasts:
- Clay (tiny) makes claystone, also called shale;
- Silt (small) makes siltstone;
- Sand (bigger) makes sandstone;
- Cobbles (still bigger) make cobblestones, and boulders (even bigger) make boulderstones; both are often called conglomerates.
Environment is Evident
- Clues in the rock tell the environment in which the sediment was deposited. For example:
- Sand dunes and lizard tracks indicate a desert
- Quiet-water muds and fish fossils indicate a lake
- Corals and shells indicate a reef in the ocean
- Many studies were required to learn the rock types that different environments produce, but now this is well-known.
May I Take Your Order?
- Something must exist before it can be moved or cut; a clastic rock is younger (that is, formed more recently) than the clasts it is made of, and a fault is younger than the rocks that it cuts.
- Sediment layers initially are nearly horizontal (mass wasting flattens steep clastic layers).
- Layers on top are younger than those below (called the Principle of Superposition).
- After being hardened by hard-water deposits, etc., layers may be tipped up or turned over; however, the rocks contain many "up" indicators that tell us which way was right-side up when the sediment was deposited, so we can learn whether it was turned over.
Getting Into "Up" Indicators
- Mud cracks, footprints, and raindrop imprints go down into the mud.
- Tops of slightly slanting sand-dune layers are eroded by wind.
- Shells on a beach are typically flipped into the stable hollow-side-down position.
- Bubbles rise toward the tops of lava flows.
Nothing Succeeds Like Succession
- Using these rules, we can put rocks in order from oldest to youngest.
- Remarkably, this puts fossils in order, so the more similar in age, the more similar in type—we call this the "Law" of Faunal Succession.
- Gives geologic time scale:
- Cenozoic=New Life, Age of Mammals
- Mesozoic=Middle Life, Age of Dinosaurs
- Paleozoic=Old Life, Age of Shellfish
- Precambrian=really old, Age of Algae
Bryce Canyon National Park
Bryce Canyon National Park
Bryce Canyon is a fairyland. Pillars, spires, and minarets, seemingly fragile and toy-like when viewed from the rim, tower far above the hiker who descends into the “canyon,” which is a bowl carved out of the edge of a plateau. The morning sun, bouncing off the pink and pastel walls, casts a rosy glow on everything and everyone in the canyon. Gnarled trees cling to high slopes, their root structure exposed by erosion but somehow holding and nourishing the twisted branches. The old settler Ebenezer Bryce called the scenery of this tributary of the Paria River “a hell of a place to lose a cow,” but almost everyone who followed him has had a kinder assessment.
The main pink rocks of Bryce are a mixture of limestones, shales, and some coarser sandstones and conglomerates, deposited in a lake or a series of lakes, and together are known as the Claron Formation or the Bryce Limestone. (Geologists studying regions have found it useful to give specific names to recognizable bodies of rock, with the names taken from geographic locations. Because the criterion for a new name is the ability to recognize a unit in the field, some careful observers like to subdivide, and others like to lump, so there is often slight disagreement as to which name is most appropriate.) These Bryce rocks are from the early part of the Cenozoic, roughly 40 million years ago. The rocks record a generally wet time shortly following the uplift of the land from a shallow seaway, and before continued uplift led to the high plateaus of today, and climate change dried the surroundings to the dry climate now at Bryce.
Some of this story is told in the rocks of Bryce. The rest is told nearby. Northeast of Bryce in central Utah, the rocks record the gradual transition from undersea to terrestrial. The growth and erosion of mountains to the west are marked by the appearance and then disappearance of coarse braided-stream deposits. These were replaced by slower streams, then by lakes, then another pulse of river sediments, and then the great Green River lakes that spread from Bryce to Wyoming and that record a wet, warm time in the west.
Geologists love to tell stories like this one. The seas came in, the seas went out, the mountains rose, and the mountains were eroded. Such stories are useful because they often include chapters such as “The oil formed here and migrated there, and was trapped in those rocks, and we can drill into it this way and get rich." (Or, the stories may involve gold, or lithium, or rare earth elements, or clean water, or other things we need). Such stories tell us much about the stability of the Earth’s climate. And the stories are interesting to many people. But how do you read such stories, and gain confidence in them? One way to find out is to major in Geosciences and spend the next three years learning to do so professionally—in case you’re interested, talk to us! But if you’re excited about the great career prospects in your current major of theatre or philosophy or whatever else you are studying, at least read over the next few sections and you’ll get a brief sketch of geological techniques and what they tell us.
We saw at the Badlands that weather attacks and breaks down rocks, and we saw at the Tetons, in Canyonlands, and elsewhere, how the loose pieces are transported. The processes of weathering and erosion produce new minerals from old, produce small pieces from big ones, produce dissolved salts, and move these around on the surface of the Earth. Eventually, these materials end up somewhere. The pieces that are derived from older rocks and the deposited we call sediment. Sediment may be deposited on the bottom of a sea, on the flood plain of a river, or at the end of a glacier. Sediment may stay for a while and then be moved on. If it stays for too long, it may be hardened.
There is no magic in making rock from sediment, nor is there an abrupt line separating the two. Many processes slowly transform loose pieces into pieces stuck together. If you don’t believe that loose pieces get stuck together, go to an old house and try to remove some piece of plumbing without using a big wrench, or try to get pieces off an old bicycle without a big wrench. If you don’t have the time, trust us—people make big wrenches for a good reason! Nature does cause changes that bond things together in many cases.
The weight of additional material deposited on top of the sediment layer will squeeze it, forcing grains together and pushing water out. The resulting material is harder than what was there before. Continued squeezing and heating as sediment is buried (remember that the Mississippi Delta is many miles thick) produce rock from this sediment and may eventually change these sedimentary rocks to metamorphic rocks. The clays in sediment change into different clays and then into other things as the cooking proceeds (just as flour and water and yeast make cookies in the oven), and as the crystals of the new minerals grow, they tend to wrap around each other and get “woven” together in an interlocking mass, so they are hard to separate.
Groundwater circulating through sediments will dissolve minerals in some places and precipitate them in others, in response to subtle changes in temperature, pressure, or chemistry. We saw that there is dissolved rock in Spring Creek water, and in all other waters. If you have “hard” water, of the sort that causes people to buy water softeners, that means the water has a lot of dissolved rock and especially dissolved limestone. The white deposit that builds up on drinking glasses in houses with hard water is not soap scum but rock, very similar to stalactites in a cave. A lot of the sticking-together of plumbing pieces is linked to minerals precipitated from hard water. What happens in your house can happen in nature, where the precipitate serves as a cement that binds particles together. This cementation, together with the compaction from squeezing and the recrystallization from heating and changing clays and other minerals, slowly turns loose sediment into sedimentary rock. Sometimes, rocks are made entirely of hard-water deposits—stalactites are an example, but so are the salt deposits containing borax and other materials left in the bottom of Death Valley when the water that runs down from the nearby mountains quickly evaporates. Rocks made entirely of precipitate are also called sedimentary rocks.
Take a Tour of Bryce Canyon National Park
Want to see more?
Here is another optional tour you might also want to take! (No, this won't be on the quiz!)
Bryce Canyon National Park
(Provided by USGS)
Classification of Sedimentary Rocks
Classification of Sedimentary Rocks
Our classification of sedimentary rocks is a bit of a hodge-podge. We first consider whether a rock is clastic (made from pieces or clasts of older rocks) or chemically precipitated (deposited from chemicals dissolved in water). This subdivision is not always satisfactory—a sea shell is a chemical precipitate because the animal pulled the material in its shell from the water, but a limestone made up of sea shells might be called clastic because the sea shells are chunks. Usually, people consider limestones and evaporites (rocks left by the evaporation of water containing salts) to be chemical precipitates, and all others to be clastics.
Clastics are classified further based primarily on grain size. The very smallest particles of clay make claystone, also called shale. Slightly coarser pieces are silt and make siltstone. Coarser still is sand, which makes sandstone. Going to still-bigger clasts, cobbles, and boulders produce cobblestone and boulder-stone, but we also call both of these conglomerates.
Conglomerate within a Conglomerate: Sevier Fault near Bryce Canyon National Park
Geologists read rocks, and the stories are fascinating--historical novels full of intrigue. In this next GeoClip, Dave Janesko and Dr. Alley perch high up in Red Canyon just west of Bryce and read one of those stories of deep time.
A conglomerate is a sedimentary rock in which many of the clasts are bigger than sand. Dave and Dr. Alley are looking at a conglomerate that includes many different clast types, including one that is itself a finer-grained conglomerate. The clasts in that conglomerate-within-a-conglomerate include several types of sedimentary rocks, including sandstones that are themselves made from older pieces.
Video: Conglomerates, Sevier Fault, Dixie National Forest (3:05)
Um, maybe. I can kind of break it out.
No, that's a conglomerate, isn't it?
Yeah. It is. Look at that, babe. That's the conglomerate we were looking for. Just look at that! Isn't that a beauty?
It is.
A conglomerate in a conglomerate. What do you make of the class in the little one?
It looks like sandstone and limestone to me.
Deep time. Deep time!
Very deep.
We got deep time! This is just beautiful.
A conglomerate classed in a conglomerate?
A conglomerate, you have to have sand grains glued together to make sandstone, broken and rolled to round them off, because this is rounded. And you have to have an ocean or a lake that has things living in it, precipitating calcium carbonate to make a limestone, broken loose and rounded off. And then those have to get together in a beach or in a stream channel. They have to be deposited with sand around them, then they have to be cemented together with hard water deposits. Then that has to be broken out, rolled in a stream and rounded, put together with all these other rocks coming from every which way. All of those then have to be glued together with hard water deposits. And then we have to get from the stream or the lake or whatever it was that was making these, up here in the middle of the desert on a cliff. And it's all in that one rock right there. And there's really no other way to explain that rock.
In geology, we often meet people who tell us that we do not know what we're talking about, that the world looks like it is very, very young, that there's nothing in the world older than written history. We never tell those people that they're wrong, that they're false, that they've been led astray. But we can tell these people, it looks old, that the scientific interpretation, the best way to look at these rocks, is that they tell of vast, deep time. So when one looks at a rock like this one that has little tiny remnants of old rocks glued together into a rock which is bounced around in the stream and rounded, that then is glued in with a whole bunch of other rocks into another rock that has been bounced around in a stream and rounded, that is sitting here glued with a bunch of these things on a cliff in the desert-- it is very hard to imagine how this could be something that is only 6,000 years old. And so all we do in science is, what can we observe? What can we test? And what we can observe, what we can test says, really, really old.
Reading Sedimentary Rocks
Reading Sedimentary Rocks
We learn about the past through sediment. Archaeologists dig up the garbage dumps and houses of past people to learn how they lived. Historians root through the intellectual sediment of people to learn what they have done. Sedimentary rocks, in the same way, tell the history of the surface of the Earth.
A typical sedimentary rock contains all sorts of clues as to how it came to be. The clast size or grain size is a measure of the energy of transport—tiny clay particles will not settle out of a swift mountain stream, so a fine-grained deposit indicates slow or no currents. Grain shape tells more—an angular clast has not been transported far in water or wind, because during transport sharp corners are knocked off and the clast becomes rounded. Sorting also tells something—wind and water sort sediments by size, but landslides and glacier ice do not, so the sand grains on a beach are all approximately the same size, but a landslide leaves a deposit that ranges from minuscule clay-sized particles up to house-sized boulders and, sadly, pieces of real houses.
Composition provides clues—olivine is a mineral that is changed rapidly by chemical weathering and occurs primarily in low-silica igneous rocks such as sea-floor basalts, so if you find olivine grains in a sandstone, you know both that the sand was derived from such rocks, and that the sand was not transported very far in a wet environment because the olivine was not broken down. Even surface textures have information—the striations and polish of a glacier-transported rock look very different from the sand-blasted appearance of a quartz grain in a sand dune.
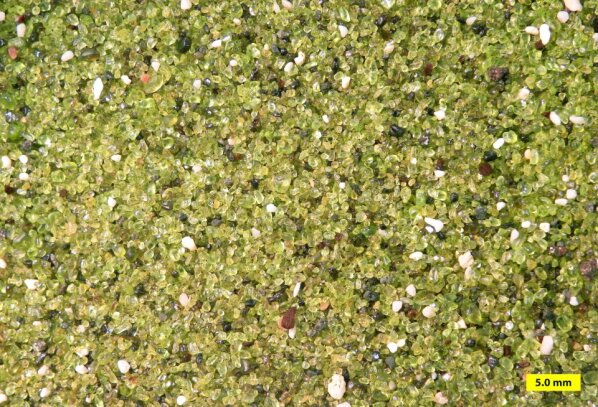
The sizes and shapes of deposits give further information. There are several ways to tell which way a current of wind or water was moving when it deposited a particular rock. For example, with sand dunes, the wind carries sand up a gradual slope and then dumps the sand over the top where it avalanches down and forms a steeper slope. When we find the gentle and steeper slope in the rock, we can tell which way the wind was blowing. Sand ripples and bars deposited by flowing water have similar indicators. A sand body deposited by a stream is often long and skinny in the direction the stream was flowing. A “fossil” sandy beach may be long and skinny like a stream deposit, but the current directions caused by waves will be pointing more-or-less across a beach but along a stream, so there is not much danger of confusing one type of deposit for another.
The list of indicators is very long. When mud dries out, it cracks to form mud cracks, as discussed in the Geomation and shown in the picture below. Such features are easily recognized in rocks and indicate occasional drying. Raindrops that spatter down on rocks leave little pock marks that are readily recognized if they are turned to stone and preserved.
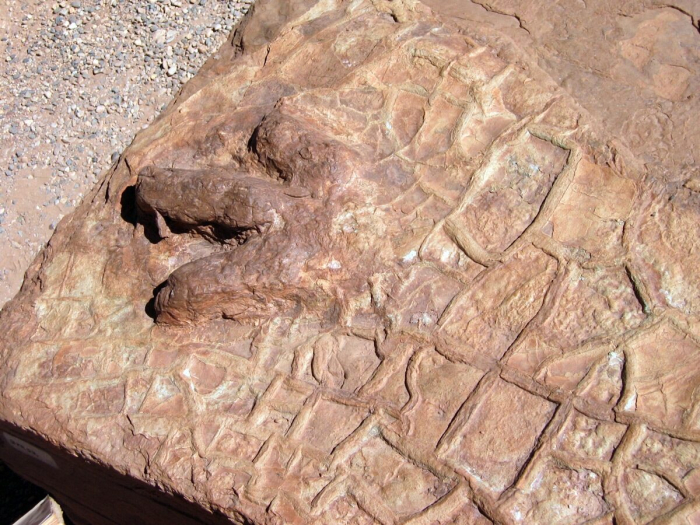
Added to this, we have the advantage of fossils. Tree trunks in growth position indicate a non-desert deposit on land—trees are replaced by cactus in desert environments, and by seaweed underwater. Coral skeletons indicate a reef in the ocean. Oysters grow in the ocean, as discussed in the Geomation just below.
ADD GEOMATION HERE
With such a wealth of information, we certainly should be able to read much of the story of the past. All that is required is that: 1) we study the rocks carefully; 2) we know what sorts of sediments are produced in what sorts of environments today; and 3) we make the common-sense assumption of “uniformitarianism”, that the present is the key to the past.
Suppose you go out today and observe that streams flow downhill and carry rock and mud from the hills to the sea. You dig around in a lot of different streams and find that they have sorted sedimentary beds, occasional fish fossils, and current-direction indicators pointing more-or-less the same way in many different sand bars, with sand bars of certain shapes and sizes and other characteristics that you can measure in many streams. You talk to people, read history books, and learn that streams have been flowing downhill and carrying rock and mud from the hills to the sea for a long time. You find a place where earlier people had diverted a stream into a canal, and you dig up the old stream bed, and find that it looks just like modern stream beds. You find still older deposits that look exactly like modern stream beds, and you find deposits in which the sand has been cemented by hard-water deposits to make sandstone, but everything else looks just like modern stream beds.
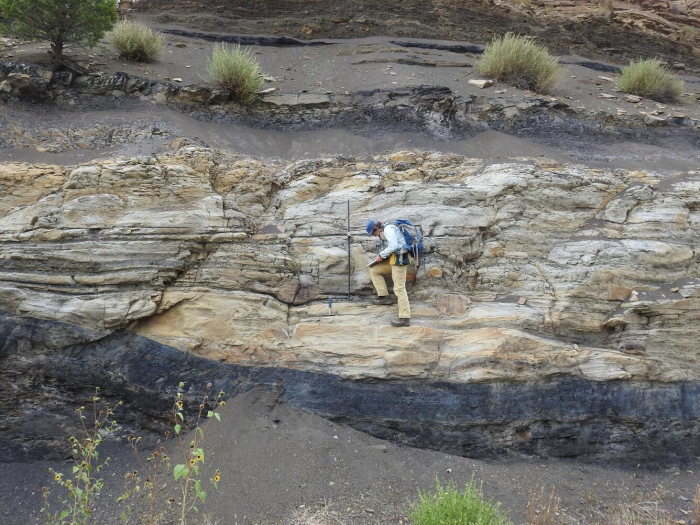
The reasonable person would say that these “fossil” cemented-to-stone stream beds are indeed old stream beds. Of course, we cannot prove that they are. Perhaps space aliens made the world the year before you were born in such a way that it looks like there were old streams, and the aliens invented all the history books and fake memories of old people. Calvin (of the Calvin and Hobbes comic strip) once told Susie that their class was having a substitute teacher because “our REAL teacher rocketed back to Saturn to report to her superiors. They’re trying to subvert us little kids with subliminal messages in our textbooks, telling us to turn in our parents when the Saturnians attack. Earth will be rendered helpless! I’m too smart for ‘em, though! I don’t read my assignments!” (To which Susie replied, “I think one of us has been eating too much paste in art class.”) Maybe Calvin is right. And maybe the Geology-of-National-Parks professors are Saturnian aliens, too! The textbook author, Dr. Alley, has really strange-looking hair where it hasn’t fallen out, and acts a bit peculiarly, you know.
However, despite his occasional interest in the topic, Calvin had not quite mastered geologic thought. Geologists take the common-sense approach: if it looks like a duck and walks like a duck, and quacks like a duck, is genetically identical to type specimens of ducks, has a bone structure as observed in x-ray examination that matches known duck bone structure, mates with other ducks and produces duck offspring, etc., we call it a duck. If it looks like a stream deposit in size, shape, arrangement, location, grain size, sedimentary structures, fossils, etc., we call it a stream deposit. We learn from the present—what streams do, what they make, where they occur—and then we use that knowledge as the key to interpreting the past.
Learning accurately from the present is not easy. By working hard in one or two advanced courses, an adept student can learn to distinguish most of the main deposits—streams versus lakes versus beaches, for example. Many geologists spend their whole lives learning what stream deposits look like, how they form, etc., while others spend their lives working on beaches, lakes, or glaciers.
When lots of these experts agree that the limestones of Bryce and its surroundings were deposited in a shallow lake and adjacent streams and mud flats, you should know that the rock type (limestone, but with differences in chemistry and texture from limestones forming in oceans), the fossils (algae, fish fossils, alligator bones, bird tracks), the structures (mud cracks, raindrop imprints), etc., have been considered carefully in telling the story. We can’t rule out Calvin’s Saturnians, but a more down-to-earth explanation is more convincing.
Arches National Park
Arches National Park
Arches National Park is just outside of Moab, Utah, almost within shouting distance of Canyonlands. Arches National Park has the largest concentration of natural stone arches in the world, with dozens of major arches, numerous other holes, and many more interesting rock features. The longest natural arch in the USAis there, Landscape Arch, spanning about 300 feet (almost 100 meters). Several rockfalls have occurred from Landscape Arch since European settlers arrived, reducing the arch to a thickness of only 11 feet (3 m) in its thinnest part. The trail under the arch has been closed; the Park Service knows that eventually more rocks, and the whole arch, will fall, and the rangers do not wish to be involved in extracting compacted humans from beneath the remnants of what used to be the USA’s longest arch.
The arches are all eroded in sandstone, especially the mid-Mesozoic (deposited during the time of dinosaurs) Entrada Sandstone, which includes both marine and wind-blown sands. Arch formation started with the deposition of thick beds of salt in the Arches area. Sediments including the Entrada sands were deposited on top of the salt, and cemented by hard-water deposits to make sandstone. When the weight of those sediments became large enough, the salt began to flow, squeezed from places where thicker sediments caused higher pressure on the salt, to places where thinner sediments gave lower pressure, like ketchup in a fast-food packet squeezed from one place to another. However, the foil wrapping of a fast-food packet is fairly flexible, but the Entrada sandstone was not, so as the salt moved, the tough sandstone broke, forming cracks called joints. The most common joints formed by this motion are parallel, nearly vertically oriented, and a few yards (or meters) apart. Weathering processes attacked the rocks along these joints, which were slowly widened to leave vertical slabs of rock called fins.
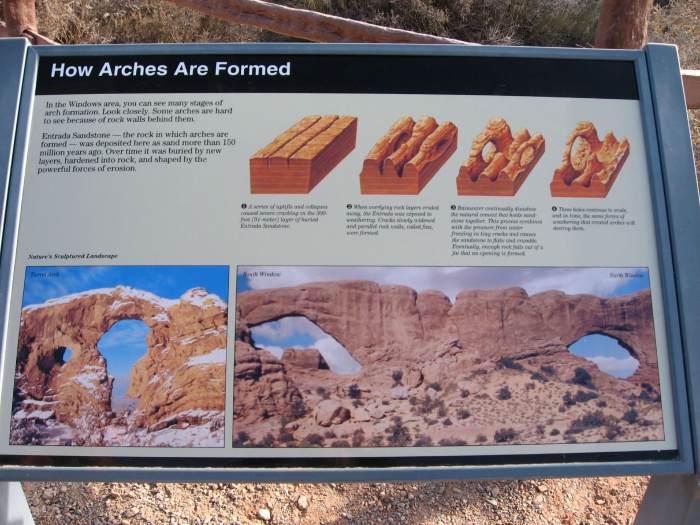
Some weathering and erosion processes are more effective near the ground than high up. For example, you will see huge steel bolts sunk into the rock of some road cuts just above the highway to keep the weight of the rock above from popping slabs of rock loose that might blast into the road and kill people; such rock-bursts also occur in quarries if actions are not taken to avoid them. When such slabs of rock break from a cliff or fin or fall, they often leave a curved or arch-like top, because it is easier to break off a curve than a square-cornered piece. This process is among those that contribute to the arch formation, breaking through the fins to make beautiful stone arches.
Stratigraphy
Stratigraphy
The earlier text says that the Entrada Sandstone is from near the middle of a time we call the Mesozoic, an Era of geologic history, and for Bryce, our text told you that Bryce Limestone is from early in the Cenozoic Era of geologic time. You have not been asked to learn these terms yet (but you will be, so you might want to lodge them in your brain now). The Mesozoic is older than the Cenozoic, so the Entrada is older than the Bryce. How do we tell which layers are older or younger?
Putting rocks in order is an enjoyable puzzle requiring the logic used in sudoku or crossword puzzles. You rely on a few general principles that boil down to common sense, plus a lot of puzzling, looking, and thinking. Start with “What’s on top”? As we saw with Hurricane Katrina in New Orleans, the layer of mud that settles out of floodwaters is deposited on top of the mud, grass, floor tiles, and grand pianos of the floodplain. Naturally, the mud from the next year's flood is deposited on top of the mud from this year (nature doesn’t clean off the grand piano). In ordinary sedimentary rocks, the youngest rocks are on top and the oldest are on the bottom. We call this the Principle of Superposition.
Note that this applies to ordinary rocks. There are cases in which rocks are turned upside down. Take a sheet of paper on your desk, put your fingers on opposite sides, and squeeze your fingers and the ends of the piece of paper towards each other (see the figure above). The paper will buckle into a fold. If you can get your fingers close together, the fold may “fall over”. A vertical hole through your paper would now go through the top of the page and out the bottom, then through the bottom of the page and out the top, before finally going through the top and then the bottom—going from top to bottom, the paper is right-side up, then upside-down, then right-side up (look at the figure again).
Fortunately, many “up” indicators in rocks tell you which way was up when the rock was formed. Animal tracks and raindrop imprints are made down into mud, not up. If you find a track pressed up into the roof of a cave, it is reasonable to suppose that the track originally went down but then has been turned over, so it is now upside-down. (Bats can hang from the ceiling, but dinosaurs did not walk upside-down on cave ceilings!) Mud cracks get narrower going down and disappear at the bottom, not the top. Curved clam shells are usually flipped by currents into the stable, hollow-side-down configuration, rather than the rocking, hollow-side-up configuration. Bubbles in lava flow rise to the top where they are trapped just beneath the quick-cooled upper surface; the bubbles do not sink down to the bottom. (We saw a little of this with the dinosaur track and mud cracks in the picture on the Bryce page, and you will meet more of this in the Rockin' Review of this chapter and also in Exercise 4. So if you are having trouble visualizing any of it, stay tuned for more.) Hence, you can learn whether the rocks have been turned upside-down or not.
In clastic sedimentary rocks, the clasts must be older than the rock. So a conglomerate containing pieces of granite and other things tells of the formation of granite from melted older rock, followed by physical erosion to break the granite into pieces, followed by transport to mix the granite pieces with chunks of other rocks, followed by deposition of the chunks followed by hard-water cementation to make the conglomerate rock. A conglomerate containing pieces of sandstone from a beach tells of two cycles—make the sand from older rocks (perhaps from the breakdown of granite by chemical weathering), followed by transport of the sand to a beach, followed by cementation of the sand with hard-water deposits to make sandstone, followed by physical weathering of the sandstone to make sandstone chunks, followed by transport of the chunks and mixing with others and deposition and cementation to make the conglomerate. In the video with Dave Janesko earlier in this module, a conglomerate contained a clast of an earlier conglomerate that contained clasts of still earlier sedimentary rocks. If a fault has split a granite clast in a conglomerate, and moved one side relative to the other so that the pieces no longer match, the fault must be younger than the conglomerate—something must exist before you can break it. If a layer of sandstone is standing on edge then it must have been deposited, hardened, and then tilted—because of mass-movement processes, layers are nearly horizontal when deposited (not exactly, but pretty close); if you tip a mud layer up on end before it has hardened, it spreads into a new, nearly horizontal layer.
Below is a photograph of an outcrop near I-70 in the near-desert conditions of central Utah (shown on the left), and a sketch of the outcrop (shown on the right). The rocks at the bottom were deposited on a sea coast—they contain marine fossils and other markers of the sea and are mostly sandstone and shale. But they are standing on edge and truncated at the top. Developed on the top of them is a soil, and on top of that are lake deposits with flamingo bones, fish fossils, and alligator bones.
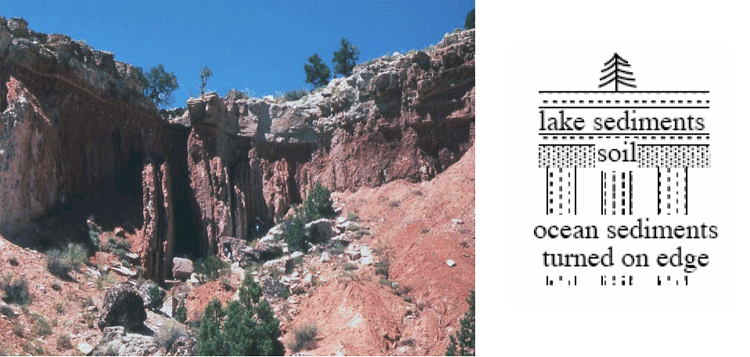
The story of this outcrop includes:
- Some history to produce sand and mud and deliver them to the sea, where they were deposited and then hardened;
- A mountain-building episode to turn the rocks up on edge;
- Erosion to truncate the rocks, together with weathering to create the soil;
- Growth of a lake, with sediment accumulation in the lake;
- Drying or draining of the lake; and
- Erosion revealing the cross-section of the deposits that you see.
You can postulate many other things—Dr. Alley is just lying about the rocks; or, the space aliens put the rocks there; or, a giant tornado blew the rocks there one afternoon; or…. We humans are very inventive, and can always come up with a new idea. But when you follow out the implications of these other stories, some fundamental problem always comes up, whereas the story of the rocks being deposited and hardened and tipped on end and eroded and so on works just fine, and makes predictions that are borne out over and over. Hence, the “geological” or “scientific” interpretation is the sensible one.
Notice that the erosion surfaces [events 3 and 6 in the list above] represent time gaps in the sedimentary sequence; the rocks at this site do not have a record of the environment during the time erosion was occurring—you have to go to where rocks were being deposited to learn that. A time gap in a sedimentary sequence, whether from actual erosion or just lack of deposition, is called an “unconformity”. Most of the land experiences erosion most of the time—the mud in the Mississippi is eroded from the lands upstream, and most of us most of the time do not have to worry about mud being deposited on our grand pianos or carpets. But some sediments are deposited somewhere on land most of the time, and sediments are deposited almost everywhere almost all the time under the sea, allowing a fairly complete story to be told.
Fossils and Relative Time: The Law of Faunal Succession
Fossils and Relative Time: The Law of Faunal Succession
The text above explains how geologists can put rocks in time order from oldest to youngest. The job may be quite difficult, because some outcrops are covered by soil, water, or other rocks, because offsets on faults may be so large that rocks on opposite sides can’t be matched back up easily (remember the bear in Cade's Cove way back in the Great Smoky Mountains), etc. But the job can be done, tested, and found to be correct.
When this job is done, a remarkable result emerges. Many rocks contain fossils, and different rocks contain different fossils. Arranging the rocks in order reveals that the fossils also are arranged in order. Rocks of similar age from similar environments have similar fossils; rocks with a greater age difference also have a greater difference in their fossils. The younger a fossil is, the more it resembles things living today. This scientific result, that fossils succeed one another in a definite and recognizable order, is called the Law of Faunal Succession. “Law” here is not something passed in Congress; a scientific “law” such as this one is a successful summary of an immense number of different observations, and works very well in explaining and predicting many different things in many places and times.
The Law of Faunal Succession was developed in England by a 17th-century canal engineer/geologist named William Smith. He faced practical problems; digging in some rocks is easier than in others, some rocks hold canal water better than others, etc. If he crossed a river into a region where all the rocks were buried beneath soil and thus difficult to study, he wanted to know whether the rocks under that soil were the ones he wanted to build in, or whether the ones he wanted were younger or older, higher or lower, in the pile of rocks. Sometimes, a few fossils would be evident in a streambed or elsewhere. (He even checked on fossils that local farmers were using as weights for balances to weigh cheese!). He found that the fossils made his job easier by providing shortcuts for putting things in order.
Much later, faunal succession figured in the development of our understanding of biological evolution. But, remember that the Law of Faunal Succession is like so much good science—a practical idea that gives useful results and helps humans do things successfully.
The Geologic Time Scale
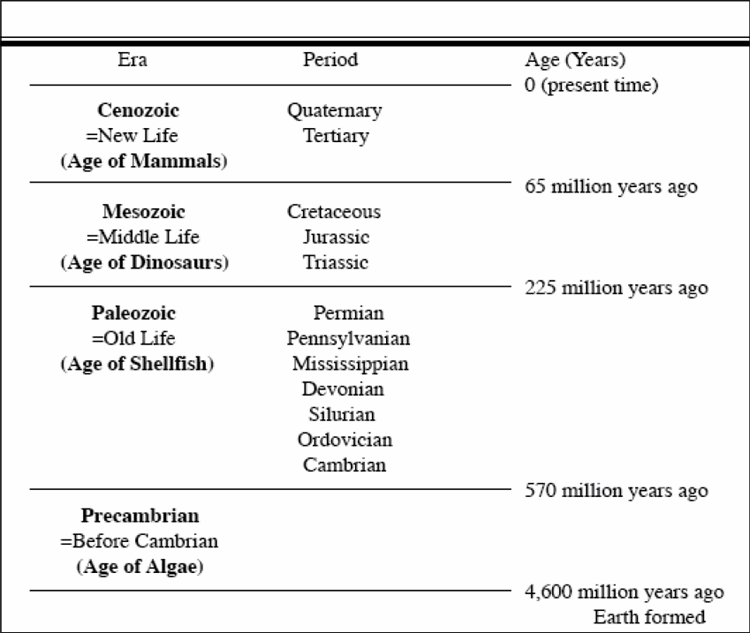
| Era | Period | Age since end of period(Years) |
|---|---|---|
| Cenozoic = New Life (Age of Mammals) | Quaternary, Tertiary | 0 (present time) |
| Mesozoic = Middle Life (Age of Dinosaurs) | Cretaceous, Jurassic, Triassic | 65 million years ago |
| Paleozoic = Old Life (Age of Shellfish) | Permian, Pennsylvanian, Mississippian, Devonian, Silurian, Ordovician, Cambrian | 225 million years ago |
| Precambrian = Before Cambrian (Age of Algae) | None Listed | 570 million years ago |
Geologists learned to put rocks and fossils in order long before calendar-year ages could be assigned accurately (how many years old is that?). Lacking accurate year counts, the early geologists agreed on a “shorthand” for describing ages. Time is divided into big chunks, called “eras,” which are divided into smaller chunks, or “periods,” and on into still smaller chunks. The big chunks (which you would be wise to know) are, from youngest to oldest, the Cenozoic (= new life), the Mesozoic (= middle life), and the Paleozoic (= old life).
The oldest period in the Paleozoic is called the Cambrian, and the rocks older than it are called the Precambrian. As the Precambrian includes most of the history of the Earth, more and more workers are using “-zoic” terms for pieces of it (see the Enrichment). The periods are mostly named for places where the rocks are well-exposed and where they were studied by early geologists, such as the Cambrian for Cambria (also known as Wales, a region to the west of England in the United Kingdom), Devonian for Devonshire in southwestern England, and the Pennsylvanian for Pennsylvania (Europeans usually lump the Mississippian and Pennsylvanian together and call that lump the Carboniferous, but the USA has such wonderful deposits of this age that we divide the Carboniferous to allow better time resolution). The youngest two periods are the Paleogene (“old generation”) and Neogene (“new generation”). In older reference works, you may see the Paleogene and the first part of the Neogene referred to as the Tertiary, with the more-recent part of the Neogene called the Quaternary; science progresses, but old books and old web sites often are not updated.
Life appeared early in the Precambrian, and multicelled organisms were present in the Precambrian. The Cambrian began with a great diversification of organisms with shells. Fossils older than the Cambrian are relatively rare because soft body parts usually are not fossilized; when shells appeared, they accumulated to make limestone layers, so fossils “suddenly” (over a few million years) became common. (But thanks to a lot of work, many fossils are known from the Precambrian now!). The Paleozoic and the Mesozoic ended with mass extinctions that probably killed a majority of organisms on Earth (we’ll return to this soon). The mass extinction at the end of the Mesozoic was caused by a meteorite impact. The mass extinction at the end of the Paleozoic was caused by global warming and chemical changes linked to a vast outpouring of carbon dioxide and other materials from the largest known flood basalt event in geological history.
Take a Tour of Arches National Park
GeoMations and GeoClips
All of the geomations/geoclips except these two were moved to content pages. Is there a place in the Module 9 content where you would recommend we place these two? I noticed we don't mention Capital Reef National Park in this Module.
Oysters! - Capitol Reef National Park
Rocks reveal how and where they were formed. Clues to the history of rock come from how it is put together, whether the pieces are big or little, sorted or mixed, angular or rounded, and so much more. Fossils also provide clues. Here, Dr. Alley and the CAUSE class are out in the desert at Capitol Reef National Park, but they are also in a shallow seaway from long ago. See why.
So we've been driving around the West, pointing at rocks-- there's a rock-- and saying, this is a sand dune. This is a lake. This is an ocean. But we haven't spent a lot of effort on, why do we say one is a sand dune, and one is a lake, and one is an ocean? Now in the case of the sand dune, when we looked at it, it was all sand. There were no little pieces, there were no big pieces, it was all intermediate size sand pieces. They had these structures that one sees in modern sand dunes. If you found anything that looked like a fossil, it was little reptile tracks. And so they had all the characteristics that you see in a modern sand dune.
Now here, we're in rocks that are very different. The rocks behind us are sort of washing away and they're making mud that washes down around our feet. And there's a number of characteristics of these, the layers are different, how big the grains are in them is different, sort of everything about them is different. And we can say these were rocks that were underwater. And we can go through the whole list of reasons why we can say they're underwater, but there's one very easy one. If we look down at our feet, and we look around at what's washing out of these rocks, what we find is oysters. And one can be very confident that if you find rocks full of oysters, you're not in the middle of the desert.
Mud Cracks - Capitol Reef National Park
Rocks occasionally are turned upside-down, but nature tells us when that happens. Mud cracks can show us that; they are wide at the top, narrow, and then end at the bottom. Fill mud cracks with another layer of sand or mud, and the cracks are "fossilized," to tell us which way was up when the rocks were deposited. Here, visit Capitol Reef with Dr. Anandakrishnan to see mud cracks, with a brief look at some right-side-up ones from the Grand Canyon.
[MUSIC PLAYING]
Look at this picture. You've got all these cracks developed over here. Imagine a second flood coming through here, a relatively gentle flood, water slowly flowing in here, a new layer of silt and sand and shales and clays. What's going to happen? All of that new material is going to filter down into these cracks and it's going to solidify in there as the water evaporates out of it.
So now 100 million years goes by. And we come along and we cut this open and we look at this layer and we look at these, and you'll see mud cracks. And we'll be able to tell that that layer of rock was oriented this way, because these mud cracks all start wide at the top and get narrow going downwards. And it quite often happens that these strata of rock, because of the incredible forces of nature of plates coming together, will take these layers and just flap them over upside-down. And we come along and we look at them, and you can't tell which way is up, which way is down until you find one of these mud cracks.
And then, even if the layer's upside-down, then you'll have these mud cracks teepeeing upwards. And you'll say, whoa-ho, this thing must've been flopped over and turned over upside-down. And it's the same processes-- I'm doing a Richard here. It's the same processes that produce these mud cracks, will fill them in, and then maybe after 100 million years, they'll get fossilized, turned into a hard clay layer, and then turned upside-down. But we'll still be able to tell what we call the stratigraphic relationship, the time relationship, which is older, which is younger, because clearly this is older than whatever would lay on top of it.
[MUSIC PLAYING]
Deep Time GeoClips (optional)
Deep Time GeoClips (optional)
During three weeks in May 2004, two hardy Penn State geoscientists traveled through 12 stunning National Parks of the southwestern United States with 13 great students. The trip was sponsored by CAUSE (Collaborative Active Undergraduate Student Experience), an annual course offered by the College of Earth and Mineral Sciences. Professor Richard Alley and Sridhar Anandakrishnan led the expedition. CAUSE 2004 was an extension of his course, "Geology of National Parks," and allowed students to interact with and learn from the rocks and landscapes of Arizona, Utah, and Colorado. In the following videos, Alley explains the concept of deep time, how it tells the history of our planet, and how it affects our lives.
Richard Alley, Ph.D., is Evan Pugh professor of geosciences in the College of Earth and Mineral Sciences, rba6@psu.edu.
—Emily Rowlands
What is Deep Time?
Deep Time and Beliefs
Deep Time and Climate Change
Deep Time and You, Part 1
Deep Time and You, Part 2
Optional Enrichment Article
Optional Enrichment Article
The Cenozoic, Mesozoic, and Paleozoic Eras are lumped together into the Phanerozoic Eon; “Phanerozoic” is from Greek roots meaning that life showed itself. The Phanerozoic started with the fairly sudden (over a few million years) appearances of common shells, which greatly “improved” the fossil record. You have to look hard to find the remains of a jellyfish in a rock, but with shells, the remains are the rock. Going back in time before the Phanerozoic are the Proterozoic (earlier life), the Archean or Archeozoic (beginning life; different people prefer to use the different words, Archean or Archeozoic), and the Hadean (like Hades; hellish).
The Hadean, from about 4.55 or 4.6 billion years to about 3.8 billion years ago, probably experienced such huge meteorite impacts that they vaporized the whole ocean and some rocks as well. Life would have had great difficulty surviving such catastrophes.
Life was present by the beginning of the Archean, about 3.8 billion years ago. The central regions of the continents had formed by the end of the Archean, about 2.5 billion years ago. Oxygen remained scarce or absent in the atmosphere and ocean, and carbon dioxide helped keep the world warm under the young sun that was not as bright as today.
In the Proterozoic, oxygen from cyanobacteria and other microbes “rusted” the oceans. Iron rusts with oxygen, but in the oxygen-poor world of the Archean, iron dissolved and washed into the ocean rather than rusting. As oxygen was released by photosynthesis, the iron was rusted and fell to the bottom to form the great banded iron formations that we mine today in Minnesota, Australia, and elsewhere.
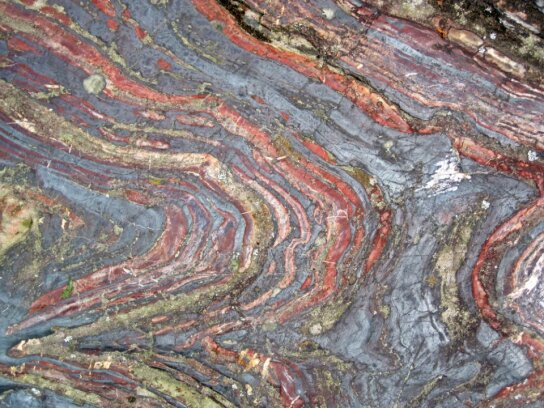
Oxygen then increased in the atmosphere. At first, oxygen was a poison to many living things because it is so highly chemically reactive. However, oxygen proved to be highly valuable as life figured out how to use the “new” chemical, allowing the development of larger organisms. Oxygen also shields all organisms from damaging ultraviolet rays by giving rise to protective ozone in the stratosphere. As oxygen rose in the atmosphere it removed other gases from the atmosphere by combining with gases there that were stable without oxygen. Some of those were strong greenhouse gases. Back then, the sun was not as bright as it is now, and warm temperatures were maintained by an atmosphere with more greenhouse gases than today. Carbon dioxide probably was still the most important, but others including methane probably contributed more than they do today. Removal of the methane and perhaps other complex greenhouse gases may have caused the “snowball Earth” events that nearly froze the planet.
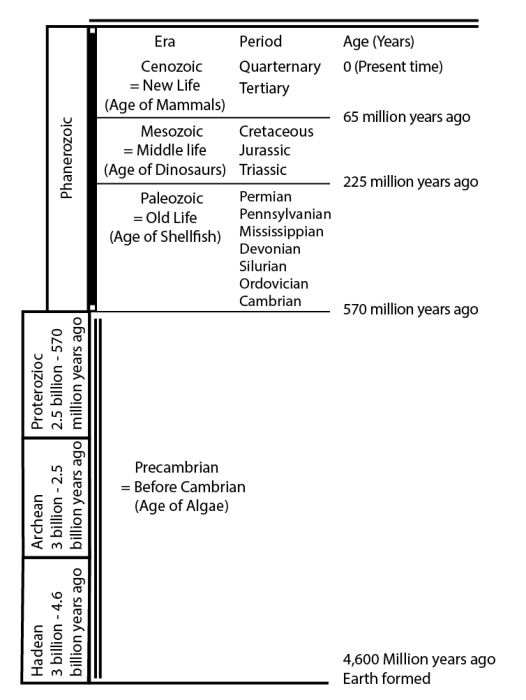
| Era | Period | Age (Years) |
|---|---|---|
| Cenozoic = New Life (age of mammals) |
Quaternary Tertiary |
0 (present time) |
|
Mesozoic = Middle Life |
Cretaceous |
65 million years ago |
|
Paleozoic = Old Life |
Permian |
225 million years ago |
| Era/Period | Age |
|---|---|
| Proterozoic | 2.5 billion - 570 million years ago |
| Archean | 3 billion - 2.5 billion years ago |
| Hadean | 3 billion - 4.6 billion years ago |
Want to see more?
What do beauty, saving money at Las Vegas, religion, oil exploration, emerging new diseases, and the planet’s recovery from global warming have in common? All in some way involve deep time, the immense age of the Earth. Eric Spielvogel filmed a discussion of these and other issues with Dr. Alley, for a special “time” issue of Research! Penn State. The Deep Time film clips on the previous page will give you something to think about, and may even help with the course. Enjoy! (No, these won't be on the quiz either!)
Sedimentation Models
(An extensive collection of animations on this subject)
Sequence Stratigraphy
(An extensive collection of animations on this subject)
A Rocking Review
A Rocking Review
Here's another look at learning which way is "up" when a rock layer is deposited. Dance on down with the dinosaur in this parody of Neil Sedaka's "Breaking Up Is Hard To Do".
Video: Down-Doo-Bee-Doo (3:19)
PRESENTER: If all that dancing has your head spinning so fast that you can't tell up from down, then this next song is just what you need. It was Neil Sedaka who said it first, "down, doo-bee-doo-down-down."
(SINGING) Footprints sink down, doo-bee-doo-down-down. Mudcracks grow down, doo-bee-doo-down-down. Raindrops imprint down, doo-bee-doo-down-down. They tell us which started up.
Don't let confusion rule your mind if footprints in the ceiling you find. 'Though mountain building turns it all around, the dinos always put their feet down. When sand falls behind a dune, a big gust blows the top off soon. And when the old dune sits beneath the new, the cut end started up. It's true!
They say that reading rocks is hard to do. Don't believe it. We know it's not true. No mountain building turns rocks over or on end. We know this occurred because the footprints started down, my friend.
Bubbles rise up, doo-bee-doo-up-up. Cross-bed cut-ends up, doo-bee-doo-up-up. Shells rocker-sided up, doo-bee-doo-up-up. They tell which way started down.
Take a look at a lava flow. Crust forms on top while it's soft below. The bubbles rise, but they can't get out. Lots of big ones near top, no doubt.
If cross-bed cut-ends don't point up or clamshell pieces make a loving cup, don't be alarmed, and don't wear a frown. The rock is just turned upside down. For history, you must know which came last, which came first in the distant past. Geologists can put 'em in a all in a row, 'cause the dinosaurs all put their feet down we know.
Footprints sink down, doo-bee-doo-down-down. Mudcracks grow down, doo-bee-doo-down-down. Raindrops imprint down, doo-bee-doo-down-down. They tell us which way started up.
Module 9 Wrap-Up
Module 9 Wrap-Up
Review Module Requirements
You have reached the end of Module 9! Double-check the list of requirements on the Welcome to Module 9 page and the Course Calendar to be sure you have completed all the activities required for this module.
Reminder
Exercise #4 is due and Exercise #5 opens this week. See the Course Calendar for specific due dates.
Supplemental Materials
Following are some supplementary materials for Module 9. While you are not required to review these, you may find them interesting and helpful in preparing for the quiz!
- Website: Arches National Park
- Website: Bryce Canyon National Park
Comments or Questions?
If you have any questions, send an email via Canvas, to ALL the Teachers and TAs. To do this, add each teacher individually in the “To” line of your email. By adding all the teachers, the TAs will be included. Failure to email ALL the teachers may result in a delayed or missed response. For detailed directions on how to do this, see How to send an email in GEOSC 10 in the Important Information module.
Module 10: Uniformitarianism & the Age of the Earth
Welcome to Module 10
Welcome to Module 10: Uniformitarianism and the Age of the Earth
In Module 9, we learned how to read the rock record and write the history of the Earth, learning what happened and putting those events in order. These techniques, and the history they tell, were worked out by pioneering geologists mostly in the 1700s and 1800s. Those pioneers knew they were studying a very long history, but they couldn’t put precise numbers on exactly how long. It took until the second half of the 1900s for scientists to develop the knowledge and the sensitive instruments needed to learn how many years ago the events happened. The answer is given in this short video comparing time to distance on a US football field, and then the rest of this Module tells you a little about how the answer was discovered, with visits to Great Basin National Park and the Grand Canyon.
Video: 100 Yards of Geologic Time (3:06 minutes)
Click Here for Transcript of 100 Yards of Geologic Time Video
It is 4.6 billion years ago. You were on the goal line Beaver Stadium and you have to drive 100 yards to today where you're taking Geosciences 10. The earth is forming 4.6 billion years ago. Giant meteorites are streaming in. And when they hit the surface, they make great explosions and collisions that heat the planet so much that they evaporate the ocean. And the last one of those that was big enough to evaporate the upper part of the ocean that was warmed by the sun and given energy by the sun is about 3.8 billion years ago, which leaves you 83 yards to drive to get to the goal.
Beyond this, the continents are forming. They're no longer getting blasted. And so you start to see continents show up that the cores of the modern things and they're sitting out there very nicely. And they are formed so that you get an idea of what the world is going to be like by about 2.5 billion years ago, which is a mere 54 yards to get your touchdown.
There are bacteria in the ocean and the bacteria are committing acts of flatulence. They're putting oxygen up. The oxygen changes the composition of the atmosphere, it changes the oceans, and it eventually allows bigger critters to appear. And those bigger creators include shelly critters which suddenly make lots of interesting rocks, limestones. And so you start to get lots of shells showing up about 570 million years ago, which is a mere 12 yards to get the goal line. The shells are doing really well.
And then there's a really bad day. The ocean gets very warm from greenhouse and it belches out bad gases and most of the things alive die. And that happens about 225 million years ago at the end of the Paleozoic which is only five yards from the goal.
That clears up space so that you start to get dinosaurs. And as you know, dinosaurs were really big and they're sort of cute critters. And so you start getting dinosaurs in the Mesozoic. And here is a dinosaur if you would like one. and the dinosaurs are having a fine time and they're smiling a lot.
But there's another meteorite coming. And so the big meteorite comes screaming in and it kills the dinosaurs, and that changes the world a lot. And that happens about 65 million years ago which is only one and a half yards from the goal.
That makes room for mammals to show up, and so you start to see mammals such as this elephant that you're about to see here. This elephant happens to be running away from you. And the elephant has some big ears and a really curly tail.
And that comes up to recorded history. And recorded history, 6,000 years ago, just a little over the thickness of a sheet of paper.
And finally, to the culmination of creation to you, who are born about 1/200th of the thickness of a sheet of paper from the goal line today.
Imagine that the 100 yards of Penn State's Beaver Stadium, or any other football field, are like a timeline of all of Earth's history, and you're the star of the team, driving for glory. The planet formed on your goal line, half of the Earth's history had passed as your team marched across the 50-yard line, and now the coach personally sent you, the acme of creation, to carry the ball across the opposition's goal line of today for the winning score. If you have been carrying the ball for the whole 20 years of your life, how far did you run? (If you're not 20 years old, pretend.)
Congratulations—tomorrow's newspaper will report that you gained just a shade under 0.0002 inch, or a bit less than 1/200 of the thickness of a sheet of paper. The defense was vanquished by your onslaught, and instant replay officials were not needed to see that you broke the plane of the goal.
Written history goes back slightly less than 6000 years or so, barely the thickness of a sheet of paper on the 100 yards of Earth's "dark backward and abysm of time," as Shakespeare called it. Geologists often feel sorry for people who have restricted themselves to writings and skipped the rocks—those people may have seen the instant replay of the touchdown, but they missed the thrill of the game. So come along and see what happened before you carried the ball for those last two ten-thousandths of an inch!
Learning Objectives
- Understand that geologists learn ages of events in many ways, including counting annual layers in deposits, calculating backward from rates at which observed processes occur, and using many different radioactive-decay techniques.
- Explain how the results of these dating techniques agree with written histories as far back as writing goes, and agree with each other in demonstrating a vastly longer geologic history.
- Remember that science does not claim to be the ultimate Truth, but recognize that the science underlying age dating is very strong and that within science there is no “other side” that conflicts with the results here.
What to do for Module 10?
You will have one week to complete Module 10. See the course calendar for specific due dates.
- Take the RockOn #10 Quiz
- Take the StudentsSpeak #10 Survey
- Submit Exercise #5
- Begin working on Exercise #6
Questions?
If you have any questions, send an email via Canvas, to ALL the Teachers and TAs. To do this, add each teacher individually in the “To” line of your email. By adding all the teachers, the TAs will be included. Failure to email ALL the teachers may result in a delayed or missed response. For detailed directions on how to do this, see How to send an email in GEOSC 10 in the Important Information module.
This course is offered as part of the Repository of Open and Affordable Materials at Penn State. You are welcome to use and reuse materials that appear on this site (other than those copyrighted by others) subject to the licensing agreement linked to the bottom of this and every page. Students registered for this Penn State course gain access to assignments and instructor feedback and earn academic credit. Information about registering for this course is available from the Office of the University Registrar.
Main Topics: Module 10
Overview of the main topics you will encounter in Module 10
We visit Grand Canyon National Park, Arizona in this module, so before getting to the material that is likely to be on a quiz, we’ll start with some important thoughts from President Theodore Roosevelt on the value of saving our national treasures, from his speech at the Canyon on May 6, 1903. President Roosevelt went on to protect the Canyon, first as a Game Preserve and then as a National Monument, and it was made a National Park in 2019 under President Wilson.
Leave it as it is. You cannot improve on it. The ages have been at work on it, and man can only mar it. What you can do is keep it for your children, your children’s children, and for all who come after you, as one of the great sights which every American...should see.
We have gotten past the stage, my fellow-citizens, when we are to be pardoned if we treat any part of our country as something to be skinned for two or three years for the use of the present generation, whether it is the forest, the water, the scenery. Whatever it is, handle it so that your children’s children will get the benefit of it.
Parsley, Sage, Rosemary and “Time”
- In Module 9, we did “relative time”—which came first?
- Now we spice it up with “absolute time”—how many years?
- Count annual layers, for accurate estimates, for “short times” (less than about 100,000 years);
- Calculate from recent rates and reconstructed effects, for less-accurate but still reliable and useful estimates, for short and long times (uniformitarian approach);
- Use radiometric (radioactive) techniques, for accurate estimates, for short and long times.
Annual layers
- Overlapping tree rings, to more than 12,000 years;
- Special-lake sediments, to more than 45,000 years;
- Ice-core layers, to more than 100,000 years;
- MANY checks, including:
- reproducibility of counting;
- agreement with historical records (chemically fingerprinted fallout of historically dated volcanic eruptions, etc.);
- consistency between ice, lake, and trees dates for ages of abrupt climate changes;
- agreement with radiometric and uniformitarian ages.
- MANY checks, including:
Old as the Hills
- Annual-layer records from geologically young materials (from ice sheets, trees, and lake sediments that have not turned to stone yet, on top of rocks) extend back much older than written history;
- Data are clear that Earth looks much older than written history;
- Most religions agree;
Rocks you see while climbing out of the Grand Canyon
- Metamorphosed old mountain range at the bottom;
- Eroded surface (unconformity), then two miles of sediments;
- Tipped by faulting, then another unconformity, then another mile of sediments with several unconformities within;
- Rocks are familiar types, with animal tracks, mud cracks, etc., at many different levels, and changes in fossil types from layer to layer going upward;
- North Rim rocks then slant down under younger rocks at Zion, which are under Bryce rocks, which are under younger rocks, which are under prehistoric archaeological sites…
- Roughly 100 million years to deposit sediments, plus time for old metamorphics, plus erosion…
Radiometric Dating
- Half of parent atoms decay to offspring in one half-life (easy to measure; don’t need to wait for a half-life to pass, just for a measurable change);
- Half-life fixed by the same physics that makes the sun shine and keeps us alive;
- Measured parent:offspring ratio today plus measured half-life give the age of sample;
- Requires a little care and attention;
- Agrees with written records, layer counts, uniformitarian calculations, other radiometric techniques, and more.
Radiometric Dating Example
- Potassium-40 parent included in solidified lava flows, but gaseous argon-40 offspring escapes before liquid lava solidifies;
- After lava solidifies, the additional argon-40 produced from decay of potassium-40 is trapped;
- 1.3-billion-year half-life;
- If you start with 400 parents, after one half-life (1.3 billion years) average 200 parents left (and 200 offspring), after second half-life (total 2.6 billion years) average 100 parents left (and 300 offspring), after third half-life (total 3.9 billion years) average 50 parents left (and 350 offspring), …
0.0002 Inches and a Cloud of Dust
- Oldest rocks are about 4 billion years old; Earth bombarded by meteorites and mostly melted before that;
- Meteorites formed with Earth; they are about 4.6 billion years old, the same age estimated from radioactive dates of the Earth;
- If 4.6 billion years is the 100-yard length of a football field, all written history is about the thickness of a sheet of paper, and a 20-year-old person has lived through 0.0002 inches.
Great Basin National Park
Great Basin National Park
Out in eastern Nevada, a long way from almost any city, is Great Basin National Park. The jewel of Great Basin is Lehman Caves, one of the most "decorated" caves known, with a wide range of odd cave formations (stalactites and stalagmites, but lots more, too). (Note that the name is plural—Lehman Caves—but it is just one cave. We’re not sure why.) Lehman Caves is dissolved into marble (metamorphosed limestone) on the side of Wheeler Peak, which rises to more than 13,000 feet (almost 4000 m), and which was glaciated during the ice age; only a very small glacier remains in the cirque (about 2 acres). Great Basin is one of the less-visited national parks, with yearly attendance not too much over 100,000 visitors, so you can find a lot of solitude and wonder in this beautiful place.
Far up on Wheeler Peak, Great Basin bristlecone pines are living. These gnarled, straggly trees grow slowly in high, cold places, whereas bristlecone pines growing in warmer, moister, lower-elevation sites live faster and die younger. In part because of this slow growth, the high-altitude trees can be very old. The oldest known living bristlecone pine is more than 4,600 years old, in the White Mountains of California. The oldest tree known so far was cut on Wheeler Peak in 1964, when the land was still administered by the U.S. Forest Service, as part of a study to learn more about the growth and behavior of the trees. Now known as Prometheus, that tree was 4,950 years old when cut. That one old-looking tree was not notably different from many others in the large grove. Because it is so unlikely that the first such tree cut on Wheeler Peak out of the many there would happen to be the oldest tree on Earth, it is likely that there are older trees out there that have not been sampled yet.
Take a Tour of Great Basin National Park and Lehman Caves
Want to see more?
Visit the Great Basin National Park website. While you are not required to review this, you may find it interesting and possibly even helpful in preparing for the quiz!
Dating with Tree Rings and Other Annual Layers
Dating with Tree Rings and Other Annual Layers
Video: Dating with Annual Layers (3:39)
Trees make annual layers, and some sedimentary deposits also have annual layers. The longest annual records extend much older than written histories, although they capture only a very small part of Earth’s long history. In this Module, we start with annual layers and then continue to look at other ways to learn the ages of events in Earth’s history. If you like video versions, here’s a short intro.
Here's a little more about annual layers that we can use for dating events. Shown here is a tree sample that grew on Mount Saint Helens, and those really skinny rings were formed right after an eruption in the year 1480 that dumped ash on the tree and made it grow poorly. Many tree ring studies use bristlecone pines. These are Cedar Breaks National Monument in Bryce Canyon National Park. Bristlecone pines can live a long time. They're really tough. They hang on. This beautiful picture of a bristlecone pine was taken by Penn State alum and Professor John Fegyveresi, up in the white mountains of California. Bristolcone Pines can live at least almost 5,000 years, and the longest record of living and dead overlapping Bristolcone Pines goes to 8,800 years. Truly amazing. How you do it, you can find living wood, you can find dead wood nearby, you can find wood in archeological sites, such as this sample that I just highlighted in Mesa Verde. These are some more Mesa Verde samples. The left one in the lower right were in place in the Long House. The one in the upper right is in the museum, but it was taken from balcony house.
You use them like this. Find the living wood, find the dead wood, find the archeological wood, match up the pattern of thick and thin rings, and make a record which is longer than the life of one tree. You can also get annual layers in cave formations. All of these are different ways to look at cave formations or speleothems. The upper left is using an ultraviolet light to make the layer stand out more easily. The one in the upper right is under a microscope, and it's just shining light off of the cave formation and looking at the layers. Lower left is a thin slice has been cut, and the light is being shown through it, so you can see the layers. And lower right there are chemical measurements along a along speleothem across the layers so you can see the variations in the chemistry. You can find annual layers in corals, and on top you see the layers very nicely with dates appended to them there. It came, in this case, from a brain coral like the one down below. You can also find annual layers in the sediments of some lakes, such as this one from Germany or this one from Switzerland.
Now, when you use annual layers to date an abrupt climate change or the fallout of a volcano, the trees and the lakes and the cave formations and so on agree with each other. They agree with written history. They agree with radioactive dating. The longest annual records now go to more than 12,000 years in the trees, more than 45,000 years in the lakes, and more than 100,000 years in the ice caves.
In a seasonal environment, a tree reliably produces a visible growth ring each year. The reasons for this behavior are well-understood, and the annual nature of the rings has been checked many, many times. Rarely, there is a problem (a piece of a ring may be missing if the tree was damaged, perhaps by a fire or a burrowing beetle, and a late frost or other odd event may make a ring look strange), but tree-ring daters (dendrochronologists) have learned to recognize these events. In general, tree-ring dating can be practiced with no errors. Many, many tests have been conducted to confirm that this works, that the results match historical records, etc. Most such sampling is done using narrow coring devices, and does not harm the trees.
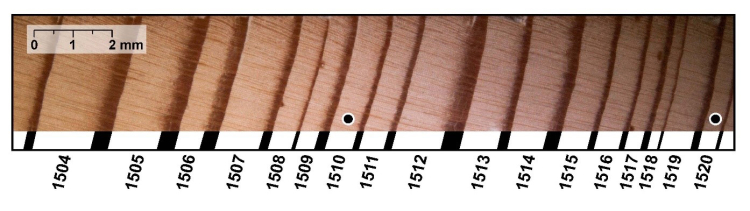
In studying tree rings, one sees that the width is not the same from year to year. Thick rings grow during “good” years, and thin rings during bad years. This allows tree rings to be used to reconstruct past climates. In a dry area, a good year is a wet one, so tree rings can be used to find out how much rain fell in the past. In a cold area, a good year is a warm one, so the tree rings function as thermometers.
For our purposes here, the pattern of good and bad years (fat and thin rings) is important for dating. On Wheeler Peak, and in the White Mountains and elsewhere, dead trees occur near the living bristlecones. Some of these dead trees sprouted before the living ones and overlapped in age with the still-living trees. Other dead trees can be found in archaeological sites or buried in sediments. A tree-ring specialist can start by dating the good and bad years using living trees. The specialist can then find the same pattern of thick and thin rings in overlapping years of the dead tree, and so use the dead tree to extend the record back to when the dead tree first sprouted (see the figure below). By overlapping a few long-lived trees, or many short-lived trees, very long chronologies can be generated.
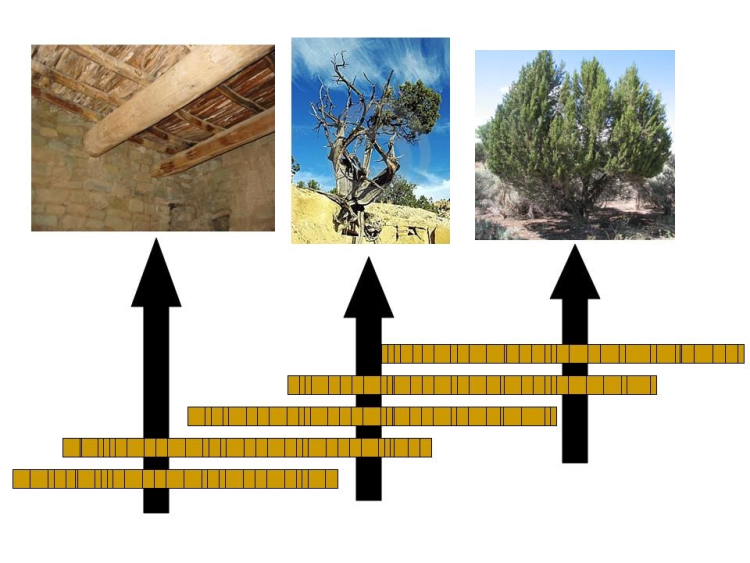
So How Many Layers?
Such techniques are used to date archaeological sites, including those of the Ancestral Puebloan peoples (also sometimes called the Anasazi; at Mesa Verde and several other national parks). For example, the Cornell Tree-Ring Laboratory, long directed by the great Professor Peter Ian Kuniholm and now being carried forward by a new generation, has for decades been doing amazing work using tree rings to understand classical history in the Aegean region, the Middle East, and elsewhere, confirming, refining, and extending historical accounts. The beautiful agreement between tree-ring and historical accounts as far back as the oldest reliable written records confirms the accuracy of the techniques.
But, the tree-ring records extend well beyond reliable written histories. The longest tree-ring record in the U.S. Southwest is now more than 8000 years. The longest record anywhere in the world is from tree trunks buried along rivers in north Germany, and extends to 12,429 years—before that, closer to the heart of the ice age, conditions were too cold for trees in that region of Germany, including times when the area was under massive ice-age glaciers. Because most trees live for “only” centuries rather than millennia, such records (and a few other really long ones, such as a 7,272-year record that was completed in 1984 from oak logs buried in Irish bogs) represent immense investments of time and effort, and people have devoted whole careers to assembling these outstanding records. Notice that there is a lot of older wood, some of it much older, including the fossil trees at Yellowstone, in the Petrified Forest, and elsewhere. The more than 12,000 years in Germany are the longest continuous record reaching the present, but surely do not come anywhere close to including the whole history of trees.
Other Annually Layered Deposits
Several other types of annually layered deposits exist. For example, some lakes in cold regions freeze every winter. When the lake is thawed in the summer, sand and gravel are washed in by streams. When the lake and its surroundings freeze, the streams slow or stop, and the only sediment settling to the lake bottom is the very fine silt and clay particles that were washed in during the summer but require months to fall. A coarse layer capped by a fine layer forms each year. Such a yearly coarse-fine layer pair is called a varve. Many such varved lakes have been studied, and found to contain thousands of years to more than 14,000 years. Many of these lakes occur in glacier-carved basins, and so their records extend only back to the time when the glacier ice melted.
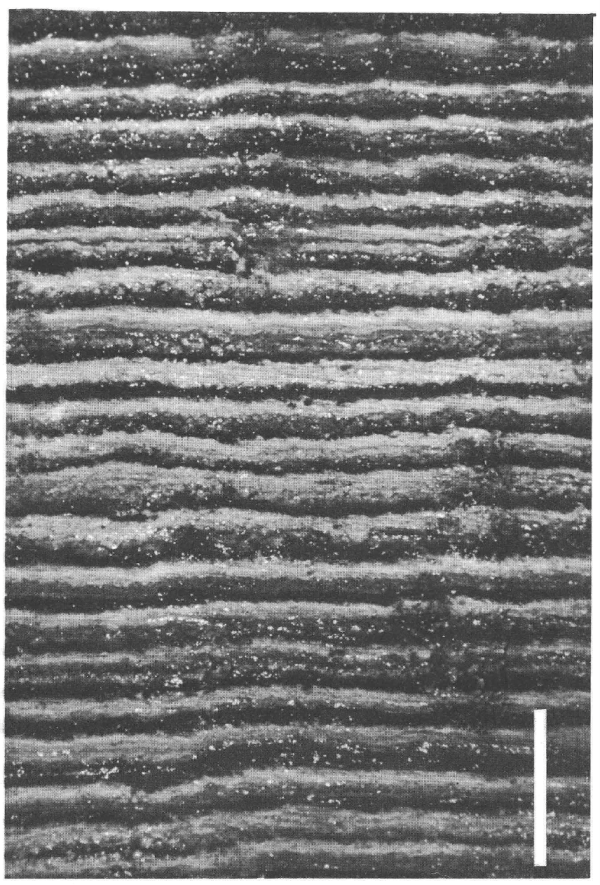
Lake Suigetsu, in Japan, has a spring bloom of diatoms—algae with silica "shells"—that make a light-colored layer, alternating with darker mud washed into the lake during the rest of the year. More than 45,000 annual layers have been counted in that lake, although some interpolations were needed in a few places in the cores.
Note that most lakes lack annual layers. If there is a lot of oxygen in the deep waters, worms will thrive in the mud beneath, and their burrows may disturb the layers. If the lake is shallow, waves may disturb the deep muds. But enough lakes exist with annual layers to be useful. And, simply seeing layers doesn’t prove they are annual; lots of tests have to be done, some of which we describe below when we discuss annually layered ice cores.
Cave formations often have annual layers. And, a few other types of sediments, including certain corals, can have annual layers. Again, a lot of work goes into showing that the layers are annual, and into interpreting them accurately.
Dating with Ice Sheets
Dating with Ice Sheets
This image is of Kurt Cuffey, a Penn State student at the time, studying an ice core from GISP2, central Greenland, in the undersnow laboratory constructed for the project. Image taken by R. B. Alley © Penn State is licensed under CC BY-NC-SA 4.0
A difficulty in lakes—and other archives such as annually layered stalagmites in caves—is that an annual layer must be thick enough to be recognized, but a lake or a cave will fill up quickly if layers are thick, so the records cannot be extremely long.
Longer records are possible from the two-mile-thick ice sheets. Dr. Alley has been very active in this work, and Dr. Anandakrishnan has contributed in important ways. In central parts of the ice sheets, the temperature almost never rises high enough to melt any snow and ice. However, summer snow and winter snow look different because the sun shines on the snow in the summer, “cooking” the snow and changing its structure, but the sun does not shine on the winter snow, which is buried by new storms before the summer comes. You can count many, many layers by looking at an ice core, and Dr. Alley has done so, working especially on one core called GISP2, which was drilled just west of the summit of the Greenland ice sheet during the years 1989-1993.
Video: Ice Layers (5:04)
Here is a video showing how the GISP2 ice core was collected and analyzed, and then a written description with more information.
We're going to go north to learn about annual layers in ice cores from Greenland. I've labeled this a Good Day in Greenland. We had been there for a month, so those newspapers were actually not very current, but they were useful for some things. And so, this is a good day. This, you can see, is a bad day in Greenland. We were working up there all summer for many years. This is our fourth of July party. After a month or so up there, you'd want to rinse out your underwear. You can see the icicles on my freeze-dried laundry. We sometimes had really big storms, and after a storm, the snow surface might look like this. It would have a lot of snow drifts, but it's sort of smooth at the small scale.
And then we'd have these beautiful sunny days that almost but not quite got up to freezing. Then at night, this is the midnight sun, you would get fogs and they would grow frost on everything. Very spectacular frost. On the volleyball net, there next to my lens cap, where we would go out skiing for exercise. There's frost on everything. If I take my pocket knife and I slice out a little piece of snow and bring it up where you can see it, the wind-packed snow from the storm is down an inch or two, a couple of centimeters. The very top has actually sublimated. It was heated by the sun, the vapor went up in the air, and then it came down to make the frost. So you get this low density, coarse-grained layer on top of the snow.
Now, what are we going to do? There's Joan Fitzpatrick of the United States Geological Survey wearing the flannel shirt. That's me without a shirt. We're digging two holes. We're going to put a lid over one of them, the one that Joan and I are in, and let the sun shine through the wall from the other one. Here's me going down into a pit, and this is the wall. This happens to be only about 6 inches of it. Snow is blue more or less the same reason as that water is blue, the red is absorbed a little bit. We're looking at some of those low density layers that form during the summer when the sun is intense. If we back up and look at the whole wall. This was about 6 feet deep, which is as deep as we could dig easily.On top is the snow that accumulated during the previous winter, and then the previous summer, and another winter, and another summer, and another winter, and another summer, and then it's a little too deep for us to dig deeper. We did a huge amount of work to demonstrate that these really are winter, summer, winter, summer, winter, summer.
Now, we're going to drill an ice core with the big drill. Here's Katherine from Alaska on the big drill. Take the core, put it down into our Under Snow Laboratory. Here's Bill from New Hampshire down there. Wanda Kapsner, who was a Penn State student at the time, and went on to be a teacher and to run a winery, and she's studying a thin section of an ice core. Here are a bunch of cores. The 1547 there means 1,547 meters down. That's almost a mile where the ice was about 10,000 years old. Here's Kurt Cuffey, who was an undergrad then and became a famous professor, and he's studying an ice core. This is what he's looking at. This one is from 1411 meters down or about 8,400 years old. And there's a winter. The summers look dark now.
Those low density layers gave big crystals and big bubbles, which in this transmitted did light on our light table look dark. So the summer looks dark, and there's a winter, and there's a summer, and there's a winter. Again, huge amount of effort to test that this really is accurate, and it is. And we were able to count more than 100,000 annual layers in this core. So that's a little bit of how we get an annually resolved record from an ice core.
To verify that the layers are annual, several things were done. First, one person (Dr. Alley) looked at the core, waited a while, and then looked at it again to see that the counting is reproducible (without cheating by looking at the first count while making the second one). Then, several other people counted the layers visible in the core (without cheating by finding out what Dr. Alley had gotten), just to make sure they agreed.
There are many annual indicators in ice cores, probably more than a dozen. For example, the isotopic composition of the ice is a thermometer that records summer and winter. And sunshine makes hydrogen peroxide in the air in the summer when the sun shines, and the peroxide falls on the ice quickly, but there is almost no peroxide made and deposited in the dark winter. So annual layers have been counted using several different indicators, and they agree closely.
This is still not good enough. When a large volcano erupts, it throws ash and sulfuric acid into the stratosphere. These spread around the Earth. The bigger pieces of ash fall out quickly, often in days or less, while the sulfuric acid may take one to a few years to fall (and, until it falls, affects the climate by blocking a little of the sunlight). You can use electrical or chemical techniques to find the layers of volcanic fallout in ice cores. The key sections can then be cut out, melted, and filtered, and any volcanic ash that is found can be analyzed chemically and compared to that from known volcanic eruptions. So, if you count back to the year 1783 in a Greenland ice core, you are in the year of the great Icelandic fissure eruption of Laki, which spread dry fogs across Europe and is well recorded in histories—Ben Franklin commented on the fogs in Paris while he was ambassador there for the fledgling United States. In fact, ash of the composition of Laki occurs in Greenland ice cores at the level dated 1783 by layer counting—the layer counting is right (or very close—some counts missed by a year or two initially). Similarly, ash from many other historical volcanoes has been found, back as far as historically dated volcanoes are known.

Comparison of counts of strata by one person at different times, by different people, and by different methods, and comparison to volcanic fallout, yielded almost the same answers, within about one year in one hundred (so one person may count 100 years, and another will count 99, or 100, or 101, but not 107 or 93 or some similarly large error).
There are a few more tests yet. There were very large and very rapid climatic changes at certain times in the past. Ice cores record the climatic conditions locally (how much snow accumulated and how cold it was), regionally (how much dust and sea salt and other things were blowing through the air to the ice from sources beyond the ice sheet), and globally (by trapping bubbles of air, which contain trace gases such as methane that are produced across much of the Earth’s surface and that changed in the atmosphere when the abrupt climate changes affected the sources of the greenhouse gases). Changes in all of these indicators occur at the same level in the ice cores, showing that the climate changes affected much of the Earth.
These changes left their “footprint” in the ice of Greenland, and the lakes of Switzerland and Poland, and the trees of Germany, etc. So, different groups can date such changes in the annually layered deposits of all of these different places. And, the dates agree closely. These events also have been dated radiometrically (we’ll cover this soon), and the dates also agree closely. One event, for example, was a short-lived return to cold conditions in the far north during the warming that ended the ice age, and is called the Younger Dryas. Close agreement as to its age is obtained from all of these different layered deposits and from radiometric ages—the Younger Dryas ended and warmer conditions returned to the far north about 11,500 years ago.
Thus far, the layers in the ice cores provide the longest reliable records. Over 100,000 layers have been counted. High accuracy was achieved younger than about 50,000 years, with somewhat lower reproducibility (maybe 10% or so, and with well-understood reasons for the lower accuracy) older than about 50,000 years. Still older ice exists, but those still-older layers in Greenland have been mixed up by ice flow and no longer give a reliable chronology. Thus, we have high confidence of more than about 100,000 years from the ice cores. (Really old ice in Antarctica, to 800,000 years or so, got less snowfall in a year than the height of a snowdrift, so annual layers are not preserved reliably, and other dating techniques must be used.)
Deep Time
Deep Time: Why Are We Emphasizing This?

Deduced from The Origin of Time, and continued to the beginning of the Emperour Vespasians Reign, and the totall Destruction and Abolition of the Temple and Common-wealth of the Jews.
Containing the HISTORIE of the OLD and NEW TESTAMENT, With that of the MACCHABEES. Also all the most Memorable Affairs of Asia and Egypt, And the Rise of the Empire of the Roman Caesars, under C. Julius, and Octavianus.
COLLECTED From all History, as well Sacred, as Prophane, and Methodically digested,
By the most Reverend JAMES USSHER, Arch Bishop of ARMAGH, and Primate of IRELAND. LONDON
Printed by E. Tyler, for J. Crook, at the Sign of the Ship in St. Pauls Church-yard, and for G, Bedell, at the Middle-Temple-Gate, in Fleet-Street. M.DC. LVIII.
One of the great results of geology has been the concept of “deep time.” The world was once believed in some cultures to be only as old as the oldest historical records. The Archbishop Ussher of Ireland, in the year 1664, declared that based on Biblical chronologies, the creation of the Earth dates from October 26, 4004 BC, Adam and Eve were driven out of the Garden of Eden on Monday, November 10 of that year, and Noah’s Ark landed on Mt. Ararat on Wednesday, May 5, 1491 BC. Other Biblical scholars obtained slightly different dates, but with broad agreement that the world was no older than the few thousand years that are documented in written histories.
Ussher’s date rested on a literal reading of the particular translation of the Bible he used, and on quite a number of questionable interpretations of the text—the Bible itself never gives an age for the Earth. Early geologists nonetheless struggled with the constraints provided by such chronological readings—how could all of geologic history fit into 6000 years? The early geologists ultimately reached the conclusion that the world looks MUCH older than 6000 years; either the world is older than this, or we have been deliberately fooled by some powerful being who crafted a young world to look old. As scientists, we work with the observable part of the world, and we have no way to detect a perfect fake, so we treat this as an old world. The geologic record speaks of “deep time,” billions of years, Shakespeare’s “Dark backward and abysm of time" (from The Tempest).
Most modern Biblical scholars have reached the same conclusion: the chronologies of Genesis do not give the precise age of the Earth, and are perfectly compatible with an old Earth. Most of the large Christian denominations, for example, have accepted an old Earth based on Biblical and on scientific interpretations. In 1996, the pope added the Catholic Church to the wide range of protestant denominations that accept an old Earth.
It remains that some denominations and people insist on what is often called a “literal” reading of the Bible. In addition, a few very vocal people continue to argue that the Earth looks young. Many more people hear all of this commotion and figure that maybe there is something wrong with the science, because “where there’s smoke, there’s fire.” Other people take it as an element of faith to disbelieve the scientific evidence, and even to accuse scientists of being bad people for opposing the young-Earth interpretations.
In this course, we go to some length to show you a small bit of the evidence that the Earth does not look young—it bears the marks of a deep and fascinating history. The annual-layer counts by themselves require an old Earth, because the tree rings, the lake sediments, and the ice cores all extend to older than the historical chronologies. The Irish oaks preserve rings from more than twice as many years as Archbishop Ussher of Ireland would have said were possible since Noah's flood, and many old trees that are still alive today sprouted before the date Archbishop Ussher gave for Noah’s flood with no sign of any damage, so his prediction was tested, and failed. Geologic and other scientific evidence from tree rings, lake sediments, ice cores, archaeological sites, and more match historical records well as far back as those historical records go; indeed, such science has been important in confirming the historical accuracy of some testable parts of religious texts. But as we shall see in the next sections, those annual layers and other “young” things are only the tip of a very old, very deep iceberg.
Please note that it is not the author’s intent to insult or belittle anyone’s beliefs here. Science, you may recall, has no way of verifying whether it has learned the Truth; it is a practical undertaking designed to discard ideas that fail, save the ones that don’t fail as provisional approximations of the truth, and push ahead. The hypothesis of an Earth that is no older, and looks no older, than historical records, leads to many predictions. Geologists began seriously testing those predictions in the 1700s, and found that those predictions were not supported, whereas predictions of an old-Earth hypothesis worked well—with very high confidence, the rocks look very old.
Consider two people, A and B. A has decided that belief in a literal interpretation of their favorite translation of the Bible is the most important thing in their life, as it controls the fate of their eternal soul and their relation with the most powerful being in the universe. Is it possible for A to look at the rocks, trees, ice and lakes, and find some way to explain those data in the context of that literal belief? The answer, obviously, is yes; many people do so, and some of them may be unhappy with us for what we wrote here. Next consider person B, who is working in an oil-company laboratory trying to improve dating of petroleum generation and migration. Which works best for B in making sense of the sedimentary record, A’s young-Earth interpretation or that of the geological profession? The answer is equally clear; A’s view is completely unhelpful, but geology works. Finally, ask whether A can be a geologist and use the old-Earth tools to find oil and minerals and clean water even while believing the Earth is young, or whether B can be a religious leader while doing geology, and the answers are yes; some people can hold a variety of ideas in mind at the same time. But recognize that the scientific evidence for an old Earth (and later, for evolution) is about as clear as science gets, and that the level of scientific disagreement on these issues is about as low as disagreement ever gets in science. Within the scientific community, there is no argument about whether the Earth really is older than historical records, just as there is no scientific argument about whether the Earth is roughly spherical. (Lively discussions clearly continue in the blogosphere and in other many non-scientific circles, but those discussions are at best rather weakly linked to the science.)
The Grand Canyon National Park
Grand Canyon National Park
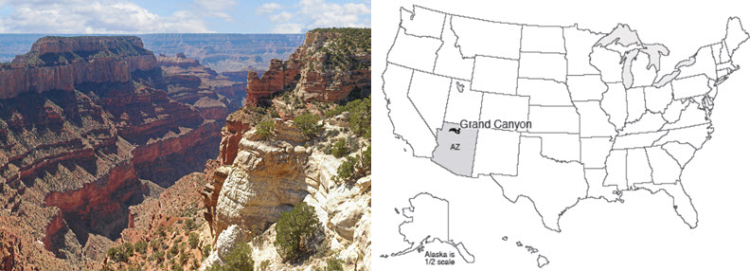
The Grand Canyon is a mile-deep, 18-mile wide, 277-mile long (1.6 km x 29 km x 446 km) gash in the Earth. The colorful spires, the rocky cliffs, the hidden pocket canyons, the pristine springs making lovely deposits, the roaring thunderstorms and arching rainbows are to many people the quintessence of the U.S. West. The Grand Canyon is neither the deepest nor the steepest canyon of the planet, but the Grand Canyon indeed is grand, and defines “canyon” for many people.
When the author, his sister Sharon, and his cousin Chuck were hiking the Bright Angel Trail from the North Rim into the canyon, a snake crossed the trail and slithered into some dry grass just at the trail edge. Chuck and I, in the lead, could see quite clearly that this snake ended in a “harmless” tail. Sharon, just behind, was not aware of the snake until it stuck its head out and rattled the grass just at her feet. Deciding that discretion was the better part of valor, and that if it rattles like a rattler it might actually be one, she made one mighty leap backward, landing in a cloud of dust on a switchback below.
Sharon almost certainly was not concerned with the rocks about her at that instant, but she had leaped backward through history. And what a history it is.
Want to see more?
Visit the Grand Canyon National Park website. While you are not required to review this, you may find it interesting and possibly even helpful in preparing for the quiz!
Hiking through History
Hiking Through History
The Penn State CAUSE class did what roughly 1% of the visitors to the Grand Canyon do, and hiked to the bottom and then back out. The trek down is rugged, often dusty, often hot, and safe only for well-prepared hikers. Many of the people who do make the hike report that it is the experience of a lifetime.
The rocks at the Grand Canyon are in order, with the oldest ones on the bottom, so in hiking back up from the river to the rim, we were hiking upward through history. The next section, The Longest Story, is a travelogue of the sites we saw on the way up. A lot of detail is provided, NOT to make you memorize it all, but to give you a small sample of the amazing things that geologists have learned, and how rich and varied the history of our planet really is.
So, lace on your boots, and let’s start the mile-high climb from the Colorado River to the rim of the Grand Canyon, watching the geology all the way.
The Longest Story
At the bottom, the river has cut the narrow, steep inner canyon through the Precambrian Vishnu and Brahma Schists. The older Vishnu has the appearance and chemical composition of metamorphosed sediments. The lava flows of the Brahma preserve the pillow structure of submarine eruptions, but the interbedded volcanic airfall material shows that at times the region was exposed as dry land. The total thickness of three miles of lava flows and interbedded layers, now standing almost on end although they initially were deposited almost horizontally, speaks of an important, long-lasting interval of deposition.
These oldest lava flows and sediments of the Grand Canyon have been "cooked," and are now of metamorphic types that form only in the hearts of mountain ranges at very high pressures and temperatures. During and after the metamorphism, melted rock (magma) squirted into cracks in these rocks, and then froze to form the pretty pink Zoroaster Granite. Yet this whole package of rocks was then brought back to the surface as the rocks of the mountains above them were eroded, with the erosion producing a very smooth, nearly horizontal plain on top of them, and weathering/soil formation causing changes that extend deep beneath that plain into these rocks.
The sea next advanced across this plain, first picking up and carrying and rolling pieces of the rocks and soils on the erosion surface to form a conglomerate, then giving way to sandstones, shales, and limestones that piled up to a thickness of two miles or so. (Such a great thickness does not mean that the sea was two miles deep; rather, in this case, the water stayed relatively shallow, but the warping of the crust by the drifting plates and other processes caused the sea floor to sink as the muds and other deposits piled up; recall that the Mississippi Delta is much more than 2 miles thick.) These rocks include mud cracks, ripple marks, casts of salt crystals that formed when the sea water evaporated in nearshore environments, and stromatolites, which are algal-mat deposits in which the algae trap mud, grow up through it, and trap more mud. All of these are similar to modern features, and indicate gradual accumulation (a layer, then drying for mud cracks, then more mud, then ripples from water flow, then drying for salt casts, and on and on and on).
Death-Valley-type pull-apart faulting then dropped and rotated these layers, so that they now slant (see the figure below). Long-term weathering and erosion then occurred, leading to a low, almost flat landscape broken by a few higher points where especially resistant rocks did not erode as rapidly. Again, deep weathering speaks of long exposure. In some places, the sediments were entirely removed down to the metamorphic rocks beneath, but in other places the sediments are preserved where they were dropped by faulting.
 View of the east end of the Grand Canyon, showing a little of the two miles of Precambrian sedimentary rocks, labeled “Supergroup”, which were dropped and tilted along Death Valley-type faults that are not visible here. Erosion for a long time produced the unconformity above, and then the sea returned to deposit the Tapeats Sandstone and rocks on top of it.
The sea then returned, again reworking materials on the erosion surface to make a basal conglomerate, followed by beach sandstone, then offshore shale, and limestone from farther offshore. As the sea deepened and the beach moved towards the land, shale was deposited on sandstone, and then limestone was deposited on shale. These three layers, the Tapeats Sandstone with its thin basal conglomerate, the overlying, Bright Angel Shale, and then the Muav Limestone, form the slope that is known as the Tonto Plateau, and is so evident on the south side of the canyon. The rocks of the Tonto Plateau include fossils of marine animals such as trilobites, and even trilobite tracks. Again, all evidence is of deposition by processes just like those operating today, over long periods of time. A layer with a trilobite track must have been exposed long enough for a trilobite to crawl across it. The thousands and thousands of different layers in the rocks, with ripples and tracks and fossils, indicate long times.
Time then passed of which we have no record in the Grand Canyon, except that stream channels were carved on top of the Muav Limestone, indicating that the region was raised out of the sea and erosion was occurring. Fossils from two of the periods of the Paleozoic are missing, indicating that much time passed. When deposition resumed, the first rocks put down were limestones in the stream valleys, but another time gap sits on top of those in-the-channel rocks. The limestone in the channels, called the Temple Butte, includes coral and shellfish (brachiopod) fossils, and plates from armored fish.
Video: Grand Canyon Strata (8:22)
If you hike out of the Grand Canyon, these are the rocks you walk on. We don't want you to try to memorize everything here, but enjoy the hike and appreciate the history. It's truly amazing. We're going to start down here with the Vishnu and Brahma Shist, the Zoroaster granite. Here's a picture, two pictures of them down by the river. They started out as sediments and lava flows and ash that fell out of the air from volcanic eruptions. Then they were squeezed and heated in the heart of a mountain range, metamorphosed, and then squirted pink granite, the Zoroaster granite, into them and folded to make these beautiful things. But then they got all the way back to the surface so that they could be eroded to make the unconformity, the time gap there, before deposition of the sediments of the Grand Canyon Supergroup on top.
This is a fascinating bit of history here. The same erosion between these old shifts and granites and the Nices and the Grand Canyon Supergroup was cut by a fault, which dragged up the layers of the Grand Canyon Supergroup. But the fault quit moving before the next erosion surface and the deposition of the sediments on top of that, because that surface is not cut by the fault.
Now, we're going to go a little bit east in the canyon. We don't see the oldest rocks here, the Vishnu, is not here. The Vishnu is not here, it's below the river. But we can see the Grand Canyon Supergroup very well, and it is a big pile of sediments. This is that erosion surface on top of it. And how much sediment in the Supergroup? Measure down, walk along a layer, measure down, walk along a layer, measure down. Keep doing that. It's two miles of sediment piled on top of each other, deposited in shallow water next to a sea as the land was sinking and so more sediments could build up, drop down in death Valley-type faults. And they're just ordinary sediments. This, for example, is a little tiny piece of that. This is a stromatolyte. Algae would grow on a rock, mud washes in, the algae grow up through it, mud washes in. Each of those little layers you see in this picture is a day's worth of algae, and growing up and growing up and growing up.
Let's go back now. We've worked up through the Vishnu and Brahma and Zoroaster and the Grand Canyon Supergroup. Now we're going to go up and look at these layers, the Tonto Plateau, the Tapeats, and Bright Angel, and Muav, You can find a trilobite fossil in the Bright Angel. In the modern world, you know that it very often when water flows, it makes ripples. Well, these are old ripples in the Bright Angel Shale. Here's a picture I took of ripples viewed edge on in that tapete sandstone. Here's another picture of looking down on a layer in the tapete. A worm craw through this and left the track.
We'll go back to the canyon, and we're going to move up and see this wonderful story happening right there. It also tells us something about a story that happened out in the west edge of the canyon and gave us what's called the Surprise Canyon. In this picture, we're looking at a closeup of these are all limestone. They were deposited underwater. First, the Muav was deposited, but then it was raised above the ocean, and a river caught into the rocks and gave us that erosion surface. Then the sea came up the river and deposited the limestone of the Temple Butte. But then this was eroded on top and came up out of the water. And then it got back underwater and the Red Wall was deposited. Over here, these are radioactive dates. You can't just look at this and know them, but it was 504 million years ago that the Muav was deposited. Then the erosion, the Temple Butte, the erosion, the Red Wall is only 340 million years ago. And something very similar happened on top of the Red Wall, and that gave rise to the surprise canyon that sits in the Temple Butte position farther to the west.
So we come back, and above the Red Wall, is the Supai. The bottom of the Supai, you may find some limestone with neat fossils like this Trilobite tail or this beautiful snail, this gastropod. Higher in the Supai, you find sediments that were deposited on land, like this fossil trackway. Above the Supai is the Hermit. A lot of them are floodplain deposits. In floodplain, you often find fern fossils like these beauties that were found along the Kyabab Trail in these USGS samples. Then we're going to go above the hermit and look at the Coconino where it lies on the hermit. This one you can see along the trail. Down below there are the river flood deposits, something off the edge of a river that we saw. And above are the fossil sand dunes of the Coconino. Right there is where sand fell down a big mud crack. Think of the Nile River depositing muds and then dunes of the Sahara blowing in and dropping down in this huge mud crack.
Up in the fossil sand dunes of the Coconino, you can find lots and lots of different layers that have little tracks of various creatures, as you see here. These are fairly common. The blue there shows millipede tracks, and there had to be time for the millipede to walk along there. Then we come up here and we're going to look right at the top. It's back to limestone. In the limestone, you find a lot of very interesting fossils. Then we go back, and if you were to go up on top of the Kyabab on the north rim and look north, this is the view when you get the north side of the Kyabab plateau. And if you make a diagram of that, the rocks of the Grand Canyon slant down to the right, and there are younger rocks at Zion on top of that, which slant down, and there are younger yet rocks at Bryce. And on top of those younger rocks of Bryce, we have these old trees, the archeological sites, and all of human history. It's a truly wonderful history. The oldest rocks you can find at the canyon are dated by radioactivity at about 1.84 billion years. So the canyon gives us about 40% of the history of the Earth of 4.6 billion years. So the whole thing is certainly not here at the Canyon. But I hope you see how much fun a geologist has reading this history and how rich and wonderful the history is.
The figure below is a static image of what you saw in the "Grand Canyon Strata" video above. Take a look at it and see if you could explain it to a friend.
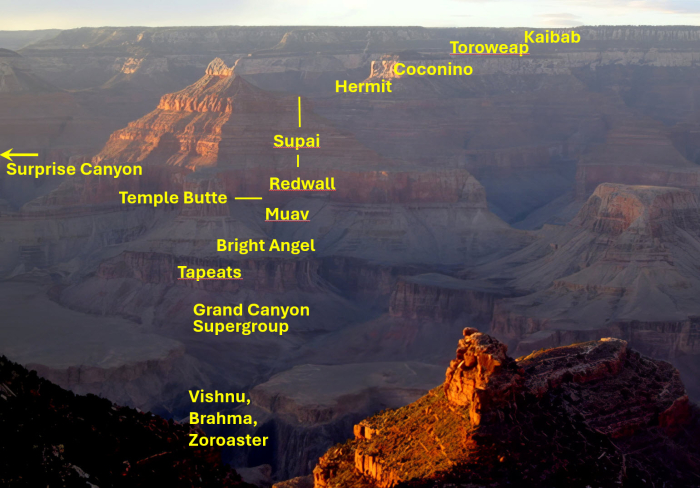
The marine Redwall Limestone was deposited next, so-named because it makes a red wall. The limestone is actually gray, with the red from rust and clay dripping down from red rocks above. The Redwall Limestone contains fossils of corals, sea lilies (crinoids) and shellfish (brachiopods), but with notable differences from the fossils of those general types found in limestones below, and both sets of fossils differ from those in limestones above. The Redwall Limestone contains caves and sinkholes, which in turn contain sediments associated with the rocks above. Caves generally form on land or possibly very close to land under shallow water, not beneath the open ocean, so the rocks were lifted near or above sea level and eroded after the Redwall was deposited.
Then, the sea flooded in, at least in the region that would become the western part of the Canyon, and deposited the Surprise Canyon limestone in erosional stream channels in the top of the Redwall. These rocks were not even described until the 1980s, and are only reachable by helicopter or arduous climbing. These Surprise Canyon rocks are not indicated in the diagram, above, which is what you would see on the Bright Angel Trail in the central Grand Canyon, but you could reach the Surprise Canyon by following the yellow arrow out of the picture to the left. Erosion cut the top of the Surprise Canyon before the deposition of more layers.
Next are sandstones, siltstones and shales, called the Supai Group and then the Hermit Shale, with plant fossils, lizard and other footprints, etc., at various levels through the rocks, indicating deposition on land in floodplain conditions. Insect fossils appear on the upward trip through the rocks, and then great dunes of the Coconino Formation with sand-blasted, wind-frosted grains and occasional lizard footprints. You might imagine the sand dunes of the Sahara spreading across the flood plain of the Nile River for these rocks. Marine conditions then returned with the Toroweap and Kaibab rocks, providing mostly limestones with sponge fossils and shark’s teeth as well as corals, crinoids and brachiopods, finally reaching the top of the Canyon.
If you're on the North Rim of the Canyon, gaze farther north. The rocks you're standing on slant downward to the north, and you are looking at rows of cliffs with younger rocks, up through the cliffs of Zion from the age of the dinosaurs, up through the lakes of Bryce from early in the age of mammals, up and up and up until finally you reach the trees and Native American sites older than the historical chronologies of Archbishop Ussher.
(By the way, if you’re interested in the carving of the Grand Canyon, have a look in Module 10 Enrichment.)
How Old is the Grand Canyon?
How Old is the Grand Canyon?
A pile of rocks like those in the Grand Canyon does not reveal its age easily. But we have evidence of seas, mountain building, mountain erosion, more seas, more mountain building, more erosion, and more, and more, and more. The rocks involved are old friends—similar things are forming today. Using the principle of uniformitarianism—the present is the key to the past—we can make some estimate as to how long events take. The schists at the bottom were buried miles deep in mountain ranges and later brought to the surface by erosion, and even relatively fast erosion requires a million years to strip off a mile across a large landscape, for example.
The geologists of the 1700s, working primarily in Europe, pieced together stories such as this. They tried to estimate the times involved. One difficulty was that they could not tell how much time was in the erosional time gaps, or unconformities—was erosion fast, or slow? And they could not really unravel all of the stories in the oldest rocks because metamorphism had erased some of the stories.
These early geologists eventually estimated that the rocks told of events that required AT LEAST tens of millions of years to hundreds of millions of years. Just depositing the sedimentary rocks would take about that long, with much more time represented by the unconformities and the oldest really-messed-up rocks. This is deep time—the Earth is not just the historical thousands of years, or even the tens of thousands of years of ice layers and tree rings. History was written and trees grew on the relics of vastly greater histories. Looking back into that history, like looking over the cliff at the edge of the Grand Canyon, is one of the great joys of geologists. We live in a four-dimensional world, height, width, depth and history through deep time. We hope you are learning to enjoy some of this view over the cliff of time. In the next section, we will see just how high that cliff really is.
Radioactive Clocks
The techniques of layer counting and uniformitarianism are useful in dating, but the real workhorse these days is radiometric or radioactive dating. The Earth includes many different naturally occurring radioactive elements. An atom of a radioactive element eventually will spontaneously change to some other type of atom, by emitting radioactive energy, in ways that physicists describe and predict with incredible accuracy using quantum mechanics.
Radioactive decay occurs in various ways. The easiest to understand is when a nucleus splits into two parts, kicking out a part of itself. Remember that heat causes molecules in water to bounce around and occasionally evaporate; atoms or molecules in rocks are also bouncing around, but are so tightly bound that very, very few break free at the Earth’s surface. In a vaguely analogous way, the protons and neutrons in the nucleus of an atom are always wiggling and bouncing around; most nuclei are so tightly bound that this wiggling doesn’t change anything, but some types of nuclei are weakly enough bound that occasionally some protons and neutrons “evaporate.” We call those types of atoms that “evaporate” radioactive, and those that do not stable. (A real nuclear physicist would probably yell at us because we oversimplified too much, especially because radioactive decay properly is a quantum-mechanical process and not really like heat, but we hope this will do for introductory geology. We can guarantee that there are physics professors who would love to teach you about the real physics of this.)
Commonly, a nucleus that “evaporates” emits a group of two protons and two neutrons, which is the nucleus of a helium atom and also is called an alpha particle, for historical reasons. Other types of radioactive changes also occur, including the splitting of a nucleus into nearly equal-sized chunks, the change of a neutron to a proton plus an electron that is emitted, or the capture of an electron by a proton to change into a neutron. All of these change the type of atom from one element to another. All are explainable by well-known physical principles, and all are as natural and regular as the downward fall of your pencil if you drop it off your desk.
The behavior of any one atom is not predictable, but the average behavior of large groups is easily predictable with great accuracy. Suppose you start with a sample containing some atoms of a radioactive type, and you watch for some specified time such as one hour, or one year. The basic rule of radioactive decay is that you will see more radioactive atoms decay if you started with more radioactive atoms. (Really, it is that simple. We give you the math in the Enrichment, in case you want to prove it to yourself.) If you start your stopwatch when you have some number of a given type of radioactive atom, and stop the watch when half have changed, you will have estimated the half-life of the radioactive type. Each radioactive isotope has a distinctive half-life, which can be measured in the laboratory. (Note that you do NOT need to wait for an entire half-life to measure it. As shown mathematically in the Enrichment section, you need to wait only long enough for enough atoms to change to be measured accurately, a useful result when dealing with types that have long half-lives.)
Suppose you start with 2000 atoms of the parent type. These decay into offspring (most textbooks refer to these offspring as daughters). After one half-life, 1000 parent atoms remain and 1000 offspring have been produced. After another half-life, half of those 1000 parent atoms have changed to offspring, leaving 500 parents and giving 1000+500=1500 offspring. After a third half-life, half of the remaining parents have changed, so that now only 250 parents remain and 1500+250=1750 offspring have been produced. During the fourth half-life, half of the remaining parents decay, leaving only 125 parents and giving 1750+125=1875 offspring.
Now, we really need to deal with large numbers, so add ten zeros to the end of each of the numbers in the previous paragraph. Such numbers of radioactive atoms are common in even relatively small samples of rock; the total number of atoms in a fist-sized chunk of rock is about 1 followed by 24 zeros.
As noted, there are many different parent types with different half-lives. Some half-lives are very short—seconds or less. Others are very long—billions of years or more. Some of the radioactive parents are left over from the explosions of stars that produced the stuff of which the Earth is made. Other radioactive parents are created by cosmic rays that strike atoms on Earth. Some radioactive decays produce offspring that are themselves radioactive parents for a further generation, and several such decays may be required to produce a stable offspring. And radioactive decays may damage neighboring atoms, producing new radioactive types.
Telling Time
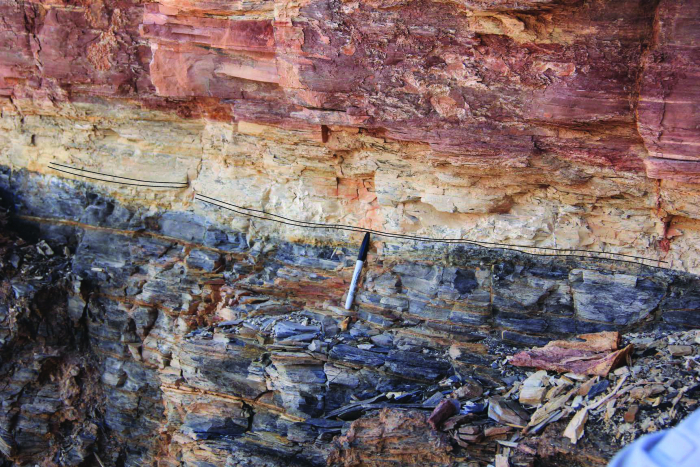
Consider the example of potassium-40 and argon-40. Argon-40 has 18 protons and 22 neutrons in its nucleus, for a total of 40 particles. Potassium-40 has 19 protons and 21 neutrons, also totaling 40. Potassium-40 is a parent with a half-life of 1.3 billion years. Potassium is abundant on Earth, and occurs in many common minerals, and some of the potassium is the radioactive parent potassium-40. The offspring, argon-40, is a gas. If lava flows out on the surface of the Earth, the argon escapes. Thus, a lava flow will start with some parent potassium-40 but no offspring argon-40. As time passes, the potassium-40 breaks down to argon-40, which builds up in the rock. If today the rock has as many potassium-40 as argon-40 atoms, then one half-life has passed since the lava cooled, and the rock is 1.3 billion years old. Whatever the ratio is, the math is not that difficult and gives the age.
It is possible for argon-40 to leak out of the mineral. If it does, we will think that the lava cooled more recently than it really did. But if leakage is occurring from a mineral grain, then the outside of the grain will contain less argon-40 than the inside does, and this can be measured, revealing the problem. A mineral grain that grew in slowly cooling melted rock far down in the Earth and that then was erupted may have begun trapping argon-40 before the eruption occurred, in which case the age obtained will be the time when the grain started growing rather than the time when the eruption occurred. Scientists do not blindly apply dating techniques; they think about what is being measured, and apply a little common sense.
Keeping Time
Clearly, we can test radioactive dating against written histories and annual layers, and we can test against the sort of uniformitarian calculations that the early geologists made on how long it would have taken to deposit the rocks we see today. Furthermore, we can test different radioactive isotopes against each other—a rock can be dated by potassium-argon, but also by others including uranium-lead and rubidium-strontium. All of these agree beautifully; the ages assigned to geologic events are based on multiple independent techniques that yield almost exactly the same age for those events.
In some of the stranger corners of the internet you may find people suggesting that maybe radioactive decay occurred at some different rate in the past, and even some of the freer-thinking physicists have suggested slight changes in physical “constants” over time, perhaps affecting radioactive dating. We can be confident, however, that no large changes have occurred that would significantly change the results discussed in this course. The agreement among written histories, annual-layer counts, uniformitarian calculations, and multiple independent radioactive techniques does not allow major changes. Furthermore, because radioactive decay depends on the forces controlling the stability of atomic nuclei, and those forces are involved in all sorts of other processes including energy generation in the sun and other stars, any major change in the radioactive decay in the past would mean that we would not be here today—the sun would have turned off or blown up already, something we know did not happen. (See the Enrichment if you want a little more on these topics.)
The Age of the Earth
The oldest rocks found on Earth are about 4 billion years old, and some of those contain mineral grains recycled from slightly older rocks. The active Earth has almost certainly erased the record of its very earliest rocks. Meteorites probably formed from the solar nebula at about the same time as the Earth did, and since then have fallen on the Earth. The oldest meteorites are about 4.6 billion years old, and that is our best estimate for the age of the Earth. Careful analyses of the changing lead isotopic ratios over time (from decay of uranium) also yield that number for age of the Earth. And 4.6 billion years is, indeed, deep time.
Vintage Video: Supergroup Part 1 (2:02)
This video takes you "live" to the Grand Canyon Rim (on a very windy day), where you will join Dr. Alley in a firsthand look at "deep time." (If that clip leaves you wanting more, "part 2" is also available as an optional enrichment). So, enjoy your visit to the Grand Canyon and your walk up through time. We hope you find Dr. Alley's play-by-play commentary and his incisive post-game analysis helpful in explaining what the Earth has been doing these past 4.6 billion years.
Click here for a transcript of the Supergroup Part 1: Grand Canyon Rim video
The really cool thing here is how much extra time we can see. If we look down just to the left of where we see the river in the shadow of the cloud right now, we'll see that there are layers that are slanting. And then above them there are layers that are horizontal. Now the slanting layers are the Grand Canyon Super Group.
They are rocks that were deposited between about 1.2 billion years ago and about 0.7 billion or 700 million years ago. If you add up the thicknesses of all of those going down it's almost three miles of sediment-- almost three miles. Now we've got a mile on top and then from our feet down to the unconformity.
Then there's three miles of sediment under that. And then if we peer down the canyon in that deep cut down there are the the old crystalline rocks, the old beautiful rocks that were cupped in the heart of a mountain range that are lava flows and sediments that add up to many more miles of rocks. And those have been cut. And that it was eroded. And then these were put on top.
And then faults that are sort of like Death Valley faults broke and dropped these down. And then it eroded on top. And then these were came And then those were deposited. And then those were eroded away. And then the river cut through. And it's so cool. And it's just this immense story that just keeps being told over and over and over.
Optional Enrichment
No, this vintage video won't be on the quiz!
Vintage Video: Supergroup Part 2: Grand Canyon Rim (2:44)
OK, we're here at the desert view outlook, looking out over the eastern end of the main part of the Grand Canyon National Park. But there's some spectacular scenery here that's somewhat unappreciated because here you can see some of the stuff in between, and what's cool about it is that because it's been tilted over, in a sense, you've gotten real lucky and you've preserved a lot more of it than you would if it stayed all vertical. And the reason for that is if you can imagine each of these layers is part of the Grand Canyon super group, and this is just a whole bunch of layers of volcanic and sedimentary rocks. And these are real old these are all 700 million to 1.2 billion years old, something like that.
So you've got these really old rocks that are all lying nice and flat, nice and horizontal, laid down like that, but at some point they tilted over at a slight angle, and then this nice line cut across and started to erode away across them. And so at one end of the canyon see a little bit of this. As you drive to the east you start to see younger, and younger layers coming out underneath what's called an uncomformity.
And then all of this was sliced off. But what's amazing about it is the amount of rock that would have been here a long time ago, it's probably three miles worth, right now it's spread out across probably 20 or 30 miles of the canyon, but originally there was a good three miles of this stuff.
And the fact that they are slanted really helps us to preserve all the different layers. If it stayed flat you'd have sliced off so much more and you'd have lost all that information. It's slanted a little bit, like a deck of cards that's been pushed out and so even though you're starting to slice it off you still retain some of the older decks, some of the deeper parts of that deck of cards.
Optional Enrichment: Deep Time
Optional Enrichment: Deep Time
The big picture on climate and energy is a little too big for our course—indeed, Dr. Alley has been the primary author of a different course on this topic, wrote a book on it, made a three-hour PBS miniseries, and has given more than 1000 public talks on the subject. Here, as Enrichment, we’ll give you some of the highlights, emphasizing the ability of people to solve problems, discussing how important energy is to our well-being and the great value we have gotten from fossil fuels, discussing how the CO2 from fossil-fuel burning is changing the climate, exploring some of the threats if continue with our current energy system, presenting the strong reasons why changing sooner rather than later will make us better off, looking at some of the solutions we could adopt, and saying a few words about communicating these issues. The biggest picture is that, if we seriously work to solve these problems, most people who view this material should live long enough to see us build a sustainable energy system, powering everyone essentially forever, and giving us a larger economy with more jobs, improved health and greater national security, in a cleaner and more ethical world. And that’s good news!
A few of the images are not in the public domain but are used here following many public presentations, with attribution for non-profit educational purposes under fair use. Most of the images are in the public domain, and many (including all of the penguins, which are included mostly to lighten the mood) were taken by Richard or Cindy Alley.
Video 1: The Value of Optimism on Climate and Energy (2:50 minutes)
Dr. Richard Alley, College of Earth and Mineral Sciences, Department of Geosciences: "We're going to start with a little on the value of being optimistic on climate and energy. Let's be honest in the big picture on climate and energy, uh the news is not always good. But before you start jumping to bad conclusions, uh consider this uh like many, many other people I helped the United Nations on energy and climate uh with the IPCC, the intergovernmental panel on climate change. This is us in Paris in 2007 (photo of Dr. Richard Alley and Colleagues at in Paris for the IPCC), the year the committee was awarded the Nobel Peace Prize. If you took the tens of thousands of pages of IPCC reports, and you squeeze them into 35 words."
Dr. Richard Alley: "Compared to business as usual, efficient responses on climate and energy will give a larger economy with more jobs, improved health, and greater national security in a cleaner environment, more consistent with the golden rule. This really is correct; this is what the scholarship says. The good news is if you're a young person today, you're part of the first generation in human history that can build a sustainable economic energy system that'll power everyone essentially forever. But we have to remember that we can solve problems and then go out and solve them. And we can solve problems this is a cell phone (holds up cell phone), and I have a picture here of a do-it-yourself cell phone kit. It's just a little bit of quartz or sand for the glass (circles photo of sand on screen), and it's a little bit of organic material such as oil for the plastic (circles photo of oil on screen), and it's the right rocks, the ones with the rarer elements and the Palladium and such (circles photo of rocks on screen). And that's all it is, is sand, oil, and rocks. And science, and engineering, and design, and marketing, and banking. There's a GPS in here that knows where you are. It has relativity special and general relativity from Einstein. If it didn't have those it would begin to get lost in 2 minutes. It has quantum mechanics in the computer. If we can do this, we can surely do energy. So, in this set of short videos, we'll discuss the big picture, the nature of the problems, and some of the possible solutions. Let's go see."
Video 2: The Value of Energy (13:58 minutes)
Dr. Richard Alley, College of Earth and Mineral Sciences, Department of Geosciences: "Here's a little bit about the value of energy. Dealing with climate and energy is hard because energy use is so valuable to us, and right now most of our energy is from fossil fuels. Here's a little bit of history and what's going on."
Dr. Richard Alley: "A human diet:, what we get from our food that allows us to do things: To run, and jump, and hoe, and what have you. We eat about 2,000 calories per day. If you burned your food over 24 hours, the energy coming off is just 100 Watts. It's one, old light bulb. A Tour de France rider can do a few hundred Watts, but they're eating 10,000 calories a day. What we can do is not that much. What is done for us though? We don't have to light our light bulbs. We don't have to cool and heat our rooms by generating the energy from our food. We have air conditioners, and we have tractors, and trucks, and all this wonderful stuff that's done for us. In the United States, what is done for us from outside is 100 times more than what we could do for ourselves. Averaged over the world, it's about 25 times. We really love this, our well-being depends on it. And it is still more than 80% fossil fuels in the US, and in the world. That's why this is hard."
Dr. Richard Alley: "You can tell the history of humanity from so many different ways. And from the common workers, and from the leaders, from our art, from our religion. You could tell the history from our use of energy. Ever since the discovery of the control of fire, we have this long history of energy crisis. We find something to burn to get energy from to do our work for us, we burn through it much faster than nature makes more, we suffer very large unintended consequences, we get sick and other sorts of things, then it becomes scarce. We have intrusive governments, we may fight wars over it, and then we find something new to burn, and we do it over again. And here's the history from Penn State's view. If you drive into State College from the East, headed towards Penn State University, you go past the reason that Penn State is there. Because Penn State was founded by the iron masters, up the hill, from the iron furnace. And the furnace was put here because there was Red Dirt that you could get iron out of, there was limestone flux, there were trees for charcoal, and there was a stream, a spring, a water source that could drive the water wheel that supplied the blast to make the furnace hotter."
Dr. Richard Alley: "This tremendous picture (Figure 11: Civil Engineering Students Taking Velocity Measurement on Thompson Run) is early on when Penn State had been founded, which has students in civil engineering in their ties and their hats, gauging the outflow of the spring, that is why the furnace was put right where it is, to learn how to do this important task before they became engineers."
Dr. Richard Alley: "We go back to the furnace (picture of iron furnace in State College). When the furnace was operating, it would have looked like this (image of Hopewell Furnace in Philidelphia, Pennsylvania). This one is Hopewell Furnace down towards Philadelphia, and it is turning that red dirt into the iron that was used to build the East. The water wheel is over here that would have been driven by our spring, and it's burning. And to do the burning you've got to be dumping in things to burn, and what was it burning? Charcoal. Near here we have something called Collier lake. Colliers or the Colliers (different pronunciation), were the people that turned trees into charcoal because charcoal was just able to burn hot enough to smelt the iron, whereas the trees were not. They make this giant pile of logs, then they'd cover it with dirt. This is actually a demonstration (picture from the US National Archives, reenactment of people making charcoal), these people did this job when they were young, and they were now showing in their old age, they were showing a photographer how they used to do it. You bury the trees in dirt, you burn them with reduced oxygen, drive off the water and some other things, hope that the dirt doesn't break so someone has to climb up there and fix it and try not to fall in and die, and eventually it makes the charcoal that allows you to smelt the iron. And it did this (photo of individuals reenacting logging for charcoal, showing a field of chopped down trees). An iron furnace, and the people who took care of it, think about a square mile of trees per year to make it go. If you had an open forest and you could walk for 20 minutes. and then turn and walk 20 minutes. and then come back. that would be enough trees for one year. And then it's maybe 50 years until enough trees would grow back that you could do it again. You need this huge quantity of trees."
Dr. Richard Alley: "Now if you go to a map of Pennsylvania today, and ask where is furnace still on the map? Every line on your left here (list/graph of Pennsylvania furnaces by hometown), is a furnace that we still remember and there are many more furnaces that are back in the woods that we've forgotten on this map. And every one of those, when it's running, is a square mile of trees per year. They made something called pig iron that then was shipped to four forges, like Valley Forge, where you made valuable things from the pig iron. Every one of these on the right (circling list of forges with furnaces on Pennsylvania list/graph), is a forge another square mile of trees. And trees are being used by people who are not making iron, to make their houses, and to heat, and to cook, and so on. And what happened, this ("Penn's Woods" to "Pennsylvania Desert" Picture; indicating trees were chooped down leaving woods bare). Pennsylvania means "Penn's Woods." They said when the first European settlers arrived in Pennsylvania, a squirrel could have gone up a tree on the Atlantic Coast and stayed in trees all the way across to the Mississippi. The first Forester of the Commonwealth of Pennsylvania was someone named Rothrock, and around 1900 he wrote about the great Pennsylvania desert. Now it wasn't a desert, we still had rain, but we didn't have trees. We had cut them all down. We now have a million deer in Pennsylvania, there might have been a few left. We reimported elk because we got rid of them, we got rid of the bears, we got rid of the nittany lions. There wasn't a deer to eat, and there wasn't a tree to do it behind. We just use groundhogs for Groundhog Day. We couldn't use bears or something else large because we got rid of them."
Dr. Richard Alley: "It was not just us. If you know Cape Cod, you know so Cape Cod sort of sticks up there off the coast, and right about here on Cape Cod (Dr. Richard Alley indicates coast with his arms/hands) is where the pilgrims first met the native people in Eastham. They said it was so goodly a land and wooded to the brink of the sea. Still in the 1600s the town, of Eastham outlawed the ability of people to cut their own trees on their own property. There weren't any left. Deforestation was so extreme that they panicked, they didn't know what to do. It was the row walks the cape in the 1800s and he wrote: "Many of the people get all of their fuel from the beach. If there is a shipwreck, you can burn it. If a tree drifts over from Maine you can burn that, otherwise you can't cook dinner." Over in Manhattan still in the 1600s, the common council is passing many laws on rights to wood, fair trade in wood, they're paying inspectors to make sure you're getting what you paid for. If you don't like government, you better not get into scarcity, because we demand governments to help us at that time when we have shortages and we hit energy shortages very early."
Dr. Richard Alley: "Now, if you've ever tried to read by fire light in a dark, Pennsylvania winter before electric lights are invented, it's not very easy. You're not going to do 12 stitches to the inch on your quilt in that flickering light of a candle or a fire. So, what did you do? Poor people burned a biofuel a mixture of alcohol and turpentine, it was fairly cheap, it was good light, but it was explosive. And there's horrible stories you know the Methodist Minister and his wife go out to visit the parishioners, and the daughters try to refill the lamp, and it blows up and burns them to death. And so rich people, burn whales. The whale oil was clean, and it was bright, and you didn't have it exploding. So, you take large quantities of money, you ship it to New England, and they put sailors on ships, and they go out and kill whales. This is the history of whale oil production from the Yankee Fleet from 1800 to 1880. And at the peak, there are 10,000 sailors out of New England trying to kill whales. This is a complicated story. The fleet got crushed in the sea ice off of Alaska, the insurance went through the roof, and that could shut down some whaling, but what were they doing in the sea ice off of Alaska? They couldn't find any whales that they could kill closer. They had basically killed all the whales they could find. There were some whales that were too fast for these sailing ships, and various other people from Japan, and from Norway, and Russia, and what have you killed them with diesel and harpoon cannons. When we finally quit whaling, there was no economic resource of whales left. We had killed so many whales that there just wasn't much left in the ocean. As they got good at whaling, they drove the price down. That low spot there (pointing at dot on graph indicating $7/gallon of whale oil) was about $7 a gallon in modern equivalent. When they hit the peak of whale oil, not when it was totally gone, but when they hit the peak, it's up to about $25 a gallon. Just this huge, huge price increase, not when it's gone but when it was half gone. If you took a hundred years of Yankee whaling, all of that oil, 10,000 sailors at the peak, you put it into modern tankers, and you replace the petroleum we're using, it would last the United States 11 hours. The idea that we go back when we run out of oil and do the things we used to do, is laughably absurd. We cannot do that; we need something better."
Dr. Richard Alley: "But we do have trees, and we have whales, because we switched to burning fossil trees and fossil algae. This is not a new idea. This is an editorial cartoon (showing photo of "Grand Ball Given by the Whales in Honor of the Discovery of the Oil Wells in Pennsylvania"), it was published in the magazine Vanity Fair in the year 1861, just before the US Civil War. And you can see the title, it was the Grand Ball Given by the Whales in Honor of the Discovery of the Oil Wells in Pennsylvania. So just before the US Civil War, the oil wells of our native land, may they never secede. Oils well that ends well, we whale no more for our blubber! We saved whales with mineral oil, with petroleum. This is a piece of sheet music (photo of the American Petroleum Polka) from the year 1864. Tt's the American Petroleum Polka. We're going to dance to oil wells. It says at one point, this oil well through pure oil 100 feet high, so there comes oil. Oil was always black. It is black. It will always be black. But with her wearing her white top here (woman in photo dancing with white top), they didn't want black oil falling on it so they made it white."
Dr. Richard Alley: "When we quit burning so many of them, a lot of the trees, and a lot of the whales, grew back in a hundred years. When we quit burning fossil fuels, nature will make more in maybe a 100 million years. The rated formation is so close to zero that you can just set it to zero. We must change. We cannot decide between say renewables and fossil fuels. Either we burn and then we learn, or we learn while we burn. And we are confident, if we burn before we learn, we will change climate in ways that we really don't like."
Video 3: The Problem of Human-Caused Climate Change (12:01 minutes)
Dr. Richard Alley, College of Earth and Mineral Sciences, Department of Geosciences: "It's worth taking a little time to discuss why human-caused climate change is a problem. It is true that politicians and the public are still debating whether we humans are causing global warming, whether global warming is happening, whether it's really fossil fuel burning that's doing it. But the fossil fuel burning releasing CO2, changing the atmosphere, changing the climate, affecting us, is really undeniable fact now."
Dr. Richard Alley: "So let's take a little bit of history. We'll start over here in 1800, and run through today with a timeline, and look at a few events, some of which are connected to my cell phone and its development. So, in the year 1900, Planck introduces quantum mechanics. And you know that the computer in my cell phone is designed using the principles that come out of our understanding of quantum mechanics. In 1905, Einstein introduces the first part of relativity, special relativity. My cell phone has a GPS in it, and the GPS is using both special and general relativity because the satellites are higher in Earth's gravity well going faster than we are, and it works. You know this is a wonderful thing. In 1915, Wegener introduces his ideas on continental drift, and we geologists use our understanding of continental drift as one of many ways to help us find or deposits that go into getting the things that you use to build the cell phone. Now the cell phone has a nice person in there, there's a lady's voice that tells me where I am, and she is using filters to hear the signal from the satellite. And those filters are based on mathematical work that was done by the great French mathematician Fourier. In the year 1824, Fourier started calculating the balance of energy for the Earth, and he said the simplest model leaves us colder than we really are. But the simplest model has to be about right, so something else must be going on. And he suggested that there's something happening in the air that warms us in a way that's similar to how a glass plate on top of a sunlit box will keep that box warmer. And we now call this the greenhouse effect. So, Fourier introduces the greenhouse effect in 1824. The role of CO2 was first identified by Eunice Foote in the US, and then there's a lot more work done on this by Tyndall in the UK 1856-1859. The first calculation that's accurate of the warming of the surface that will be caused by humans burning fossil fuels, is by Arrhenius in 1896. So, climate is not some newfangled, speculative thing that's going into building the cell phone that's in your pocket, but it is really long-established science."
Dr. Richard Alley: "Arrhenius's calculation was done with classical mechanics, it was before Quantum. Our Quantum understanding is in many ways based on work that was done by the US Air Force after World War II. They wanted to do communications, and operations, and heat seeking missiles. If you're going to target the hot exhaust of an enemy bomber by looking at the infrared radiation coming from it, if you use the wrong wavelength on your sensor, CO2 absorbs the radiation, and your missile will not hit the target. And I can tell you today, wherever you are in the course of the day, there will be more infrared radiation going up from the sun-warmed Earth, than coming down from enemy bombers. And some of that radiation is absorbed in the atmosphere. Before we ever had satellites, the physicists predicted what those satellites would see when they looked down, and how it would change over time, and those predictions have been successful. So that blue line (pointing to blue line on graph showing the increase in wave number and temperature energy to space to cool Earth) is following the predicted and observed radiation going up from the sun-warmed Earth to be seen by satellite. In fact, that has changed over time as we've changed the atmosphere and the temperature of the Earth, so it's up just a little bit here's two lines on there. But maybe the most important thing here, is that that huge divot is energy that is kept in the earth system because CO2 absorbed it. And if we have more CO2, more can be absorbed. You meet the person who says oh I don't believe in this. They don't believe in the ability of the Air Force to build a heat seeking missile? This is physics, we raise CO2 in the atmosphere that has a warming influence. It's just physics. It is successfully predictive, and I'll show you just a little bit of a vast amount of data. Here's a plot starting in 1880 and coming up towards the present of different temperature records developed for the surface of the Earth, by different groups with different funding (showing temperature anomaly graph from different 5 different agencies). Including one of these groups that started from a physicist who sort of didn't believe that the other scientists had done their job right, got money including private money to demonstrate that the temperature records weren't good, and the temperature records were beautiful. This one show, (pointing to graph with arrows) that sometimes even a little more warming than the others but you can see all of the data agree with the temperature wandering up rapidly, because we're driving it up."
Dr. Richard Alley: "Now, that's thermometers. If you simply restrict yourself to thermometers that are far from cities, they also show the warming. Thermometers placed in the ground, show that the ground is warming. Thermometers placed in ocean water, show that the ocean is warming. Thermometers taken up on balloons, show that there's warming above the surface. Thermometers looking down on satellites, show the warming. If you look at temperature sensitive snow and ice, not South Pole. I've been to South Pole it's minus 50 if it warms up to minus 40, it won't melt yet. But if you look at the temperature sensitive ice: springtime snow, lake ice, river ice, sea ice, temporary frozen ground, um perm frost (permanently frozen ground which is now not frozen), and places the mountain glaciers, the edges of ice sheets, all of these are being lost with warming. If you ask plants and animals where they're living and when they do things, the vast majority of the shifts are in the direction you expect from warming. So as early as the 2007 UN report, warming in the climate system is unequivocal."
Dr. Richard Alley: "Now how do we know that the warming that must happen from the CO2 is what is driving the warming here? Well we've looked very hard for other causes, and no the sun has not brightened over the time we're looking at it wiggles a little. Nothing else is going on to drive this, and the CO2 predicts it beautifully. So this plot which comes from the director of the NASA Goddard Institute for Space Studies (showing graph of forecast evaluations for models run in 2004), has on it both data and model output, and it's it starts over here on the left where the models have been told about things like the particles from volcanoes blocking the Sun, and making that little cold divot there (showing dip in graph between 1990-2000), that was Mount Pinatubo. And then it runs into the future, we don't know when the volcanoes will erupt, so there's nothing put on there but there haven't been any really big volcanoes in this interval. So that there's not a huge volcanic influence. What the models say is that our CO2, the other changes we're making but mostly CO2, will drive warming. Every model run has in it some variability from things like El Ninos, but more than a few years in the future you can't predict El Ninos exactly, it's like predicting the weather exactly. And so what's happened in this plot (indicating Forecast graph on screen), is the models have been averaged to give the black line (on graph), and what you should expect is the black line plus a little bit of wiggling from El Ninos. What then happened after this was predicted, is just what was predicted. This is successfully predictive for the warming, for the pattern of the warming. The stratosphere cooling as CO2 holds heat down here, more warming at the Arctic, more warming on and then the ocean, and other sorts of things. The pattern the amount of warming is indeed being successfully predicted and we know this."
Dr. Richard Alley: "Now this is a particularly interesting one. It starts um further back in time, it goes further into the future than we've gone. On here our projections and predictions and actual data, and this happens to be scientists who we're working with, or for funded by, oil companies. So, each of the gray lines (on graph) starts at some time well in the past. That one was way back, others are a little closer to today, and each one of them is one of these. This is what we'll get if we keep burning fossil fuels into the future for an oil company, and then the red (line on graph) is what happened. This works. It really, really, really does work. The science is solid, we are driving this."
Dr. Richard Alley: "The warming effect of our CO2 is not the least bit surprising, but what is surprising Arrhenius said I don't think we'll burn that much fossil fuel. That was what's really surprising is how good fossil fuel companies have been at getting us what we burn. There's a comparison here. You know what trash looks like, you've taken out the trash for your parents maybe, or done it for yourself, or try to get kids to do it for you. In the US, we throw away at the curb for the trash collector a half a ton of trash per person, per year. And the US averaged over sort of the early part of the 21st century was about 16 tons of CO2 per person, per year. That's dropped a little maybe even a shade below 15 now, but it's still 15 tons per person per year and it is changing the climate."
Video 4: The Dangers of Not Changing our Energy Systems (6:39 minutes)
Transcript coming soon!
Video 5: The Benefits of Changing our Energy System (6:39 minutes)
Dr. Richard Alley, College of Earth and Mineral Sciences, Department of Geosciences: "Now, we can have a look at some of the benefits of building a sustainable energy system because there really are large benefits available if we take actions now, to avoid the worst damages from a warming climate."
Dr. Richard Alley: "If we do this well, compared to business as usual, we get a larger economy. More jobs, we're healthier, our nations are more secure, the environment is cleaner and were more ethical. I'll show you one slide on each of these. This comes from the Nobel prize in economics in 2018, William Nordhaus, I actually had the honor of serving on a committee with him, an amazing person. He was awarded for building tools that provide guidance to policymakers and the general public on how to make the economy help more for more people. We have resources, we can use those resources for consumption now to help people feed them, and clothe them, and house them, and so on. We can invest broadly in the economy to make it bigger in the future to help more people. We can target those investments on particular issues, such as climate change. When these models are run, they keep saying over, and over, and over, that we're not in investing enough in slowing down climate change now to make the economy be its best. You may meet the person who says oh yeah, the climate is changing, but we can't afford to deal with it. The Nobel prize in economics says you can't afford not to deal with it."
Dr. Richard Alley: "Now a bigger economy is likely to give more jobs, and that's especially true if we shift away from fossil fuels Now, I worked for an oil company one summer, great people, many of our students have gone to work for oil companies, but it's fairly clear that any other good approach to making our energy system makes more jobs. And the reason is at least in part, that the cheapest oil in the world, which maybe from some other country, can probably be produced for about $5 a barrel. And that goes to jobs, but we may be paying $75 a barrel or some other large number, because oil is scarce. And the money is going to those people or countries that control the scarce resource, not to the workers who make that scarce resource useful. The Sun, the wind are just about everywhere, so if we switch to those, more of the money of the energy system goes to good jobs, not to controlling a scarce resource.Now if we make it too hot to live in places, that is very unhealthy. There was a recent study that found that 20% of deaths globally are linked to breathing particles that come off of burning of fossil fuels. Making more forest fires is not going to be good flooding people's houses, and then spreading diseases is not good. So, all of these medical groups in the US got together and they said, if we want to be healthy, we need to go on the inevitable transition to clean renewable energy."
Dr. Richard Alley: "Here's a picture of rear Admiral David Titley from our earthy operators manual PBS miniseries. Admiral Titley is a Penn State grad, he came back and taught at Penn State for a while, and truly amazing, brilliant wonderful person. And after his retirement he served on the CNA military Advisory board, with a large number of other military leaders. And they said, you know if we make it too hot to live in some parts of the world, this will drive climate refugees across borders. It's not good for them. It's not good for the security of the countries. If we flood our navy bases with sea level rise, that's not good for the security of our country. If we want secure nations, we need actionable agreements on ways to stabilize the climate. That's our military leaders."
Dr. Richard Alley: "We're increasingly driving climate change that forces species to move. Some of them are going up mountains and trying to track after colder conditions, and then they get shoved off the top of the mountain and they're gone. Some of them may be isolated in national parks and they need to go to a different park, but we're in the way. If we don't take actions to stabilize climate, the studies are that roughly a third of the species on Earth could be placed on the road to extinction by the time a typical college student is in the prime of their career."
Dr. Richard Alley: "And then there's the ethical thing. The top picture here (Geographic disparities and moral hazards comparing maps, pointing at CO2 map of the world), the countries in red (North America, Asia, Europe, etc.) are emitting a lot of CO2 per person, per year. The ones in blue (Africa, South America, etc.) not much down here who suffers from the warming. All future generations and poor people in hot places now. And if you notice these two plots (both maps) sort of look like they're backwards from each other. The people causing the most warming are suffering the least from it. I quoted Pope Francis here, that we can't leave this to a future generation. I could quote many other religious and ethical leaders; this does not look like the golden rule. So, if we get a handle on this, larger economy, more jobs, improved health, greater national security, cleaner environment, more consistent with the golden rule. How do we do that? Let's go take a look at a few of the many options."
Video 6: Some of the Possible Solutions (8:53 minutes)
Dr. Richard Alley, College of Earth and Mineral Sciences, Department of Geosciences: "So now, some of the possible solutions for building a sustainable energy system. The solution space is huge. And we're only going to highlight a very few things here, but I'm picking out some of those that are especially likely to help."
Dr. Richard Alley: "Start here (map of the world comparing croplands and rangelands). Everything in color on these maps, we use to get the 2,000 calories per person per day that are the human diet. On top is crop lands, on the bottom is grazing lands where animals eat grass, and we eat the animals, or we milk them. Suppose we decided to replace every bit of external energy used by every human from oil, and coal and gas, and nuclear, and everything else with a modern solar farm. And then we added a little extra to allow growth. That pink square in the Sahara (indicating on map), would be enough to replace all external human energy use. Okay now we're not going to put it all there, some of it's on the roof over my head right now, but that gives you the scale. It's a huge area. It's a huge task. But it's surely doable, and that's the really important thing, and it's small compared to what we've already done to the land."
Dr. Richard Alley: "When we made the PBS miniseries, Earth The Operators, manual we got to go talk to some Texas ranchers, they were having real economic trouble. There was danger of the town going broke, the high school being closed, people losing the ranch. They put in a wind farm, and they get what they call mailbox money. You go out to the mailbox and it's full of money. 5% of the land in and renewable energy, often pays more than 95% of the land in the old ranching. If we put a wind farm on the windy parts of the plains and deserts of the world, the places where the wind blows enough to run the turbans at least 20% of the time, that would be five times more energy than now used by all humans. So, the resource is there. The International Energy agency, they spent a lot of years sort of not being enthusiastic about renewable energy, but by 2020 they got to the point of saying hey it's the cheapest electricity in human history. Cheaper than anything else in many places. Okay? So, the cheapest electricity in human history with a resource that's far greater than what we can use at this point. But there are ways to combine this wisely. This particular experiment was done at Oregon State, it dries out there in the summer, and when they put solar cells in it held some snow underneath early in the year, it kept it a little moisture farther into the summer. They got extra hay cutting because they were also getting extra electricity from the solar cells."
Dr. Richard Alley: "This was an experiment done in Germany. They made High solar cells you could drive tractors under. They planted different crops extending outside and under, so they could compare how it worked. And this summer had a nasty drought, and in this summer, they got more food where they were also getting electricity. So, you're getting more money from the electricity, but they also got more food because of reduced evaporation in the drought. So there are ways to combine these things. Right? There are just times when it's nice to have a little shade, and because the area needed to do this is so small compared to the area we use for agriculture, you could design things that give us the best of both worlds. This particular study said, you know global energy demand would be offset by solar production if less than 1% of crop land is converted to this dual use. We grow food and we eat it. We grow food and we feed it to animals, and we eat them, or we milk them, or take their eggs. We grow food and we burn it. Some of it is ethanol in in gas tanks and we burn palm oil, and other things. Biodiesel. We use more than 1% of the crop land now for food that goes into biofuels, than we burn. We could get all of our energy from that much area. So, somebody says oh we don't have the land to do this, they're not really serious."
Dr. Richard Alley: "You go places that we irrigate. Water is evaporating from the irrigation canals, and that's food that we're not growing. If you put solar over the top of the irrigation canals, less evaporation, more water, more food, and you're getting energy from those solar cells. It's a win-win-win. This is for the US grid. This comes from Lazard, the world's largest independent Investment Bank (graph of cost of energy comparison on screen as of November 2019). They've said suppose there were no subsidies for wind and Sun, how much does electricity cost if you want to add a little to the US grid compared to other sources? And here's a blow up of this (showing from cheapest to most expensive: Utility scale solar, wind, gas peaking nuclear, coal, and gas). Cheap as is over on your left expensive is over on your right, going that way. And what you'll notice here, (circling Utility scale solar and wind) is that the renewables are the cheapest now. Gas generally costs more, coal costs a lot more, nuclear is having real troubles being competitive. Gas peaking is just you run it when you really need it. These two diamonds down here (circling gas peaking nuclear and coal) are if you have an old nuclear plant, or a coal plant, it's completely paid for. It is wired in. All the construction is done, and you're not paying it off. And that's just to operate it. Compared to building and operating new renewables this is why you're seeing coal and nuclear in looking for subsidies from state governments and elsewhere, because they're having real trouble competing with the renewables at this point. Now this would look much better for the renewables if fossil fuels were not subsidized. Because we now have authoritative statements that the fossil fuels are much more subsidized than the renewables are."
Dr. Richard Alley: "So, this is something from people working with the international monetary fund, the IMF has been updating this, and they found that now the subsidy for fossil fuels in the world is more than $7 trillion dollars a year, or more than 7% of the world economy. More or less, when we pay a dollar for fossil fuels, society pays another dollar. Some of this is direct subsidy, tax breaks and other things, mostly it's because when we burn fossil fuel, the cost of the health impacts, the cost of the change in climate, is paid by society not by the consumers of the fossil fuel. And the IMF folks found that if we eliminated this subsidy, we would cut air pollution debts, we would reduce CO2 emissions more than half, we will increase the well-being of people."
Dr. Richard Alley: "Now do not kid anyone. Building a sustainable future is going to be hard, it is going to be decades. We don't really have all of the answers. But we now know that it can be done. And if you're a young person, you're part of the first generation in history that knows that you can build a sustainable energy system, and that doing so can help the economy, and health, and security, employment, environment, ethics. I took this picture in Greenland. Can we really have a world with icebergs and rainbows? Yes, we can. And I think that is really good news."
Video 7: A Few Thoughts on Communications (7:48 minutes)
Dr. Richard Alley, College of Earth and Mineral Sciences, Department of Geosciences: "So, a few thoughts on communications. If the new energy world is so wonderful, why aren't we moving forward on it faster? It's a really valid question."
Dr. Richard Alley: "This came out in 2024 (NATO Climate Change and Security Impact Assessment), from the North Atlantic Treaty Organization, NATO, you're welcome to stop this and read the text if you'd like, but the key part is at the bottom. They found that Kremlin-backed, that is Russian actors, are pushing climate change denialism. They are actively attempting to derail climate change, mitigation policies, and renewable energy Investments. Why would they do that? Well, the world bank has been tracking these things, and they said that roughly $1.5 trillion dollars per year across the world, goes to oil producers. Not for finding, drilling, pumping, and shipping the oil, but because they control a scarce resource. The extra above what's needed to produce the oil is a trillion and a half dollars a year. The cheapest oil producers can probably make it for $5 a barrel, and they're getting something vaguely like $75 a barrel, and that might be a really strong reason why some actors, Russia, and others, could be working to block progress on this. In addition to this grossness misinformation though, they really are issues, that really do matter in the energy transition. The change won't be easy there are things we have to learn yet. There are some things that won't work beautifully initially. It took us a century to learn how to handle most of the explosions, and the leaks, and the carbon monoxide, and all these other problems that come with fossil fuels. Which are really huge and dangerous. It's likely to take us at least 30 years to replace that with something even better. And for example, even though we will get more good jobs by doing the transition right, some people will lose jobs as we switch. And either we take political actions to help them, or we will have some unhappy people, mostly concentrated in certain places."
Dr. Richard Alley: "This map (Overall employment carbon footprints, by county in the United States) was published in the proceedings in the National Academy of Sciences, and it's showing how much CO2 is produced per year by a typical job in each county in the US. So, this is tons of CO2 per year from the average job in each county. The Bluer ones, as low as 1.5 tons. The redder ones, as much as 2,000 tons. Now there is a cost to society of this, the cost to health, the cost of climate change. The paper took an estimate of what this cost is, and then applied it to the CO2 from the jobs. The lowest ones below $400 for a job for the cost of society of the warming from other things from the CO2. The highest ones almost half a million dollars. Alright? So, I hope it's evident, that relatively few jobs produce most of the CO2, but those jobs are very important in some counties. And either we do things politically to help people in the transition, or there will be very strong unhappiness in some places."
Dr. Richard Alley: "Now a few thoughts on communicating this. Please note that the color scale will be different in the next plots, they were not done by the same people. Bluer now is going to be sort of rejecting climate change, and redder is accepting. This is work done by Yale Climate Communications, they are very well respected. A note here, a map is a valid way to look at the US, but it is not the only way. So, if you go up to the dot (showing population map in the United States) that's Philadelphia up there, there are almost three times as many people in Philadelphia as are in the entire state of Wyoming. The Philly metro area, which is more or less that little blue circle up there in the right, has more people than all six states that are outlined in pink there (Alaska, Montana, Wyoming, Idaho, South Dakota, and North Dakota). More people than all six put together. But those states have 12 Senators, Philly does not. Okay, so most Americans accept climate science, you'll see that down below which is the people part (on map). But we'll see that people in most of America, are not as sure about climate science. And so, a map based on area, and not people, can give you a very odd view of the country."
Dr. Richard Alley: "So, this one, to ask, is global warming happening (Another map of the US, circling a county in Utah). There's a couple of counties that said no, but most places said yes, and most people certainly said yes. Is it caused mostly by humans? Most people still say yes, but now huge chunks of the country are saying no."
Dr. Richard Alley: "Do scientists agree? You learned about this from scientists, yet a lot of places think that scientists don't agree, most people still say they do. Somebody probably paid a lot of money, and a lot of effort to confuse the public about this one. Are you worried about it? The worries are actually somewhat higher, that probably reflects reality. Should we look for solutions, should we help find solutions? The moment we move from problem space to solution space, it's a very different view. When you get a job, the boss does not say bring me your problem. The boss says bring me your solution. And that's what America is saying, bring your solution. But are you talking about it with your neighbors? There are one or two counties that more than half of the people are, but that's just about it. We're not talking about it anywhere. This is, you might say this is the Uncle Ed effect. You sit down to Thanksgiving dinner, you say how about that global warming, Uncle Ed says oh it's an evil plot to take away my pickup truck, you say it's okay Uncle Ed, just calm down and pass the potatoes, and how about the Steelers. Right?"
Dr. Richard Alley: "So many people believe that we can successfully solve problems that they deny exist, and you just saw it there. Very few are talking about it. Personally, I think there's a real lesson here, and that communicating on solutions finding the good, as well as the bad, is really important. Because if we do that, we can build a sustainable energy system that will power everyone essentially forever, with a larger economy, more jobs, improved health, greater national security, in a cleaner environment, more consistent with the golden rule. And I think that's great news."
Optional Enrichment: Carving the Canyon and More
Carving the Canyon, and More on Radioactive Dating, and Radiocarbon ages of "Old" Living Clams
Many people are interested in the carving of the Canyon, and the age of the Earth, and related topics. Often, this interest is linked to certain objections to the science of an old Earth, possibly arising from the deeply mistaken idea that a person cannot be a good member of some religions while accepting the science of geology. (Full disclosure: Dr. Alley is a long-time member of a reconciling Methodist church.)
The short essays below address a few of the questions that Dr. Alley has heard in these areas, and may serve as starting points if you have additional questions.
Carving the Canyon
Really big, deep canyons are often found closer to mountain ranges than the Grand Canyon is—it’s fairly easy to cut deeply into something really high, while the river doing the cutting is still high and steep. So why is that immense canyon out there in Arizona, and how long did it take to cut?
A vigorous river is capable of cutting downward at 1 mm/year (or more, and glaciers may cut faster than that). At 1 mm/year, it takes 25 years to cut an inch, or only about 1.6 million years to cut a mile down and make the Grand Canyon. Usually, rivers don’t cut as fast as 1 mm/year because the rivers quickly get down close to sea level, which makes the river’s slope smaller and slows the erosion. But, the Grand Canyon probably took longer than that, as we’ll see soon, in part because the river had to cut several times deeper than the Canyon is!
The Grand Canyon likely owes its existence to several events, including opening of the Gulf of California causing “river piracy”, stealing a different river to run through the Canyon. As we saw way back in Module 2, sea-floor spreading began in the Gulf of California about 5 million years ago, and this likely triggered changes that propagated inland and eventually diverted the Colorado River through the growing Grand Canyon into the Gulf of California. The opening of the Gulf of California brought the ocean closer to the mountains, which steepened the streams flowing into the Gulf—the height of the mountains wasn't changed by opening the Gulf, but the horizontal distance a river had to flow from the mountains to sea level got shorter as the land ripped open.
In turn, this likely led to one of the rivers cutting into a high plateau and eventually cutting through a continental divide and diverting the ancestral Colorado River in an act of river piracy. A “continental divide” is the line on a map separating the rivers flowing to one ocean from the rivers flowing to another ocean, or somewhere else. As you might imagine (and as we discussed briefly back in the history of the closing of the proto-Atlantic and opening of the Atlantic in Module 4), the slope to one ocean from a continental divide is often steeper than the slope to the other ocean. The steeper side generally erodes faster, which causes the continental divide to move away from the steeper side toward the more-gradual side. (Eventually, this will lead to the slopes being similar on the two sides.)
But, the continental divide is irregular, not a straight line. Where a big river forms and cuts down, the slope from the divide to the river will be steeper than nearby, so erosion will be faster there and the divide will be forced away. Sometimes, this will cause the divide to intersect and “capture” the drainage of a stream that had been on the other side of the divide. (See the figure below.)
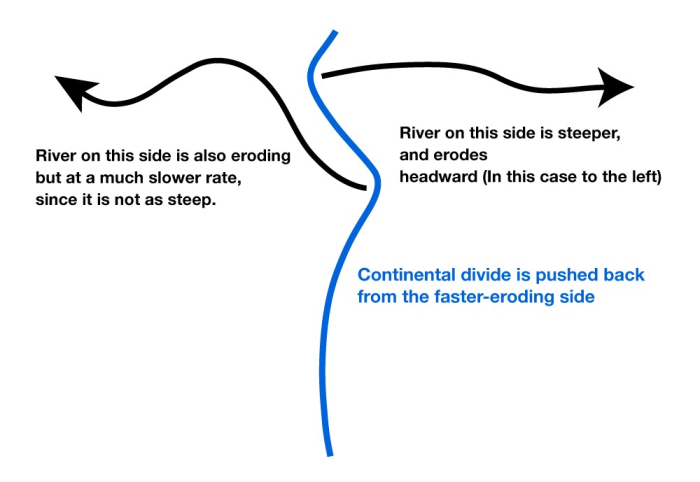
The upper panel in the figure shows two rivers (the black lines with arrows), separated by a continental divide (the blue line), viewed from above. If the right-hand river is steeper, then it will erode back until the headwaters of the left-hand river are “captured” in an act of “stream piracy,” as shown by the purple line.
There are lots of small rivers in the West with fairly big canyons—look at the most-of-a-mile deep canyon of the small Virgin River in Zion, or the remarkable amphitheater that tiny Bryce Creek has gnawed into the Paunsagunt Plateau to make Bryce Canyon. So, when the Gulf of California opened, the ancestral lower Colorado River steepened and cut headward (probably involving a piracy event with a stream exploiting the easily eroded San Andreas Fault), and pirated the ancestral upper Colorado River, which previously probably had drained internally (the river ran out into the desert and evaporated, the way some rivers do in Death Valley). This happened just over 5 million years ago; at that time, chunks of rocks of types that occur only up in the Rockies at the head of the Colorado River suddenly appeared in sediments of the Gulf of California, whereas before that time chunks of such rock types were absent in the Gulf of California.
You might think that with 5 million years of vigorous flow through the Canyon, the Colorado would have cut down even farther than it has, making an even deeper Canyon with a flatter, smoother river bed. But, the river has really had to cut the Canyon several times! Death-Valley-type Basin-and-Range faults associated with the opening of the Gulf of California also have cut across the Canyon, especially in the western end. Basaltic lava has come up some of the faults, in much the same way that the lava came up in Death Valley and in Red Canyon near Bryce. Several times over the last 5 million years, lava flows have dammed the Canyon, making lakes. Lakes accumulate sediment rather than eroding, while the erosive ability of the river is spent cutting through the dam. Once the river erodes the dam, it can then sweep out the loose sediment that accumulated in the lake, and then go back to deepening the Canyon… only to be dammed again by another lava flow. So, the river really had to cut down much more than a mile to make the canyon—cut down, get filled with lava, cut the lava, get filled again.
Why you don’t need to wait for a half-life to pass to measure it
In the text, you saw how radioactive decay occurs and provides “clocks” for the ages of rocks. Here, we go into a little more detail on the math, strictly for your entertainment and enjoyment.
The “law” of radioactive decay says that the more atoms of some radioactive parent you have, the more atoms of that parent will decay in some time. (There are many laws of this type: hotter bodies cool faster, rooms with more cats have more cats run out when you open the door, etc.). In addition, each radioactive parent type decays at its own particular rate, depending on the details of the quantum mechanics of its nuclear structure. Putting those words into math then goes like this. Given N parent atoms of some type, the change dN in the number of that type over some interval of elapsed time dt is:
The minus sign occurs because the number of parent atoms is decreasing over time as they decay to offspring. The K is a constant, called the decay constant (and often indicated with the Greek lambda, but we’ll stick with K). The numerical value of K is different for each different radioactive parent type, and includes the “physics” of how unstable the parent type is. A large K means a very unstable parent and a very rapid change to offspring; the units of K are inverse-time (so 1/seconds or 1/years).
If you never studied calculus, or you forgot what you studied, you won't make much sense of the next little bit. Don't worry. Those of you who took a calculus course and remember it will know that you can rearrange the equation to obtain:
Integrating yields:
in which ln indicates the natural logarithm, C is a constant that we will determine, and t is the total time that has elapsed. Taking the exponential of both sides, and noting that the decay started at some time t=0 when there were N=N0 parent atoms, yields the standard decay equation:
in which exp indicates the exponential (it usually appears as ex or exp or inv ln on calculators). The negative in front of Kt is equivalent to writing N=N0/exp(Kt). As t becomes large, exp(Kt) becomes very large, so N=N0/exp(Kt) becomes very small—the equation says that after a long time, you run out of parent atoms, which is correct.
Notice that if you can measure N0, wait for some time t1 and then measure N, the only unknown in this standard decay equation is K, so K can be calculated readily. The natural logarithm, ln, reverses the exponential so that ln(exp(-Kt))=-Kt. The natural logarithm appears on most calculators as ln or ln x or possibly as inv exp. Using this,
You usually will see this written as:
using one of the properties of logarithms.
We next estimate the half-life, t1/2. Note that after one half-life, N=N0/2. (So half of the parents have changed after one half-life.) If we let N=N0/2 in the standard decay equation, take the natural logarithm of both sides, remember that -ln(1/2)=ln2, and rearrange, we obtain t1/2=(ln2)/K. This is the basis for the statement in the text that you do not need to wait for a full half-life to pass if you wish to learn the half-life; you just need to start with N0, wait for any time t1, measure N, calculate K from this, and then calculate t1/2 from K. The half-life is useful, but most professionals in the field use the decay constant K most of the time, because K is more “fundamental” (it appears in the statement of decay given first above, and does not need to be derived as for the half-life).
Radiocarbon Revisited
You won’t have to look very far on the web to find sites—usually attached to certain religious ideas—complaining about errors in radiometric dating. (And Dr. Alley was once shown a published tract pointing out how stupid Dr. Alley himself must be to think that he could count more annual layers in an ice core than the total age of the Earth as estimated from writings in a particular religious text!) Some of the objections to radiometric dating are fairly silly, and even some of the young-Earth sites have put up notes asking followers to avoid using certain common arguments against scientists because those arguments are just wrong. The “5000-year-old” living clam falls in this category, as described later in this enrichment. The bottom line is that radiometric dating is useful, practical, successful, matches written records as far back as they go, matches other indications beyond that, and reveals a deep and fascinating history. Radiometric dating is not perfect, it does include errors, and practitioners have to know what they’re doing and think about it, but it works.
Skeptics about the use of scientific age dating in geology and the age of the Earth have especially focused on complaining about radiocarbon dating. This focus is odd, because radiocarbon—also called carbon-14—is not used in establishing the age of the Earth, or the age of the main geological events. The half-life of radiocarbon is only 5730 years; samples older than about 50,000 years have nearly run out of radiocarbon and so cannot be dated by radiocarbon. But, radiocarbon is used a lot in dating archaeological sites, and this may have caught the attention of people who study early written histories. In addition, as you will see, radiocarbon is more complex than many others (such as the potassium-argon system discussed in the regular text), and it may be easier to argue about complex things.
Much of the complexity of radiocarbon arises because the offspring of radiocarbon (the gas nitrogen-14) is very common, and is not retained well by the samples that are dated using radiocarbon (wood, charcoal, bone, or other formerly living things—not most rocks). Thus, radiocarbon dating does not look at the parent-to-offspring ratio; instead, the starting concentration of radiocarbon is estimated, the concentration today is measured, and the ratio gives the age. Radiocarbon is mostly made in the atmosphere, when cosmic rays collide with atoms and knock off neutrons that then hit nitrogen-14 nuclei and make carbon-14. This doesn’t happen very rapidly; natural production is just about 15 pounds for the whole Earth per year, or just over two carbon-14 atoms per square centimeter (just under 1/2 inch on a side) of the Earth’s surface per second.
In the atmosphere, radiocarbon quickly combines with oxygen to make carbon dioxide. The atmosphere is well-mixed—release some gas molecules here, and within a few years they will be spread fairly uniformly around the planet—so the radiocarbon-bearing carbon dioxide is quite uniformly distributed around the globe. Green plants grow by using carbon dioxide, and roughly one of each trillion carbon atoms in the atmosphere and in green plants is carbon-14 rather than stable types of carbon-12 or carbon-13. Plants are eaten by animals. Most animals live less than 100 years, whereas most carbon-14 lasts thousands of years, so when plants and animals die, they have just about the same ratio of carbon-14 to carbon-12 as was in the atmosphere when they were still alive. After plants or animals die, they do not breathe or eat any more, so they don’t take in carbon-14 while the carbon-14 in them decays. Hence, the ratio of carbon-14 to carbon-12 in a formerly living material is a clock.
Whole textbooks can be written refining the previous two paragraphs, and a scientific journal, Radiocarbon, focuses almost exclusively on the topic. If you aren’t a real stickler for accuracy—if “this died sometime between 9,000 and 11,000 years ago” is good enough for you—then you really don’t need a whole journal devoted to radiocarbon. (You still need to worry about one or two things that we’ll come to, but not about too many.) But if you want to get the answer right to within a few decades or less, then you have to be really careful.
One problem is that production rates of radiocarbon have varied over time. When the sun is more active or the Earth’s magnetic field is stronger, they protect us more from cosmic rays and reduce production of radiocarbon. The changes are not huge, and there are ways to correct for them (changes in the strength of magnetization can be estimated by measuring the degree of alignment of the “magnets” in lava flows or sediments of different ages, and the activity of the sun can be tracked from the magnetic measurements plus the ice-core concentrations of beryllium-10, which is also made by cosmic rays).
Changes in the Earth’s carbon cycle also matter a little to the history of the starting concentration of carbon-14 in plants and animals in the past. For example, now we are pulling up immense quantities of really old fossil fuels that do not have any remaining carbon-14, and burning those fossil fuels to make carbon-14-free carbon dioxide that goes into the atmosphere, diluting the carbon-14 there. When we humans were busily blowing up atomic bombs in the atmosphere, they made a lot of carbon-14. Before we were so influential, changes in carbon-14 in the atmosphere were MUCH smaller, and changes in ocean circulation were probably most important—some carbon dioxide goes from atmosphere to ocean, and the ocean waters sink in certain places and spend a thousand years or so down deep before coming back up to exchange carbon dioxide with the atmosphere. Because some of the carbon-14 from the atmosphere ends up decaying in the deep ocean, the ocean circulation actually reduces atmospheric radiocarbon—if water didn’t sink into the deep ocean, there would be less carbon-14 there and less carbon-14 decay there, and that would leave more carbon-14 in the atmosphere. At certain times in the past, less sinking of ocean waters seems to have occurred, allowing more carbon-14 to exist in the air.
The usual way to handle all of this is to use radiocarbon to date tree rings (which quit exchanging carbon with the atmosphere as soon as they grow) or shells in annually layered sediments, and use the layer-counted ages and the known half-life of radiocarbon to calculate the starting concentration of radiocarbon. Because radiocarbon is well-mixed in the atmosphere, and must have been well-mixed in the past, a calibration curve developed from samples anywhere on Earth can be used for samples from anywhere else. You can also date some samples, such as corals or cave formations, using two techniques: an accurate technique such as uranium-series disequilibrium, and radiocarbon, and so obtain a calibration curve for the radiocarbon. Many different calibration studies have been conducted, and while they do not agree perfectly and research is ongoing, they agree reassuringly well. The biggest corrections are a bit more than 10% with uncertainties of less than 1%—a sample that looks to be 10,000 years old, assuming that there were no changes in radiocarbon concentration of the atmosphere, is actually about 11,500 years old, because the radiocarbon concentration of the atmosphere did change, and the uncertainty in this is less than 100 years.
If you are primarily interested in the question “Does the world really look older than written records”, even radiocarbon provides a very good answer (“Yes, with very high scientific confidence”). Science has long since moved past that question, and the research frontier involves numerous fascinating questions, such as whether we can reconstruct changes in ocean circulation from the changing calibration of the radiocarbon clock after correcting for the changes in the sun and the magnetic field.
Plants actually have a slight preference for carbon-12 over carbon-13 or carbon-14 (the lighter atoms diffuse into the plant and react more easily), so the concentration of carbon-14 in a plant is slightly less than the concentration in the air. The preference for carbon-12 over carbon-13 is half as big as the preference for carbon-12 over carbon-14, so measuring the concentrations of all three types allows an accurate correction; this measurement is made easily and is done routinely when highly accurate dates are needed, so it should not bother anyone much.
The 5000-year-old living clam raises a different but interesting issue. All of the discussion so far has assumed that the items being dated obtained their carbon from the atmosphere. That is almost always a pretty good approximation for almost everything. But suppose that you “ate” only things that had been dead for a long time—you would not take in much radiocarbon, and so you would look old to someone who assumed that you ate things containing normal concentrations of radiocarbon. Certain special ecosystems on the sea floor do just that; they live on natural oil seeps, eat the oil or eat things that ate the oil, and the oil is old and so lacks radiocarbon. If you were stupid enough to sample these and assume that they were eating “normal” foods, then you would mistakenly assume that the living creatures had been dead for a long time.
Such oil-seep ecosystems are quite rare and special. A more-common situation is a clam in a creek in a carbonate terrain. When caves are being made, the chemical equation for the water and carbon dioxide dissolving the rock is:
H2O+CO2+CaCO3→Ca+2 +2HCO3-
The rain and atmospheric carbon dioxide on the left of the equation combine with the calcium carbonate of the limestone, yielding the calcium and bicarbonate ions on the right-hand side of the equation that are freed to wash down the creek. If a clam is making its CaCO3 shell from the water, the clam just runs this reaction backward. Notice, however, that half of the carbon, C, in the water came from the atmospheric CO2 and half from the rock. The rock is almost always very old, and has no radiocarbon. So, a clam in this situation would form a shell with only half as much radiocarbon as for a clam growing in a stream that does not drain carbonate rocks and that gets all of its carbon from the atmosphere. Hence, if scientists were clever with their instruments but stupid otherwise, those scientists might end up thinking that a living clam had been dead for over 5000 years.
Scientists are fully aware of this. For decades, however, there was a convention of reporting all radiocarbon measurements as the equivalent age assuming that the sample had been in equilibrium with the atmosphere. Dr. Alley is reasonably confident that the myth of the clam that was living yet the scientists thought it was thousands of years old came from work by a distinguished senior colleague, who in the 1960's published papers listing dates in the conventional fashion. That colleague actually was using the results to learn about the geochemistry of the waters. As noted above, some of the young-Earth-creationist websites have asked their supporters to “clam up” about this, because using it in an attempt to discredit scientists instead makes the young-Earth-creationists look confused.
As a possibly interesting aside, the natural flavoring vanilla is obtained from the pods of a tropical orchid, but the main chemical in vanilla can also be obtained from petroleum much more cheaply. This creates an incentive for cheaters to sell petroleum-extracted vanilla as the real thing. Cheaters can be caught, though, because real vanilla contains radiocarbon but the fossil-fuel version does not. When Dr. Alley was writing this, commercial testing for a small fee was available to protect consumers and natural-vanilla producers.
Optional Enrichment: Widening and Narrowing
Video: Widening and Narrowing (2min 22sec)
Back in Module 5, you learned about landslides and rockfalls. In Module 6, you saw that rivers can cut down, but this makes steep slopes that can experience those landslides and rockfalls. This produces V-shaped river valleys. With all this knowledge, you could have played professor and explained the shape of the Grand Canyon to a tourist who had not worked through those earlier Modules. Here’s how we explained it with the CAUSE class. See how you do…
Click here for a transcript of the Widening and Narrowing video.
I was out at the Grand Canyon a few years ago. And I was standing behind the fence there. And I was talking to a very nice and knowledgeable ranger about the history of mining at the place. And we were looking at those incomparable cliffs. And there's sort of a cliff of limestone, and a slope of shale, and a cliff of sandstone on another slope, and so on, on down to the river sitting way down below someplace like that.
And while we were standing there talking, this gentleman walked up, and he asked us why the river had gotten narrower. And we gave him a confused look. And he said, well, the river down there is very narrow. But if you try to look all the way across to the North Rim which is way the heck over there, what you see is, in fact, that the top is very broad. So he sort of figured that the river had been wide, and then it had gotten narrow.
Now, right beyond the fence there was a bit of a crack down into the cliff-forming rock there. And I ask him whether he would have any interest in going out beyond that crack and taking a jackhammer and starting to work on it. And he offered the opinion that eventually it would break off. And that when it broke off, that he would end up somewhere down the slope with a big rock on top of him, and that that would not be a good thing to do.
Well, then I ask him if he looked across the canyon, did he see places where a lot of rocks had piled up that looked like they had fallen off of the cliff. And he said, well, yeah I do. And that one fell. And this was a bright person. He immediately got it. He says, oh, what happens then is that the river must cut down. And once the river has cut down some, then, this slow process of mass wasting is going to widen it.
And in particular what happens is that the shales, the slope-formers cut down. And that makes the cliffs higher. And if the cliffs get really high, they tend to fail, and blocks fall off. And so that after a while you look at it, and you find that the canyon sort of has the same shape that it used to. But it's gotten wider as well as getting deeper as the river comes down.
Module 10 Wrap-Up
Module 10 Wrap-Up
In Module 10, you have taken a virtual hike to the bottom of the Grand Canyon, and made it safely back up, doing geology all the way. You have learned to estimate when events occurred in the past by using annual layer counts, “uniformitarian calculations” from the nature of the rocks, the time needed to form such rocks and radioactive dating. You know a little more about the very long, fascinating history of the Earth.
For many of you, this 4.6 billion-year history is pretty obvious now. You learned it first in elementary school, had that reinforced a few times since, and now we’re just repeating things you don’t need to have repeated. But for some of you, this is a major issue, because you have never learned it, or you were told not to learn it, or you otherwise have real issues with it. We have provided a lot of information in the main Module, and a lot more in the Enrichment, to try to give all of you a solid background so that everyone can do well on the RockOn Quiz.
Please note that if you still reject the geology, that’s fine, we can’t force you, and we don’t want to force you. But, you should give the geologically accepted answers on the RockOn Quiz, to show that you have understood the material. Those answers are that the Earth has a long, complicated history, and that there is no serious scientific argument about this.
Review Module Requirements
You have reached the end of Module 10! Double-check the list of requirements on the Welcome to Module 10 page and the Course Calendar to be sure you have completed all the activities required for this module.
Reminder
Continue to work on Exercise #5. See the Course Calendar for specific dates.
Comments or Questions?
If you have any questions, send an email via Canvas, to ALL the Teachers and TAs. To do this, add each teacher individually in the “To” line of your email. By adding all the teachers, the TAs will be included. Failure to email ALL the teachers may result in a delayed or missed response. For detailed directions on how to do this, see How to send an email in GEOSC 10 in the Important Information module.
Module 11: Evolution & Extinction
Welcome to Module 11
Welcome to Module 11!
Living on Earth I: Evolution & Extinction
Ah, memory lane. Dr. Alley's best friend in early elementary school had a father who sold "pop" (also called soda, or soft drinks) to dealers in Ohio and often had free samples sitting around, and a mother who drove a 1964-and-a-half white Ford Mustang with a black convertible top. Hard to beat. And what a beauty that car was! Dr. Alley's Hot Wheels Mustang was a 1967, recognizably different from the '64-and-a-half. In fact, he could easily put the Mustangs in chronological order based on the differences between models.
The early geologists of the late 1600s and 1700s had never heard of Ford Mustangs, but those geologists faced a Ford Mustang problem. Recognition of unconformities and other features in the rock record opened a world far older than written records. William Smith had demonstrated the usefulness of the law of faunal succession, so those geologists knew that putting the rocks in order put the fossils in order, and thus the biological change had accompanied geological change. But was the biological change gradual, parent to child in a great, unbroken evolutionary chain of being? Or did unknown cataclysms, or a tinkering god, or an angry god, repeatedly replace one world with another as Ford would one day replace each Mustang with a new model the next year?
Erasmus Darwin was a doctor with an interest in nature, and he put his ideas about evolution into poetry, which was published after he died. A few of his lines from The Temple of Nature (1802):
Organic life beneath the shoreless waves
Was born and nurs'd in ocean's pearly caves;
First forms minute, unseen by spheric glass,
Move on the mud, or pierce the watery mass;These, as successive generations bloom,
New powers acquire and larger limbs assume;
Whence countless groups of vegetation spring,
And breathing realms of fin and feet and wing.
OK, maybe this excerpt wouldn't make a hit song if put to music. But when his grandson Charles Darwin added observations and understanding of mechanisms of evolution to Erasmus' speculations, the evolutionists won the scientific argument over the Ford-Mustang "catastrophists." What convinced the scientific community (and "polite society") that evolution is indeed correct? We'll try to answer that fascinating question in this lesson.
Learning Objectives
- Understand that evolution is fact and more, predicts as well as explains, helps people do useful things, is not anti-religious, and that there are no serious competing scientific ideas.
- Explain how diversity generated during the reproduction of living things affects the ability to survive and reproduce, with successful experiments being passed on to accumulate and drive evolution.
- Describe how natural climate changes, and in one case a meteorite impact, have led to rapid mass extinctions that opened up opportunities for the slow evolution of new types.
What to do for Module 11?
You will have one week to complete Module 11. See the course calendar in Canvas for specific due dates.
- Take the RockOn Quiz
- Take the StudentSpeak #12 Survey
- Continue working on Exercise #6
Questions?
If you have any questions, send an email via Canvas, to ALL the Teachers and TAs. To do this, add each teacher individually in the “To” line of your email. By adding all the teachers, the TAs will be included. Failure to email ALL the teachers may result in a delayed or missed response. For detailed directions on how to do this, see How to send an email in GEOSC 10 in the Important Information module.
This course is offered as part of the Repository of Open and Affordable Materials at Penn State. You are welcome to use and reuse materials that appear on this site (other than those copyrighted by others) subject to the licensing agreement linked to the bottom of this and every page. Students registered for this Penn State course gain access to assignments and instructor feedback and earn academic credit. Information about registering for this course is available from the Office of the University Registrar.
Main Topics: Module 11
Main Topics: Module 11
Evolutionary Theory includes Facts and Much More
- A scientific theory is an explanation of nature that has been tested and confirmed repeatedly, that predicts successfully, and that places facts and laws into a larger context to help us understand and make new predictions.
- The theory of evolution is highly reliable and useful, not tentative and uncertain.
Easy Come, Easy Go--How Evolution Works
- Parents reproduce by having kids.
- Kids include experiments introduced during reproduction—the kids are not identical to their parents.
- These differences often affect the ability of the kids to survive to have their own kids. This leads to natural selection - the kids with differences that favor survival tend to survive to have kids.
- But, despite the differences, kids are quite similar to their parents—the kids just receive a bit more or less of what makes their parents biologically successful.
- These processes acting over time give evolution—successful experiments accumulate in new generations, and unsuccessful ones are eliminated so that new generations slowly become different from older ones.
- Changes to living organisms are not passed on (if you get a tattoo, your kids will not be born with tattoos)—but the reproductive experiments are passed on.
- Major changes must occur slowly over many generations, often thousands or more, to maintain “back-compatibility” — everything in a living organism needs to work together, so huge jumps do not succeed.
- Thousands of generations or more require a lot of time for large animals but can occur in less than a year for disease organisms.
The Unbroken Chain
- The Law of Faunal Succession that we met in Module 9 suggests that evolution has occurred.
- Evolution predicts gradual changes over time, and thus the occurrence of transitional forms, whereas other hypotheses such as special creation or catastrophism predict that there will not be transitions.
- Transitional forms have been found, strongly supporting evolution:
- Transitional forms are common in commonly fossilized types.
- And less common in less-commonly-fossilized types.
- Transitional forms are found as often as evolution predicts, and the fossil record disproves competing hypotheses.
- Transitional forms are not found everywhere for every species in the fossil record, in part because new species often evolved geologically rapidly from small populations in isolated places (it is easier for a smaller group to evolve).
Taking Care of Business
- The theory of evolution is explanatory, predictive, and useful.
- Germs are evolving antibiotic resistance, and the scientists trying to keep us alive are using knowledge of evolution to fight those germs.
- Computer scientists mimic evolution to solve complex problems (evolutionary computing).
Teach the Conflict?
- Scientifically, there is no conflict to teach—there is much to learn and do, but with no serious problems or competitors to our understanding of evolution.
- In particular, evolution is:
- Consistent with the second law of thermodynamics, and all other known physical laws,
- Strongly supported by the fossil record and age dating,
- Not anti-religion (indeed, it is supported by many religious groups).
- There is widespread and very strong scientific consensus that so-called competitors (e.g., “intelligent design”) are not science.
- Thus, “teaching the conflict” would require teaching non-science in science classes (but note that some groups, at some times, have tried to do just that).
Extinction Can Ruin Your Whole Day
- There has been a slow "background" rate of extinction, with species being lost about as often as new species appeared during most of geologic history (populations fluctuate up and down and sometimes hit zero, which is extinction).
- Occasionally there were mass extinctions when species became extinct much more rapidly than new species arose, but these mass extinctions were followed by millions of years when new species arose slightly more rapidly than old species became extinct, thus restoring biodiversity over millions of years.
- Major extinctions included:
- the end-Paleozoic mass extinction: volcanic CO2 drove extreme global warming.
- the end-Mesozoic mass extinction: a meteorite triggered immense changes in climate
- a few others that we won't make you learn in detail, that mostly were caused by large volcanic releases of CO2 that drove heating, loss of oxygen in the ocean, and other changes (note that the modern CO2 rise is unequivocally from humans, not from volcanoes, as we will see in Module 12).
- The dinosaurs were doing just fine until killed by changes triggered by a meteorite impact (and, some dinosaurs that were ancestors of modern birds did survive).
- The death of all of the non-bird dinosaurs freed ecological jobs (“niches”), allowing evolution to produce large mammals over the 65 million years between the meteorite and us.
The Dinosaur Killing Meteorite of 65 Million Years Ago
- Evidence: the geologic record of the extinction event occurs with an odd sedimentary layer containing much iridium (common in meteorites, otherwise rare on Earth), soot from wildfires, high-pressure shocked quartz, droplets of melted and then rapidly frozen rocks, a giant-wave deposit in places near the Yucatan including the Caribbean, and a giant crater of the right age on the Yucatan Peninsula.
- Mechanisms: the meteorite blasted things up, causing a fire from the heat when those things fell back to Earth, then cold and dark, from the sun-blocking effect of slow-falling things that also had been blasted up, with acid rain and then heating from CO2 released from the sulfate and carbonate rocks where the meteorite hit.
- A thought: there still are big rocks out there in space—averaged over millions of years (and presuming we humans hang around that long), they are likely to kill as many people as commercial airline crashes, but not nearly so many as car crashes, and we can reduce the dangers from airline crashes and car crashes.
Evolution on a Plate
Evolution on a Plate
Start by watching this one-minute-and-fifty-five-second video showing the evolution of antibiotic resistance. The medicines that saved the lives of your grandparents from nasty diseases often are completely useless for you, because the disease organisms have evolved. As explained in the video, the researchers prepared a simple demonstration of this important process. They started bacteria growing in good food for bacteria, but with nearby bands of this food containing low and then higher concentrations of an antibiotic. The bacteria initially grew rapidly in the food without antibiotic, but as the bacteria spread, they encountered a low concentration of antibiotic. You will see the growth of the bacteria stop as the antibiotic killed them… until first one and then another cell evolved a defense against the antibiotic, allowing the offspring of those special new bacteria to grow rapidly into the antibiotic-bearing food. The process repeated as the bacteria encountered higher and still higher concentrations of antibiotic. In 11 days, the bacteria were rapidly growing in the highest concentration of antibiotic, and were essentially immune to that medicine. (The researchers did destroy these bacteria after the experiment, but dealing with similar processes involving bacteria, antibiotics, and people is a very important issue.)
The evolutionary changes shown in this video were very small, although obviously important. But, the time used in the experiment was a tiny, tiny fraction of the billions of years of life on Earth. Evolution is real, and knowledge of it is really useful. So, let’s go visit a fascinating National Monument, and get started on evolution.
Video: The Evolution of Bacteria on a “Mega-Plate” Petri Dish (Kishony Lab) (1:55)
So what we ended up building was basically a Petri dish, except that it's 2 feet by 4 feet. And the way we set it up is that there are nine bands, and at the base of each of these bands we put a normal Petri-dish-thick agar with different amounts of antibiotic. On the outside there's no antibiotic; just in from that there's barely more than the E. coli can survive; inside of that, there's 10 times as much; a 100 times; and then finally the middle band has a thousand times as much antibiotic. And then across the top of it we pour some thin agar that bacteria can move around in. The background is black because there's ink in it, and the bacteria appear as white. First you see they spread in the area where there's no antibiotic up until the point that can no longer survive. Then a mutant appears on the right. It's resistant to the antibiotic. It spreads until it starts to compete with other mutants around it. When these mutants hit the next boundary, they too have to pause and develop new mutations to make it into 10 times as much antibiotic. And then you see the different mutants repeat this at 100, and after about 11 days, they finally make it into 1000 times as much antibiotic as the wild-type can survive. And so we can see by this process of accumulating successive mutations that bacteria which are normally sensitive to an antibiotic can evolve resistance to extremely high concentrations in a short period of time.
Evolution and Florissant Fossil Beds
Evolution and the Florissant Fossil Beds
In south-central Colorado, at Florissant Fossil Beds National Monument, you can visit a unique deposit of fossil trees, leaves, insects, birds, fish, and more from about 35 million years ago. At that time, a lava flow dammed a stream to form a lake. Then, repeated volcanic eruptions dropped silica-rich ash into the lake, making the water silica-rich and favoring the growth of diatoms, single-celled algae that have silica shells. When a leaf or dead bug fell into the lake, huge numbers of diatoms quickly grew on it in very thin layers, protecting it from decay until it was buried by paper-thin layers of ash and mud. Like flowers pressed in a phone book, the flowers of that ancient time can still be seen clearly. So can the dragonflies, bees, and mosquitoes.
There are, however, certain differences between some of those creatures and similar ones that live today. Remember, back at Arches National Park in Module 9, we learned about the law of faunal succession—when rocks are placed in order from oldest to youngest, the types of fossils in the rocks also fall into order, becoming more like things alive today in younger and younger rocks. The Florissant rocks are relatively young, and their fossils are immediately familiar to modern people, but the fossils are not identical to modern species.
The law of faunal succession suggests the possibility of evolution but does not prove it by any means. One early theory held that many creations and extinctions occurred over geologic history, something like the history of automobiles. One type of automobile does not give birth to another; new ones are created. But you can place the automobiles in order from oldest to youngest, and the younger they are, the more they look like modern automobiles. This idea was called catastrophism in geology. The fundamentalist interpretation of biblical creation is a one-event form of catastrophism.
Virtual Field Trip: Florissant Fossil Beds National Monument—Gnattily Dressed
Evidence of Evolution
Evidence of Evolution
Catastrophism eventually lost out scientifically to evolution, because evolution succeeds but catastrophism fails to explain the patterns of fossils and of living things, and to predict events such as the emergence of antibiotic-resistant microorganisms. The triumph of evolution over catastrophism owes much to biology, and more recently to genetics and molecular biology; the identification of the mechanisms driving evolution was especially important (see below).
As geologists collected more data, they joined the biologists in recognizing that evolution explained the data and predicted the next discoveries better than any catastrophist model, or any other model that anyone had ever suggested. The early geologists could see the clear change of types over time but saw catastrophic elements in the record as well. In many places, geologists would find fossils of one type, and then of a somewhat different type, with no transitions between them. Evolution implies rather gradual change, not big jumps. The early geologists knew, however, that there were big time jumps in the records (remember the many unconformities—time gaps—in the Grand Canyon sequence). So some of the jumps in the fossil record were related to the incompleteness of the rock record. And, there really were catastrophic extinction events in the record such as the meteorite that killed the dinosaurs (again, see below).
Further study has shown that many of the evolutionary changes have been biologically slow but geologically fast - recall how long geological time really is! And, many of the evolutionary changes occurred in small isolated populations that are not likely to have been fossilized. Suppose that a few animals of some type colonized a small island. Then, they had babies who had babies who had babies, a generation per year, thousands of generations in a geological eyeblink. If the babies differed by just a tiny bit from the parents, eventually a new type or species would have emerged. If that species then succeeded in escaping the island (say, because sea-level fell and the island became connected to the mainland), a new type could appear suddenly on a nearby continent. Sediments from the small island may have been subducted or otherwise destroyed, but fossils on the larger continent are more likely to have been preserved. A small island may support only a few individuals, so there never would have been many critters to produce fossils that humans could find. On the continent, the species might flourish and produce millions of individuals that left easily collected fossils. Thus, the fossil record would show a sudden jump when the actual process was gradual.
In one famous case (of many), trilobites of the genus Phacops are classified in part by the number of columns of elements in their compound eyes. In marine sediments from the Devonian (the middle of the Paleozoic) of Pennsylvania and Ohio, a species with eighteen columns in its eyes occurred for a while. Then, a time gap or unconformity occurred, from a temporary drying of the sea. When the sea returned and began depositing sediments again, the trilobites that returned with it had seventeen columns in their eyes. Not a huge jump, but an apparently sudden one. But wait—over in a small part of New York, the sea did not dry up. There, you can find the old eighteen-column trilobites, then some with seventeen columns plus a partial column containing a varying number of elements, and finally the seventeen-column trilobites. The generations of trilobites changed gradually, and you can see this where the rock record is complete in a small region of New York. In the bigger areas, the record looks more catastrophic because the seaway was dry and no fossils were produced when the changes were occurring through the generations living in New York.

You may meet someone who argues that no transitional fossils are known. This is wrong; extremely fine gradations are known in many, many lineages, including the Phacops eye columns. There is one technical sense in which, in some lineages for which fossils are scarce, there are missing transitional types. Suppose you find young fossil type 1 and old fossil type 0. They differ a good bit—you are missing the transitional form 1/2. Now suppose you find type 1/2. It is your “missing link”. You publish your results in important scientific journals, and wait for the fame and fortune to roll in. (You are likely to wait a looooooong time….) But, while you’re enjoying your discovery, someone argues that you haven’t really found the missing link, because now there are TWO transitional types missing: 1/4 between 0 and your newly discovered 1/2, and 3/4 between your newly discovered 1/2 and 1. So, you go back to work, and after years of effort, succeed in finding both 1/4 and 3/4. Wow! Now your critics point out that you are missing FOUR transitional forms (1/8, 3/8, 5/8, and 7/8). This can be argued to absurdity; we cannot find remains of every creature that ever lived, because almost all remains of almost all creatures are recycled by the efficient ecosystems of Earth (dead things are food to scavengers, worms, bacteria, fungi, etc.). But for many, many fossil types now, the gaps are vanishingly small, and the transitional forms are very well known.
The gaps in evolutionary lineages are especially well-filled for commonly fossilized types, such as creatures with shells from shallow ocean water. Shells are hard and resistant—they’re really rocks already—and so shells are preserved well. Sediments from the deep ocean are often lost down subduction zones, but shallow edges of continents are often preserved, with their fossils, for very long times. And while most of the land is eroding, most of the ocean is accumulating sediments.
The fact that most of the land surface is eroding complicates the study of the fossils that especially interest people. Think about central Pennsylvania for a moment, where Dr. Alley was sitting when he wrote this. The Commonwealth of Pennsylvania has about 1 million deer, roughly half bucks and half does, and each buck has two antlers, so Pennsylvania deer drop about 1 million antlers per year. If antlers were “preserved,” then after even a few thousand years of this, walking in the state should be dangerous, and we should hear about all sorts of antler puncture wounds from the billions of antlers scattered over the landscape. Of course, we don’t—mice, porcupines, and other creatures eat the antlers for the minerals in them. (People even collect a few shed antlers, but other creatures beat us to most of the antlers.)
In central Pennsylvania now, the only places you can find sediments being deposited are in the human-built reservoirs (which were mostly formed when dams were built in the 1930s, and so give very, very short records), a very few marshes such as Bear Meadows up the road from Penn State's University Park campus (this marsh formed during the Ice Age and thus is geologically very young), and in a few caves and along a few streams. But, the caves and stream deposits don’t last long—the caves are lost as the surface is lowered, and the streams sweep across their flood plains and move the sediments on. So central Pennsylvania today is not making much of a fossil record.
Despite difficulties such as this, careful study around the world has filled in many of the details of the fossil record, including many “missing links.” (In 2001, for example, road-builders accidentally discovered Riverbluff Cave in Missouri, with loads of ice-age fossils that offered a new window into that interesting time.) For some types of creatures, such as hominids, fossils are still scarce enough that a new find often makes headlines, and may cause a small change in the prevailing view of evolutionary history. And there was lots of excitement in 2008 when fossils of transitional flatfish were found—Darwin had worried about the way flounders evolved so the adults have both eyes on the same side of their heads, so the discovery of the transitional forms was another in the long string of successes for the theory he advanced. However, you almost never read about the great changes in thinking caused by the latest snail fossil—the record is so wonderfully complete that new insights are much harder to come by than they used to be.
The Facts and Theory of Evolution
The Facts and Theory of Evolution
At the start of this Module, you watched evolution occurring on a plate. Evolution has been observed in many other ways. These occurrences of evolution are facts.
Our understanding of evolution is more than these facts, though. Evolution places facts and laws, such as the law of faunal succession, into a larger context. Evolution has been tested and confirmed repeatedly, and predicts as well as explains. Evolution helps us understand what is going on, and helps us use that knowledge to do things that help people. Evolution, like relativity and quantum mechanics, is a scientific theory, the highest level of scientific understanding. The theory of quantum mechanics was used to design your computer and your phone, the theory of relativity is in your phone correcting the GPS data so you know where you are with great accuracy, and the theory of evolution is being used to fight diseases and keep you alive. Please note that calling evolution a scientific theory does NOT mean that it is speculative or uncertain, but that it is highly reliable.
The basis of evolution is diversity. (Modern social scientists and politicians are about 4 billion years behind nature on this one.) We know that kids do not look exactly like their parents—offspring are diverse or different. We also know that kids share more characteristics with their parents than with less-closely-related people from the parent’s generation. That is, we look a lot like our parents, but we are not exact copies. This arises because of genetics; the biological instructions or programs that guide the development of an individual are passed down from the parents, but there are many mechanisms active that serve to experiment a little with the instructions between generations, but not too much.
Suppose that one of these small experiments is successful (say, it gives a young giraffe a longer neck than her neighbors, which allows her to reach leaves that are out of reach of other giraffes). The long-necked giraffe will be better-fed than others and eventually is likely to succeed in surviving to have babies of her own. Some of those babies will grow a little taller than their mother, some a little shorter, and some the same height as their mother, but the offspring will average taller than the kids of other giraffes lacking the initial, successful change.
Those other giraffes lacking this new development will be less successful, and so will leave fewer babies who go on to have babies. Most populations are small enough that, if one individual is even slightly more successful than others, after a few thousand generations, all the survivors will be related to the one with the successful experiment; if one individual is even slightly less successful than others, after a few thousand generations it will have no survivors. You can demonstrate this easily using mathematical models, or with greater difficulty by breeding living types such as fruit flies, but both reach the same answer. Scientists have indeed been successful in causing evolution in the lab, and observing it in the wild. The evolution of antibiotic resistance that you watched at the start of this Module is one small example.
Once all of the members of a species contain the successful experiment, the species has been changed a little. But over those thousands of generations, other “experiments” are conducted, some successful and some not. The slow accumulation of successful experiments is evolution. The mechanism by which the changes accumulate is called natural selection—beneficial experiments allow more survival and reproduction and so are preserved and multiplied. When enough changes have accumulated, we say that a new type or species has emerged. (If a population is split into two or more parts, those parts are called new species when they no longer can interbreed.)
Notice that things that happen to adults, such as having their ears pierced or their behinds tattooed or stretching their necks to reach leaves, are not passed on to children. The changes that are passed on occur during reproduction. Sex helps generate new combinations of genetic instructions. Even species that reproduce asexually by splitting in half have ways (proto-sex?) to exchange genetic material. Sometimes, accidents occur owing to radioactive decay or toxic chemicals damaging the genetic instructions in an egg or sperm or asexually reproducing creature; however, these often are changes that hurt rather than help.
More importantly, the mechanisms of reproduction do experiment a little by moving a few things around in the genetic instructions during reproduction. Some species, and some individuals of species, conduct more experiments than others. Overuse and misuse of antibiotics by humans are producing antibiotic-resistant disease-causing organisms. These antibiotic-resistant types are often those that experiment a lot during reproduction, and so were lucky enough to quickly find an experiment that allows survival despite antibiotics.
The virus HIV that causes the disease AIDS is especially hard to “beat” with a vaccine or antiviral drug because the virus experiments a huge amount (perhaps the fastest known rate of mutation). It took decades for a large number of dedicated researchers to come up with a “cocktail” of drugs that gives long-term survival to HIV-infected patients. The rapid rate of experimentation in HIV is costly to the virus—many of the experiments are failures, which means those offspring don’t succeed. But, this high rate of experimentation allows the virus to respond quickly to challenges such as new drugs or vaccines by producing offspring with new ways to defeat those drugs or vaccines. In an AIDS patient, the viruses infecting different organs may be different. And, given that the AIDS viruses in just one person are so diverse, it is not surprising that the viruses in different people are different. The remarkable advances in molecular biology allow these changes to be measured now, but no effective vaccine has yet been developed to help people completely clear HIV.
Evolution is a well-tested, well-established science. It makes predictions that are borne out every day. Partial speciation has been achieved in the laboratory in fast-breeding types such as fruit flies. The geological evidence of gradual changes is strong, and becoming steadily stronger as more and more samples are collected.
Evolution is also being used routinely in science. The Evolution on a Plate video showed one reason why. A search on the ISI “Web of Science” in July of 2012 revealed over 3000 scientific papers on the subject "evolution and antibiotic resistance," with an ongoing rise in the number of papers on the topic. The same search in 2024 found almost 10,000 scientific papers. A quick perusal of the titles and abstracts of many of those papers revealed that, as microbes evolve to defeat our antibiotics, the scientists who are trying to keep us alive are using the tools and language of evolutionary biology. Antibiotics are quickly losing effectiveness against evolving microbes, and without major efforts, more and more people would be dying of infections picked up in hospitals, thus scientists are increasingly focusing on the problem, informed by a full understanding of evolution, its rates, and processes.
Computer scientists even use evolution—some “artificial intelligence” approaches have been patterned after the natural processes of evolution. Techniques such as genetic algorithms or evolutionary computation successfully solve complex problems, in essentially the same way that nature does. (For more on this, see the Module 11 Enrichment.) The computational pioneer Alan Turing suggested that scientists could mimic evolution to find solutions to complex problems as early as the year 1948, for example.
In the U.S., some groups continue to oppose evolution based primarily on religious grounds. This opposition has the good effect of keeping the experts “on their toes”—the experts work harder and do better science. This opposition has the unfortunate effect of convincing many people that something is fundamentally wrong with evolutionary theory, which may scare some students from entering the field and helping save lives, and may cause some people to ignore scientifically based advice and thus endanger themselves and others. Many of these people seem to believe that evolution is somehow anti-religious when the majority of church members in the U.S. belong to denominations that endorse evolution as the best description of how the biological world works. Evolution is consistent with the major religions on Earth, and even with rather strict readings of the Christian Bible. The idea that the Earth appears young, and was created recently with all of the modern types of organisms present, was tested in the 1700s and 1800s and proved wrong, as we saw in Module 10.
A longer discussion of some issues—how evolution can be consistent with religion, how evolution is consistent with the second law of thermodynamics, why "intelligent design" is not science, etc.—is given in the Enrichment. We strongly suggest that if you are interested in this topic, you read Module 11 Enrichment.
Extinction and Dinosaur National Monument
Extinction and Dinosaur National Monument
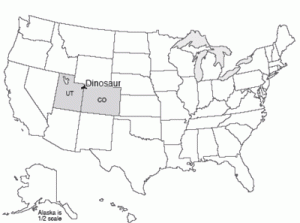
is licensed under CC BY-NC-SA 4.0
Dinosaur National Monument lies in western Colorado and eastern Utah. The key rocks were deposited in swamps and along rivers during the Jurassic in the middle of the Mesozoic, and are called the Morrison Formation. Before the modern Rockies were raised, sluggish streams flowed across the basins of this region, with numerous low, wet floodplains. Dinosaurs flourished. After some died, their bodies were washed up on sandbars, where their bones were buried before scavengers and gnawers could consume the bones. Over time, minerals carried in groundwater reacted chemically with the bones, depositing silica in them. (For a little more on petrification, see the Module 11 Enrichment—no magic is involved, and replacement by stone is a normal process that really is expected to occur in some places!)

After the bone was turned to stone at what would become Dinosaur National Monument, the rocks of the region were raised and tilted during the mountain-building that formed the Rockies. Streams, including the Green River, cut through the rocks. The Canyon of Lodore on the Green is a favorite destination for serious white-water rafting. The first scientist in the region was John Wesley Powell, who went on to run the Grand Canyon. In 1909, workers from the Carnegie Museum of Pittsburgh found Dinosaur Ledge, a sandbar-turned-to-stone on which many dinosaur bones had been deposited and fossilized. Today, some of those petrified bones are on display in the Carnegie Museum and in other great museums, but many of the bones have been left on the ledge to be viewed in the park (see the picture above).
How Did We Get Dinosaurs?
How Did We Get Dinosaurs?
The history of life on Earth is amazing, and much more has happened than we can possibly cover in this course. We will, however, give you a very short sketch of a few of the key events. You might watch the following short narrated video first (Evolutionary Process).
Video: Evolutionary Process (3:20)
Sometime about 3.8 billion years ago, life appears. And it starts coming up. There's new kinds appear. There's evolution going on. There's splitting of the types of things that are alive. And each of these lines represents a lineage. It's a living type, something that's alive in the world.
Now we know that about 570 million years ago, as oxygen is rising, as big critters are appearing, as shells appear, that there's this great diversification giving rise to lots of different kinds of life, which we call the Cambrian explosion. We find more and more types coming up. Each new living thing can give rise to other ones. And there's always some extinction going on, and so some of these lines don't come up to the today.
But there's quite a variety of life. Land plants appear. Land animals appear. And then we see this hideous mass extinction at the end of the Paleozoic, when most of the things on Earth died, probably because a really hot stagnant ocean is belching out poison gases that are really nasty. There's still a little debate on that.
We know that just a few things managed to get through that and that they then are spreading, giving rise to new species in the new world. Because all the big critters were gone, there's room now for diversification. You get dinosaurs appearing and the other interesting things.
The dinosaurs are actually doing very well. They're flourishing. They are the big critters. Mammals are around, but they can't beat the dinosaurs. And then the meteorite does, so you get the great mass extinction at the end of the Mesozoic. And just a few kinds, again, succeed in getting through.
Those few kinds that manage to get through again give rise to diversity. There's space for splitting, for new types to appear. And so over 10s of millions of years, we see the rise of diversity and the things coming up to today. And so the world goes back to being a very rich, very diverse place, again with some level of natural extinction, but with a lot of splitting going on, a lot of types getting up to today.
Now, a couple of things that you may want to notice. One is that there's different types, that you come over here and you'd see something that might be mammals, or it be some subset of mammals like bears, and they will seem to be very different from some other type. And that difference arises because the split that gave rise to those types is actually way the heck down here.
And you can follow one type up to here, and you can follow the other type on up over here. And so because they came so far down in time that they split, you'll find that they look like very different types today. The other thing to notice, there's a reasonable chance that today, as we see marked right there, today may be the next mass extinction if we don't change our behavior.
We don’t really know exactly how or when life started, but the geological record includes evidence of life almost as soon as conditions developed that could support life as we know it, perhaps as early as 4 billion years ago. Life mostly remained in the sea for much of Earth’s history, because life is water-based and tends to dry out on land. Before the start of the Paleozoic about 530 million years ago, most living things remained small and slow-moving, probably because oxygen remained scarce in the atmosphere. We get our energy by “burning” food with oxygen to release energy, and without oxygen, we couldn’t release energy rapidly from our food. The history of oxygen in the atmosphere is fascinating, with fluctuations caused by changes in tectonics and climate and evolution, and those changes affecting biodiversity; some of the important work was done by Penn Staters, but again, the details are for another course.
After oxygen finally became consistently common in the atmosphere, with plenty of dissolved oxygen in the ocean, large and active creatures evolved “quickly”, over 10 million years or so. Many of these had shells, which are preserved well as fossils, so the fossil record of life became much more interesting. The 10 million years of this “Cambrian explosion” at the start of the Paleozoic are not exactly an explosion, but after 3.5 billion years of small, rare fossils, a large increase in just 10 million years seems fast.
Through the Paleozoic, life spread onto land, large and agile animals evolved, trees evolved, and more. As life became more diverse, some species went extinct while new ones evolved. But, at least twice during the Paleozoic, and at the end of the Paleozoic, and once during the Mesozoic there were “mass extinctions”, when a lot of species went extinct in a short time, reducing biodiversity. Then, over millions or tens of millions of years, new diversity evolved.
We are not going to make you learn the details of these older mass extinctions (we’ll cover the one that killed the dinosaurs soon…). You should know that these older mass extinctions were primarily caused by climate change, and especially by extreme warmth from release of carbon dioxide from really large flood basalt volcanic eruptions (we visited this subject way back in Module 3 with Hawaii). The heat from the extra carbon dioxide reduced the dissolved oxygen in the ocean, and the ocean may have been overfertilized by rapid weathering of the new volcanic rocks, leading to “dead zones” and release of poison gas (hydrogen sulfide). The worst of these extinctions, at the end of the Paleozoic, involved temperatures too high for large animals to survive in the tropics on land and in the ocean, and may have killed 90% of the species on Earth at the time.
(We will revisit this issue of climate change and carbon dioxide next time, in Module 12. The release of carbon dioxide that drove these extinctions was as large or larger than what humans might do if we burn all the fossil fuels, but was much slower than we might do, giving prehistoric life more time to adapt. And, we do know that the modern rise in carbon dioxide is being driven entirely by humans, not by volcanoes.)
After each mass extinction, many “jobs” (often called ecological niches) opened up because the plants and animals that had been doing those jobs were all dead. The new species that then evolved often filled the old jobs, but in interesting new ways. The earliest dinosaurs evolved as diverse life returned after the worst extinction that ended the Paleozoic.
The dinosaurs were the dominant large animals on Earth for over 100 million years. Many were quite small, but some were gigantic. They included large plant-eaters and large meat-eaters. Some spent at least part of their time flying or gliding, and others swam.
Virtual Field Trip: Dinosaurs: Where They Lived, and How They Died
Virtual Field Trip: Dinosaurs: What They Stepped In
Want to see more?
Here is an optional vTrip you might also want to explore! (No, this won't be on the quiz!)
Dinosaur National Monument - Provided by USGS
What Killed the Dinosaurs?
What Killed the Dinosaurs?
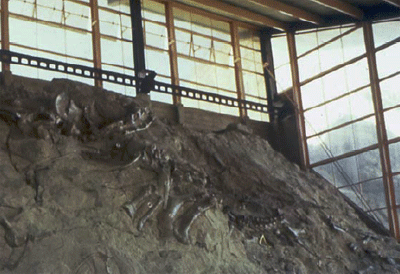
Mammals co-existed with the dinosaurs for most of the dinosaurs’ existence. However, almost all of the mammals remained small creatures—they generally could not outcompete the dinosaurs for the big-creature jobs.
Extinction is a normal process. A new species may arise and be more successful than an existing type, pushing the old type to extinction. Diseases, accidents, or other events may kill an entire population. And, extinction is forever. As populations vary owing to random factors, sometimes the population drops to zero. But when the population hits zero, the species can never come back up—you can’t just borrow a few creatures from a future generation and bring them back to fill in the gap. So all sorts of random events cause extinctions, and most of the species that have lived on Earth have become extinct. (This characteristic of extinction, that when you hit zero, you're gone, also applies to gamblers at casinos. To see why you’re likely to lose if you gamble, take a look at Module 11 Enrichment.)
About 65 million years ago, at the end of the Cretaceous Period of the Mesozoic Era and the start of the Paleogene Period of the Cenozoic Era (the K/Pg boundary, because K is used for Cretaceous and Pg for Paleogene; note that old literature used Tertiary rather than Paleogene and called this the K/T boundary), a very large extinction event killed most of the living dinosaurs except for the birds. At the same time, many other types became extinct—more than half of the species known from fossils near the end of the Cretaceous became extinct at the end of the Cretaceous. Because the survival of even a few individuals from a species can allow the species to persist, it is likely that almost all living things on the planet were killed. It was a catastrophic event, one of the most catastrophic in the history of the Earth.
The solution to this puzzle—how the dinosaurs and others were killed—was not found until fairly recently, but now we have a lot of important data. At the K/Pg boundary, sedimentary rocks around much of the world contain a thin clay layer. This layer is rich in iridium, an element rare on Earth but common in meteorites. This clay layer contains bits of rock that were melted and refrozen rapidly to form glass, such as are produced by meteorite impacts. Quartz grains in the layer contain shock features, which are caused by very high pressures applied very rapidly, but by no other known mechanisms such as volcanic eruptions. The layer is rich in soot (black carbon) from fires. The layer is thicker in and near the Americas than elsewhere. Around the Caribbean Sea, the layer includes a deposit of broken-up rock such as would be produced by a huge wave. And, on the Yucatan Peninsula is a large crater, the Chicxulub Structure, that is dated to the K/Pg boundary. The crater is partially buried by younger rocks but easily detected using geophysical techniques, drilling, etc. The crater is at least 110 miles (180 km) across, and perhaps as much as 180 miles (300 km) across.
This evidence indicates that a large meteorite, perhaps 6 miles (10 km) across, hit the Earth (the hole or crater made by an energetic projectile is usually a whole lot bigger than the projectile). Such a collision would have released more energy than all of the nuclear bombs that were on Earth when the U.S. and Soviet arsenals were at their largest.
The impact broke huge amounts of rock into small pieces, from the meteorite and from the Earth where the meteorite hit, and melted much more rock, blasting the solid pieces and melted drops of rock into the air and even above the atmosphere into space. As large pieces fell rapidly back to Earth, friction with the air generated heat in the same way that a re-entering space capsule or a “shooting star” is heated. For a little while, the air would have been like a toaster-broiler oven, lighting wildfires around much of the Earth that produced the soot in the fallout layer and that killed many things.
Following that, cold and dark descended. The impact site included sulfur-rich rocks. The heat of the impact vaporized some of those rocks, and that vapor cooled later to form sulfuric-acid clouds in the stratosphere. The small particles of these clouds didn't fall fast enough to heat up much, just as raindrops and dust particles do not heat up when they fall today. The many, many small particles, plus fine dust and soot from the fires blocked the sun and cooled the Earth. We know that such cooling occurs with modern volcanic eruptions—big ones such as Mt. Pinatubo in 1992 cool the Earth by a part of one degree for a year or two. A nuclear war might do much more, creating a nuclear winter or at least a nuclear fall. Even more of the sunlight would have been blocked after a huge meteorite impact, and the world may have frozen for a few years. And, with the sunlight blocked, photosynthesis would have stopped, which would have been very bad for plants that rely on photosynthesis and animals and fungi that rely on plants.
The sulfur particles, when they fell, would have made sulfuric acid, giving much stronger acid rain than the recent human-produced pollution. The sulfur in the stratospheric may have damaged the ozone layer, allowing dangerous UV radiation to penetrate as the dust and soot started to clear.
The impact site included a lot of carbonate rocks, and those broke down in the intense heat, releasing carbon dioxide. After the dust and sulfur cleared and the freezing ended, the world became anomalously hot for perhaps 100,000 years or so, from the enhanced greenhouse effect caused by all that carbon dioxide.
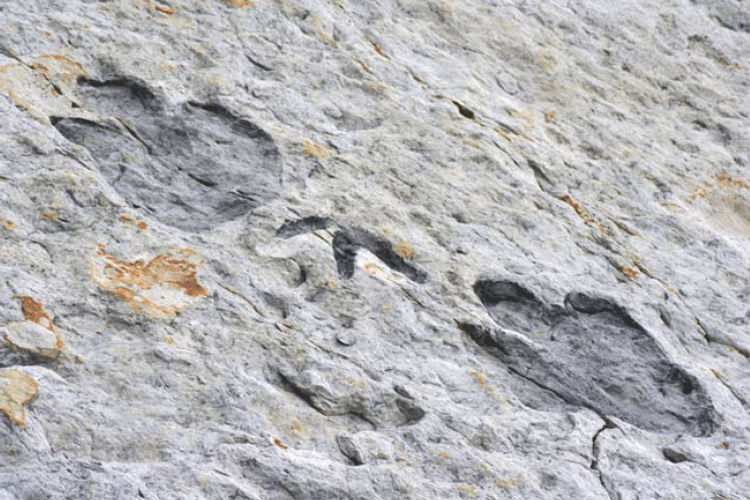
The meteorite impact was not nearly big enough to roll the Earth over, notably move the orbit, rearrange the continents, or anything similarly cataclysmic for the physical behavior of the planet beyond the few years or decades of the heat, cold and acid — the energy brought by the impactor was enough to move the Earth in its orbit roughly 1 cm, or a bit less than ½ inch, NOT dramatic. But the event was cataclysmic for life—almost all of the living things on Earth died. Who survived? Plants with long-lasting seeds, hibernators, things that live in ocean sediment or along spreading ridges, scavengers, and probably some others with appropriate characteristics. The general pattern is that the surviving animals were small, and mammals did better than dinosaurs. (Although, yes, birds are a branch of the dinosaurs, and the birds are still with us.)
After the fire and ice was over, the “jobs” (ecological niches) of many of the dinosaurs were left open. There were no big plant eaters or big meat eaters left, for example. Over tens of millions of years, the mammals, freed of the competition from the large dinosaurs, slowly evolved to take over the jobs of the dinosaurs. Some of the larger offspring of some species were successful, although most mammals remained small (mice, voles, etc.). Lining up the fossils over time, we see an evolutionary shrubbery—lots of branches, many extinctions where those branches were cut off, the persistence of small creatures, but the appearance of some large creatures, with those leading to modern lions and tigers and bears—and people. Biodiversity was hugely reduced by the meteorite, but over the next millions of years, new species appeared a little more often than existing species went extinct, so that diversity increased back to more-or-less what it was before the meteorite, just with different species doing the jobs.
If today, Coke and Pepsi and all other soft-drink companies suddenly magically disappeared, new soft-drink companies would be started fairly soon, not because of a magical tendency for soft-drink companies to appear, not because soft-drink companies must exist, but because we usually figure out how to take advantage of opportunities. In the same way, wiping out dinosaurs opened up a space for the evolution of mammals.
More on Meteorites and Mass Extinctions
More on Meteorites and Mass Extinctions
Meteorite impacts have been happening throughout Earth's history, and a Mars-sized body colliding with the Earth and blasting things into space is the best explanation for the formation of the moon. Big impacts were common early on in Earth's history. Penn State's Evan Pugh University Professor Jim Kasting (since retired), helped show that the heat from many of the huge impacts during the first few hundred million years of Earth's existence would have been enough to evaporate the whole ocean, and that as recently as about 3.8 billion years ago impactors may have been big enough to evaporate the sunlit upper layer of the ocean. Since then, collisions have been much smaller. The dinosaur-killer was larger than any others that fell to Earth during the most recent ~2 billion years (with some slight uncertainty because the record of an old event that hit entirely in the ocean might have been subducted), but the energy released by the dinosaur-killer was probably only enough to evaporate an inch or two of the ocean (a few centimeters). Even so, the dinosaur-killer wiped out a lot of species only because it hit special rocks that contained abundant sulfur and carbon. If other similar-sized meteorites had hit the Earth, almost all of them would have failed to cause a similarly large mass extinction, because almost all of them would have hit rocks that would have had less influence on the climate.
Please note that almost every major event in Earth’s history has been blamed on a meteorite by somebody at some time. Then, in almost all cases, additional scientific research showed that a meteorite was NOT responsible. The meteorite hypothesis then should have been moved to a footnote or dropped entirely. But… in online searches, the meteorite hypothesis lives on, waiting to trap unsuspecting individuals with outdated or inaccurate information. Often, one or a few scientists continue to push the idea, or nonscientific groups take over that job. Here, we have tried to give you the best information, representing an immense body of scientific work.
So, in the last couple of billion years, we have evidence of only one huge event in Earth’s history that was caused by a meteorite impact. But, smaller meteorites have caused small events, and many large rocks still are whizzing around out in space, so large impacts remain possible. An event like the one that formed the Meteor Crater, Arizona (see the picture below), which is 3/4 mile across, would be catastrophic for anyone living in or near the impact site, even though it would not have global consequences.
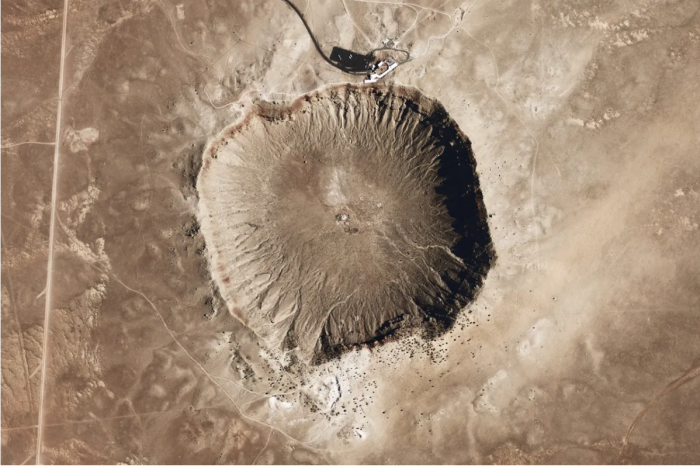
One scientific estimate found that your chances of being killed by a meteorite impact are about the same as being killed in the crash of a commercial airliner. Commercial airliner crashes kill a few hundred people per decade, and a meteorite might wait ten million years and then kill hundreds of millions of people, so the statistics are hard to compare, but the number is interesting. In comparison, recent statistics indicate that roughly 1.5% of deaths in the USA are from guns, and slightly over 1% from car crashes and other transportation-related fatalities. All other “accidental” deaths are much, much rarer but often get more press coverage, including tornadoes, hurricanes, earthquakes, food poisoning, bee stings, shark attacks, and many others. Part of this is because we have taken precautions against many of these others, such as accurate weather forecasts that allow millions of people to get out of the way of hurricanes. In the long term, smoking, over-eating, under-exercising, and other poor health habits are more important triggers of early death.
Scientists are coming up with ways to divert asteroids that might hit us, to help avoid such collisions. If we see an asteroid coming from far enough away, we need to turn its path only a tiny bit to miss the Earth. One idea is to hit the asteroid with a bag of dust that would spread across one side, changing the reflectivity of the surface; the difference between reflecting and absorbing the sunlight would cause a tiny push that would steer the asteroid. Another idea is to send a spacecraft to sit next to the asteroid for a year; the tiny gravity of the spacecraft, tugging on the asteroid, would turn it a tiny bit. In the year 2022, NASA proved that they could change the orbit of an asteroid by hitting one with a "kinetic impactor" Planning to avoid the fate of the dinosaurs may save us someday.
Really, despite the immense drama of the meteorite that killed the dinosaurs, and its critical role in the events that led to us, other issues are more important now. Let’s go visit a few of those, in the Arctic and Yellowstone, in Module 12, after you have a chance to explore the Enrichment.
Enrichment: Petrified Forest National Park
Petrified Forest National Park
Here are some enrichment items from the CAUSE class visiting the Petrified Forest, a truly wonderful place.
Virtual Field Trip: Hardwoods—CAUSE and Park Paleontologist William Parker Explore the Petrified Forest
The fossil record includes some amazing things. If there were trees and insects far back in time, wouldn't you expect that the insects would have burrowed into the trees then as they do now? And wouldn't you expect that a tree with some of those burrows would be fossilized? Well, here is one example. Park Paleontologist William Parker of the Petrified Forest National Park explains fossil burrows to the CAUSE team.
Video: Ancient Bee's Nests, Petrified Forest National Park (1:56)
[MUSIC PLAYING]
What you'll find in here, too, is you'll actually find insect traces, where they were underneath the bark, burrowing in just like modern ones do. This log, they call it the discovery log. This is actually a pretty important discovery.
What you're looking at here are insect traces and actual nest-- like little capsules here. You can see they're lined up. Little capsules of some nests of some kind of insect that actually lived in this log. You can see them here and here, coming out.
Now, these have been interpreted to be bees' nests. And if that's true, these would be the earliest record of bees by about 130 million years. Some entomologists disagree and say that this is very similar to some of the traces that modern beetles make, rather than bees.
But what they did is, some of these capsules in here, they went in and they found some preserved resins. And they actually tested them for geochemically, and they found the chemical that bees secrete. So some more work needs to be done on these to verify these results. But they were definitely made by some kind of insect. And it's a great example of how insects lived in these logs and used them as a food source and as a home.
[MUSIC PLAYING]
Petrified Forest National Park is best known for trees turned to stone, but also has an immense wealth of fossils of various types from the late Triassic (in the Mesozoic, about 210 million years ago). Here, Park Paleontologist William Parker and assistant Randall Irmis explain to the CAUSE class the paleontological excavation of plates of the armored amphibian known either as Koskinonodon or Buettneria.
Video: Uncovering Fossils - Petrified Forest National Park (2:58)
We're heading into one of the famous locality areas at for paleontology at the Park.
Volcanic ash? Is that what you just said?
Yeah.
There is volcanic ash here.
It is. It's volcanic ash.
There's a big hole. See, so a lot of times when we find the bones, this is what you'll find. There's an accumulation, and it's rolled down the hill. And this is what happens to the bones when they sit on the surface for a long period of time. They basically break apart into smaller and smaller fragments, and at a point in time, it becomes impossible to put them back together. So all the bones at the bottom of the hill have basically come from these bones here.
So what we do is we dig in, and we see if we can uncover them. These little tools, like dental picks, and things like that, and brushes, and we slowly expose the bone. It's kind of hard to see at first, but once we get it cleaned off, you'll be able to see it a lot better. Yeah, everything you're seeing here that's dark colored is bone, and the gray is the rock that's surrounding it.
So what we would do next is we would come here and we'd excavate around this. And we kind of leave this suspended on a pedestal. And then we cover the bone and the surrounding rock and the pedestal with plaster. Generally, we take strips of burlap and plaster, and we'd cover it with a little separator in between, usually toilet paper or tissue paper, to keep the plaster from sticking to the actual bones.
And then, after we have it all pedestaled, and a plaster cap on top, we'd undercut it, flip it over, put plaster on the other side, and then that's basically a handy carrying case to bringing it back to the lab. And then once we had it in the lab, we'd open it up and remove all the rock, glue together all these broken cracks and stuff. And pretty much you'd end up with the whole element, just like you see in the museum.
Want to see more?
Optional Enrichment (no, this won't be on the quiz!)
Agate Chunks in Sand - The formation of fossils is both rare and normal—most dead things are eaten, burned, or otherwise recycled before they are turned to stone, but over the diverse environments of the planet, conditions favoring fossilization are bound to occur in some places at some times. Here, Irene Meglis and Dr. Alley use a little geological sleuthing to understand why the fossil trees of Petrified Forest National Park were preserved. (Transcript)
Deep Time (repeated optional content)
Deep Time
What do beauty, saving money at Las Vegas, religion, oil exploration, emerging new diseases, and the planet’s recovery from global warming have in common? All in some way involve deep time, the immense age of the Earth. Eric Spielvogel filmed a discussion of these and other issues with Dr. Alley, for a special “time” issue of Research! Penn State. These "Deep Time film clips" will give you something to think about, and may even help with the course. Enjoy!
During three weeks in May 2004, two hardy Penn State geoscientists traveled through 12 stunning National Parks of the southwestern United States with 13 lucky students. The trip was sponsored by CAUSE (Collaborative Active Undergraduate Student Experience), an annual course offered by the College of Earth and Mineral Sciences. Richard Alley, Evan Pugh professor of geosciences, led the expedition. CAUSE 2004 was an extension of his course, "Geology of National Parks," and allowed students to interact with and learn from the rocks and landscapes of Arizona, Utah, and Colorado. In the following videos, Alley explains the concept of deep time, how it tells the history of our planet, and how it affects our lives.
Richard Alley, Ph.D., is Evan Pugh professor of geosciences in the College of Earth and Mineral Sciences, rba6@psu.edu.
—Emily Rowlands
What is Deep Time?
Deep Time and Beliefs
Deep Time and Climate Change
Deep Time and You, Part 1
Deep Time and You, Part 2
Optional Enrichment Article #1
Optional Enrichment Article #1
More Insight into Evolution
Many very good sources are available on evolution. The interested reader may wish to start with Teaching About Evolution and the Nature of Science (1998), National Academy of Sciences, National Academies Press, Washington, DC.
What follows, in question-and-answer format, is a synopsis of some of the objections that the author, Dr. Alley, has heard or read against evolution, together with brief answers. The author expresses some opinions toward the end on the teaching of science, but they are quite in line with the broader scientific view and with materials already discussed in class. The author really believes that science is a tremendously useful way for humans to find out how the world works to help us stay fed and clothed and housed and healthy so that we can address big questions. The author also includes quotes from two noted people (Pope John Paul II and US President James Earl Carter) that tend to promote religion as well as science, but this does not mean that this course is promoting or discouraging religion, just that these are part of the discussion.
Question: Is evolution anti-religious, or religion anti-evolution?
Answer: They don’t have to be. The author is religious and is convinced of the overwhelming scientific evidence for evolution. When the author wrote a commentary on the subject for Pennsylvania newspapers, the pastors at the author’s church (a mainline Protestant denomination) approved of the piece. Most of the religious people in the U.S. belong to groups that have accepted evolution. Pope John Paul II added the Catholic Church to those groups accepting evolution (“Truth cannot contradict truth;” Address of Pope John Paul II to the Pontifical Academy of Sciences, October 22, 1996).
Perhaps the most famous Sunday School teacher ever in U.S. history, former president James Earl (“Jimmy”) Carter, said in January 2004 that “he was embarrassed by the Georgia Department of Education proposal to eliminate the word ‘evolution’ from the state’s curriculum” (CNN story). He went on to say, “The existing and long-standing use of the word ‘evolution’ in our state’s textbooks has not adversely affected Georgians’ belief in the omnipotence of God as the creator of the universe. There can be no incompatibility between the Christian faith and proven facts concerning geology, biology, and astronomy. There is no need to teach that stars can fall out of the sky and land on a flat Earth in order to defend our religious faith.”
There surely are people who believe in evolution and who dislike or even attack religion, and there are many religious people who dislike or attack evolution. But, evolution is not anti-religious in any way. The author is of the opinion that most leaders of evolutionary research wish to coexist with religion, and that most religious leaders wish to coexist with evolution.
Question: Doesn't evolution lead to Hitler, ethnic cleansing, or the killing of innocent misfits?
Answer: Very often, “what is” becomes entangled with “what ought to be”—“Letters to the Editor” on the subject frequently include the worry that science displacing religion inevitably leads to a lack of divine authority for moral codes, which leads to a lack of morality. As noted above, this just doesn’t make sense—evolution-accepting Jimmy Carter and Pope John Paul II were highlighted as truly moral people. (But, the author suspects that questions of morality are more important than questions of science to many of the critics of evolution.)
In regard to racial purity or some similar such nonsense, consider for a moment the case of the author. He peers out from behind thick glasses, and his daughters both wear corrective contact lenses. He likely has a genetic predisposition causing near-sightedness in individuals who, while still young, use their eyes for much close-up work such as reading. This genetic predisposition seems to be hereditable—he has passed it on. (There is still medical debate about the genetic roots of bad eyesight, but the interpretation here is probably correct.) Leaving the author in the gene pool may “weaken” it a little bit. How should the author be dealt with in a world that recognizes evolution? Should he have been sterilized as a youth, or killed, or forbidden to mate? Or, should he be recognized as suffering from a handicap for which he should receive affirmative action? The government could have subsidized lessons for him during his youth on how to be attractive to a potential mate while peering through thick glasses. (Fortunately, he was successful in marrying a wonderful woman, but maybe other downtrodden thick-glasses wearers should have been helped by outreach efforts.) Or, should we just recognize that glasses (and now, contacts) work just fine, and why worry about it? The reality of evolution in no way dictates one’s morality! Evolution is what is, not what ought to be—we have to decide how to use the scientific information about evolution.
Question: Don’t the gaps in the fossil record prove that evolution did not occur?
Answer: No. We covered this one in the text at some length; the fossil record is beautifully consistent with evolution. The gaps present are the gaps expected based on the nature of speciation and the incompleteness of the fossil record, and the gaps are filled by transitional forms in those groups that are commonly fossilized and for which you would expect to find transitional fossils. Even a little consideration shows that not every creature is fossilized, and that big and relatively rare land creatures will have somewhat sketchy fossil records whereas small and relatively common shelly shallow-sea creatures will have rather complete fossil records. This is observed. One can look at the likelihood of fossilization, and then generate predictions on how complete the fossil record will become as more fossils are collected, and these work.
Question: Aren’t there lots of problems with age dating, showing that the world is really young?
Answer: Again, this was discussed a lot back in Module 10. There are commentators who make such anti-science arguments that might seem sensible to those who don’t know the field, but those arguments can be shown to be completely wrong with just a little care.
Consider one that the author has shown several times. The author has helped count over 100,000 annual layers in a Greenland ice core and participated in numerous careful tests using the fallout of historically dated volcanoes and other time markers to show that the results are reliable. The “counter-argument” from the young-Earth supporters was that a flight of World War II planes that were forced to land on the ice sheet had been buried a couple of hundred feet in only 50 years, so a couple of thousand feet would be 500 years, and the 10,000 feet of ice thickness in central Greenland would be about 2,500 years, so the ice sheet started safely after Noah’s flood. Seems perfectly reasonable, doesn’t it?
But, when we discussed glacier flow back in Module 7 we noted that a glacier is a bit like pancake batter, spreading across a griddle under the influence of gravity. If you put a dollop of pancake batter in the middle of a griddle and watch, the layer thins as it spreads. Put another dollop on top, and both spread and get thinner. Keep putting dollops on top, and letting the batter drip off the end of the griddle, and eventually, you’ll have a whole pile of layers. The one at the bottom will have been spreading and thinning the longest and will be the thinnest.
An ice sheet is similar, spreading and thinning as more snow is piled on top. Very crudely, an annual layer will become half as thick and twice as long while it is moving halfway from wherever it is toward the bed. Friends of the author have directly measured the motion and spreading of the ice, and it fits this pattern beautifully. (These measurements show a little extra downward motion associated with squeezing snow to ice, but glaciologists usually speak in terms of ice-equivalent thickness—the air already mathematically squeezed out. And very deep, the halfway-to-the-bed-thins-by-half breaks down, because the ice sheet had to form sometime so the first layers weren’t thinned while flowing through the ice sheet, and because the flow over bumps in waffle-iron fashion also complicates things a little). The fact that Greenland makes icebergs and hence is spreading means that deeper layers are thinner, and the simple airplane burial calculation is completely wrong.
At the time the author was writing this, a quick search of the Web found numerous sites that slightly improved the young Greenland calculation while still getting it completely wrong. These sites noted the thinning of layers with increasing depth, picked a place near the edge of the ice sheet where the ice was relatively thin, picked a thickness of annual layers at the surface, picked an erroneously thick annual value at the bottom, and suggested using the numerical average of the surface and bottom thickness in the calculation to get the age of the ice sheet. Fourteen inches thick at the top, less than two inches thick at the bottom, call it two inches, take the average of 14 and 2 inches and get 8 inches per year, and a few thousand feet of ice in the thin margin of the ice sheet will still squeak in after Noah’s flood—the scientists must be confused. Seems reasonable, right?
Absolutely not. Try this very simple equivalent, that you can do in your head. Suppose that the ice sheet is two feet thick, or 24 inches, that the top annual layer is 12 inches thick, and the bottom has twelve annual layers each 1 inch thick. A scientist would count the annual layers and find 13, giving a 13-year age for the ice sheet. But the technique advocated by the young-Earth websites would average the top and bottom thicknesses (6.5 inches per year), and then calculate that fewer than 4 years were required to build up the two feet of ice, not the actual 13 years. The mathematical error made on the websites is a very simple one and one that most students will have learned to avoid while still in middle school. (The author doesn’t know whether the mistake on these young-Earth websites represents stupidity or deliberate misrepresentation, but the mistake is so flagrant that it is not easy to think of a third option.) Do the calculation right for Greenland, and you end up with a very old ice sheet. If you count the annual layers or calculate the age using the flow of the ice sheet, estimate the age by identifying abrupt climate changes and using the ages from counting tree rings or other annual layers, or use any of the other dating techniques, you’ll get the same answer: Greenland’s ice is much older than written history.
The scientific community is continually improving age-dating techniques, arguing about them, and working on them, and thus far, no serious problems have been found with the old age of the Earth. The arguments presented against the old age, such as the buried planes or the 5,000-year-old living clam (see the Enrichment from the Grand Canyon in Module 10) prove not to be problems after all.
Question: Doesn’t the second law of thermodynamics prove that evolution cannot have occurred?
Answer: No; evolution is fully consistent with the second law of thermodynamics. The second law says that entropy (disorder) increases in a closed system. Evolution sometimes makes more complex things from less complex ones, which might seem to violate the second law. But, evolution is done with the addition of energy from the sun; the Earth is not a closed system. The living and evolving creatures take complex food and burn it with oxygen to gain energy, increasing disorder. Some creationist websites have even suggested that followers avoid using this second-law argument because it is so completely and obviously wrong.
An interesting note is that a whole field of Evolutionary Computing now exists (linked to genetic algorithms, artificial intelligence, etc.). In trying to “teach” computers to solve complex and difficult problems, computer scientists have found it useful to mimic evolution and natural selection—have the computer start with a possible answer, see if it works, then tweak the answer and see if that works better, throwing away ones that work worse and keeping ones that work better. If, for example, you’re trying to improve the routing of airplanes to fly the shortest distance while carrying the most passengers, you could start with the current route map, and then randomly “perturb” it a little, to see if that works better. You need to define “better” (how many more miles of flying is it worth to allow you to sell another passenger ticket?), but then the technique is successful. Usually, many small perturbations are used in sequence, and occasionally a slightly larger one may be useful; but huge ones usually fail. The approach obtains order—a useful optimization of the flight plan—from the chaos of reality by random adjustments followed by selection of those that work better. Selection doesn’t require intelligence, but simply telling the computer to save the coordinates if the cost is lower. In biology, this selection is achieved by survival—if you survive to have kids, you have been selected. The lessons of biological evolution thus have been used to help computer scientists solve hard problems—science works. And the idea that somehow the second law of thermodynamics prevents evolution is just silliness.
Note that, in the absence of the “selection” step, randomly generating new options is almost guaranteed to fail in finding an optimal answer. Many of the anti-evolution websites and other anti-evolution materials point to how incredibly unlikely it is for random processes to generate something useful. These sites are completely correct, but completely misrepresent evolutionary theory. In evolution and evolutionary computing, the step of randomly generating lots and lots of new “experiments” is followed by the step of picking “successful” ones—in evolutionary computing, the successful ones meet some criterion such as saving the airline money; in evolution by natural selection, the successful ones promote survival to have kids.
Question: Isn’t evolution restricted to the “micro-evolution” that we can see (such as breeding tiny white dogs from larger, grayer dogs), and cannot include “macro-evolution” of new types?
Answer: This one takes a bit of discussion; it seems common-sensical, but turns out to be really wrong.
To many biologists, evolution is defined as something like a “change in gene frequencies over time,” with genes being the basic inherited instructions for making and running living things. There is no “micro” or “macro” in this; the distinction is simply not meaningful in the modern theory of evolution. “Macro” is just more of “micro”; they are not separate things.
A different way to view this question is that, biologically, there is a division between species (either things interbreed and are thus part of the same species, or they don’t interbreeed and are a different species, or they do interbreed somewhat and pose problems for what word we use to describe them, as discussed next). All of the other divisions that we draw between different living types (kingdom, phylum, class, order, family, genus) are human constructs to help us understand the world. If different people with well-developed science had named all of the creatures, those people likely would have picked the same species but may have picked different ways to group the species. “Macro” in this sense presumably is used by the evolution-skeptics to refer to changes between the larger groupings (there are wolves and coyotes and domestic dogs, but these people claim that there is a fundamental difference between “dogness” and “catness”). But larger groupings are primarily conveniences for us; evolutionary biology addresses whether creatures interbreed and exchange genes, or not.
“No, no, no” a skeptic might say, “We don’t care about what biologists think; we care about the reality, and we know that there is ‘dogness’ and ‘catness,’ these are different types or sorts.” This is harder to answer; such people presumably are postulating some unknown barrier that somehow prevents genetic “experiments” beyond pre-defined boundaries—evolution can bring about new types of dogs, or new types of cats, but only to some boundary and not beyond. But what forms such a boundary? Where is the ‘police officer’—biochemical or otherwise—that would check after two dogs had sex to make sure that the potential offspring did not include a genetic experiment that went one DNA base pair outside of the defined limits of ‘dogness’? An omnipotent deity could of course do such a thing, but there exists no scientific evidence for this—make another base substitution in DNA, and you have another experiment. Let nature choose the “good” experiments (those that lead to lots of surviving kids) and evolution happens. “Macro” evolution really means “evolution that takes long enough to occur that humans in their lifetimes won’t see much change in large animals (although plenty of such changes are happening to disease organisms).”
Dogs and cats really are different, because many successful evolutionary experiments have accumulated over tens of millions of years. Evolution really is gradual, and “hopeful monsters” (a dog gives birth to a cat, for example) do not happen. But, given the observed rates at which variability is produced by reproduction, and the rates at which natural selection is observed to function, mathematical modeling shows that there has been more than enough time in geological history for all of evolution to have occurred. There is no problem, for example, in going from the known damage that happens to cells in the bright sun (sunburn), to cells that are a bit more sensitive to light to help a creature know where the light is and avoid it, to groupings of those cells, and on to an eye. The question is not whether evolution could have happened in that much time, but why evolution ran as slowly as it did—most of the time, not a lot of change has been occurring, probably because creatures had found pretty good evolutionary solutions to problems and tended to stick with those solutions.
An additional note is that the species with us today are really not as separate and distinct as some people might have you believe, but have blurry edges, overlaps, etc., as you would expect from the scientific understanding of evolution. For example, “ring complexes” of animals are observed—species A interbreeds with B, which interbreeds with C, but A and C don’t interbreed. Are A and C the same species? Would they be if B became extinct? (Imagine what would happen if we had nothing but miniature poodles and Great Danes—could they ever “get it on”?) The messy world of biology shows that the world is not populated by “types” but by evolving populations with greater or lesser degrees of gene exchange.
Question: What about “Intelligent Design”?
Answer: “Intelligent design” is a resurrection of a very old idea. Proponents of “intelligent design” argue that there exist “irreducibly complex” parts of plants and animals, such that these parts would not have been useful while they were evolving but only after they evolved, and thus they could not have evolved. If evolution made a useless something that later became part of an eye, that something wouldn’t help the creature and might hurt it, and so wouldn’t be saved and experimented upon to generate the rest of the eye—the intermediate steps usually should be useful for evolution to work.
In decades gone by, the eye was often cited as an irreducibly complex structure—without all of the parts of your eye, you wouldn’t be reading this. But it is very easy to find successful creatures on Earth with no eyes, others with rudimentary eye spots, and others with slightly more complex eyes, and so on—gradual improvements in the slight sensitivity of all cells to light can lead to an eye. Because each step in the evolution of an eye has utility, the eye is not “irreducibly complex”. (Ask someone whether they would prefer to be completely blind or to be able to discern light and darkness, or vague shapes, and that person is not likely to opt for blindness—less-than-perfect eyes are still valuable.) As their eye argument failed, intelligent-design advocates have switched to other arguments, such as the flagellum or the clotting of blood, but scientists working on these topics are not finding these structures to be irreducibly complex, either.
Scientists working in many fields related to evolution have been vocal through their leading organizations, such as the National Academy of Sciences, and the American Association for the Advancement of Science, in noting that “intelligent design” is not science, even if it happens to be stated by people with scientific training. Scientists after all can say all sorts of things that are not science. (And yes, you can find a few scientists saying anti-religion things, but those are not science either.) The leading hypothesis of “intelligent design” seems to be that there are some things that evolutionists cannot explain. This hypothesis does not lead to useful predictions that can be tested and falsified, so it just isn’t science. Notice, by the way, that a successful scientific explanation of one so-called irreducibly complex item such as the eye has not falsified “intelligent design” to its supporters, who can always propose that something else is irreducibly complex. In a widely watched court case in Dover, Pennsylvania in 2005, a federal court stated these results very clearly: “intelligent design” is not science. (See the Kitzmiller case (.pdf) at uscourts.gov if you’d like 139 very interesting pages on this topic.)
After the author wrote a newspaper column advocating the teaching of science in science classes (included here in Enrichment 2), he received communications (e-mail, phone, letter) from numerous interested people, including many intelligent-design supporters. Aside from a couple of unpleasant “You’re going to burn in Hell” e-mails from the fringe, the exchanges were respectful, interesting, and informative, from a broad spectrum of beliefs. Notice that these are not the leaders of the “intelligent design movement”, but mostly-Pennsylvanian newspaper readers responding to a column. Two observations are:
1) None of the “intelligent design” supporters seemed to seriously consider the possibility that the “intelligent designer” was a flying spaghetti monster or a space alien; where it could be determined, the correspondent identified the “intelligent designer” as God as worshipped in the Judeo-Christian tradition, and the correspondent came from a fundamentalist, conservative, or traditional Christian background.
2) None of the “intelligent design” supporters seem to have come to their religious beliefs based on the perceived difficulty of evolutionary biochemists in explaining blood clotting, flagella, or eyes. Awe and reverence for the glory of nature did seem to figure in some religious beliefs, but supposedly irreducibly complex items were not at the forefront.
This leads to some additional, important points. The broad umbrella of “intelligent design” allows an old Earth and allows evolution to have occurred, except at those moments when an unspecified intelligence tinkered with the process, so if you are a true sacred-book literalist, “intelligent design” may give you scant comfort. And many religious people object to “intelligent design” based on the argument that it is lousy theology—if an unspecified “intelligent designer” is introduced to high-school biology students based on a claimed difficulty that scientists are having in explaining intermediate steps in blood clotting, might future success in explaining blood clotting raise questions in the minds of those students about the validity of belief in the “intelligent designer”? The pastors at the author’s church seemed remarkably uninterested in getting high school biology teachers to take over religious instruction based on explanations of flagella.
Question: But shouldn’t we be fair, teach both sides, and let kids decide?
Answer: This is a hard one because we so strongly believe in fairness and in hearing a diversity of ideas. But, if you present “both sides” in science class, it isn’t science class anymore. Science is the human search for ways to make accurate predictions, and that means setting aside the ideas that don’t work (the Earth is flat, the Earth is the center of the universe) and keeping the ones that do. Teaching the controversy over evolution in science class would be akin to teaching the controversy over whether the Earth or the Sun is more nearly the center of the solar system.
Consider the scientific controversy over gravity. We don’t have a complete understanding of gravity yet. The grand unified theories of physics have not succeeded in explaining the quantum world and gravity through one set of equations, and other research frontiers await. But we have a pretty good idea that if you knock your pencil off your desk, the pencil will fall down. In the same way, there are lots of evolutionary questions, things we don’t know, and fascinating research frontiers, but the basic idea that kids are mostly like parents, differences affect success, and this leads to evolution, is very well established with very little uncertainty.
Discussions about “intelligent design” surely can be included in school—a school that does not recognize the reality of religion in the world is not preparing its students for that world. But “intelligent design” is not science, and the author believes that science classes should teach science.
Petrification - How is the Bone Turned to Stone?
No magic is involved in the petrification of bone, wood, or other materials. The chemical environment inside organic materials is very different from the chemical environment outside. All groundwaters carry minerals, and when those mineral-carrying groundwaters encounter a change in chemical conditions, some chemicals usually are picked up while others are put down. Remember that water can poison people by picking up lead and other chemicals from old pipes, and that water can clog old pipes by putting down scum and hard-water deposits—picking up some chemicals and putting down others is the usual behavior for water. Water softeners work by pulling calcium out of the water and putting sodium back in.
When organic material is buried in mud, if enough adding and subtracting of chemicals occurs before the material is eaten by worms or fungi or bacteria, then the organic material can be “turned to stone”. This petrification is rare—most organics are recycled—but occurs often enough to give us plenty of fossils to study.
For example, silica is very common and is relatively insoluble in acidic solutions but very soluble in basic solutions. Groundwater in dry environments often is basic and so carries much silica. When this silica-carrying groundwater meets the organic acids in a buried tree or bone or other formerly living things, the silica may precipitate. Actual chemical processes are typically a little more complicated than explained here, but the principle is the same. Materials scientists are even succeeding now in using wood as a template for “growing” ceramics, replacing the wood with zeolites, silicon carbide, or other materials to make useful things by human-accelerated petrification.
Extinction and Absorbing Boundaries
If you go to a casino to gamble, you are likely to lose. This is partly because the games are stacked against you—the odds on all casino games favor the house. (The odds on state lotteries typically are even more in favor of the house, by the way.)
But, you also lose at a casino because you are poor and the casino is rich. Suppose that you start off with $10 and the casino starts off with $999,990. Together, you have $1,000,000. Suppose further that this is a bizarre casino with a perfectly fair game—you and the casino are equally likely to win. If you win $10, then you have $20 and the casino has $999,980. But, there is a slight catch—if you lose $10, you are at $0 and the casino will show you the door. If you stay and gamble for a while, the outcome is almost guaranteed; you will hit $0 before the casino does, the casino will have all of your money, and you will go home broke. The $0 mark is an absorbing boundary—you can’t bounce off of it (the casino won’t give you your money back), nor can you go negative and then return (well, you might go take out a loan, but your ability to get loans to cover gambling losses is much smaller than the casino’s ability to get loans, so you’ll eventually reach the point of no return—your money will have been absorbed by the casino).
Extinction works the same way. Once a species is gone, it is gone. You can’t have a negative number of tigers and then later have a positive number. So random fluctuations eventually kill off species. But, at certain times, such as when the meteorite hit at the end of the Mesozoic, or now as we humans spread across the surface of the planet and squeeze others out (more on this coming soon!), extinctions go a whole lot faster than normal.
Just for your interest, here are a couple of thoughts on Extinction, from Aldo Leopold’s A Sand County Almanac. Some of the Almanac is written in ways that seem outdated now, including its non-neutral use of gender. But, it was ahead of its time in 1948, when Leopold made these remarks at the dedication of a monument to the last passenger pigeon, after humans drove that highly abundant species to extinction. We will return to biodiversity in the next Module, so this may give you useful things to think about heading into Module 12.
It is a century now since Darwin gave us the first glimpse of the origin of the species. We know now what was unknown to all the preceding caravan of generations: that men are only fellow voyagers with other creatures in the odyssey of evolution. This new knowledge should have given us, by this time, a sense of kinship with fellow creatures; a wish to live and let live; a sense of wonder over the magnitude and duration of the biotic enterprise.
-Leopold, Aldo [7]: A Sand County Almanac, and Sketches Here and There, 1948, Oxford University Press, New York, 1987
For one species to mourn the death of another is a new thing under the sun. The Cro- Magnon who slew the last mammoth thought only of steaks. The sportsman who shot the last pigeon thought only of his prowess. The sailor who clubbed the last auk thought of nothing at all. But we, who have lost our pigeons, mourn the loss. Had the funeral been ours, the pigeons would hardly have mourned us. In this fact, rather than in Mr. DuPont's nylons or Mr. Vannevar Bush's bombs, lies objective evidence of our superiority over the beasts.
-Leopold, Aldo [7]: A Sand County Almanac, and Sketches Here and There, 1948, Oxford University Press, New York, 1987
Optional Enrichment Article #2
Optional Enrichment Article #2
“Intelligent Design” Newspaper Editorial by Dr. Alley
Column by R.B. Alley, published in Harrisburg Patriot-News (2004) and republished in
Pittsburgh Post-Gazette and Centre Daily Times early in 2005.
The School Board of the Dover (PA) Area School District (November 2004) mandated the teaching of so-called “intelligent design” alongside Darwinian evolution in science classes, and similar actions are at least being considered elsewhere. As a religious person and a scientist, I hope that school boards will avoid mixing apples and angels in the classroom.
Like many scientists, I am fortunate to teach. We know that our students will soon discover things we missed, often correcting our mistakes in the process. Thus, a scientist would be foolish to claim that science gives absolute knowledge of Truth. If I successfully predict the outcome of an experiment, I’m never sure whether my understanding of the world is True, whether I’m pretty close but not quite right, or whether I’m really confused and was just lucky this time.
But, our society has agreed to act as if science is at least close to being true about some things, and this makes us very successful in doing those things. Carefully crafted bits of silicon really are computers, airplanes designed on those computers using principles of physics really do fly, and medicines from biological laboratories really do cure diseases. The military has investigated psychics as well as physicists but continues to rely on the physicists because they are so much more successful. Science, tightly wedded to engineering and technology, really does work, and is the best way we humans have invented to learn to do many things.
Science asks a high price for the value it gives, however, and that price is a real dedication to science. The cartoonist Sidney Harris once drew a panel showing two long strings of blackboard equations connected by “Then a miracle occurs,” with one scientific-looking character saying to the other “I think you should be more explicit here in step two.” For a plane to fly, for a medicine to cure disease, every step must be tested, and everyone else must be able to follow those steps. Science students are welcome to rely on divine inspiration, but they cannot rely on divine intervention in their experiments. Scientists, like athletes, must follow the rules of the game while they’re playing.
What, then, are the rules? First, scientists search for new ideas, by talking to people, or exploring traditional knowledge, or in the library or other places. We look for an idea that explains what we see around us, but that also disagrees with an old idea by predicting different outcomes of experiments or observations. Then we test the new idea against the old one by doing experiments or making observations. An idea that repeatedly makes better predictions is kept; an idea that repeatedly does more poorly is set aside. An idea that can’t be tested also is set aside; it isn’t scientific. Even if I really love an idea, or really believe it is True, but I can’t think how to give it a fair test, I have to set it aside for now. Some people find this limiting and avoid science; others find it exhilarating and are drawn to science. Doing this well gives us good things from good science.
Who decides what is or isn’t science? Scientists—with other thinkers watching over our shoulders—do the day-to-day deciding, but ultimately the whole bill-paying, newspaper-reading community is checking on us to make sure we are producing useful insights.
Does science have limits? Will we run out of new ideas? Will we hit problems that we can’t solve? Perhaps. But when I come out of a classroom of bright young students, I am convinced that we’re nowhere near any limits that might exist and that there is still much to discover.
So, what about Intelligent Design, or even Young-Earth Creationism, and teaching them in science class? They’re interesting ideas. But, some parts we don’t know how to test. Even if they are said by scientists, they aren’t science. And the testable parts have been tested and found wanting—they don’t do as well as the “scientific” view in explaining what we see around us, or in predicting what we find as we collect new tree-ring records and ice-core samples, or as we search for oil and valuable minerals, or as we watch dangerous new diseases appear faster than our bodies can respond to them. We spend a few hours discussing the main pieces of evidence in class, and a lifetime isn’t enough to cover all the details, but scientists have been working on these questions for centuries and have a pretty good idea of what works now. Evolution “in the dark backward and abysm of time” is a scientific theory, not Truth, but it is very good science.
How does this fit into the bigger picture? Although some people are happy to view science as merely a tool, others do believe that the remarkable success of science means that we are getting closer to the truth. But even these people disagree about that truth: a mechanistic universe, a benevolent and omnipotent deity, or something else? Fascinating as they are, such questions are for now outside of science. Many scientists and religious people are thinking about such questions, but no experimenter knows how to guarantee the cooperation of an omnipotent deity.
By all means, students should ask deep questions, think and discuss, and probe. Science does not tell us what we ought to do, and students will have to join us in addressing what ought to be as well as what is. But if we want to face the big questions with better medicines, with computers that function and planes that fly, with clean water and buildings that don’t fall down, I believe that we should teach science in science class.
A Rocking Review
A Rocking Review
Here’s a “musical” summary of evolution, illustrated with Alley cats, and set to an old tune.
Video: Evolution Marches On (03:31)
Here's a light-hearted look at a serious subject, set to an old tune, with help from the alleycats Coral (orange) and Prancer (gray). [Music] In the wild the rules are simple, do it better or else die, for the ones who don't do better, will be dinner by and by. Yes and those that aren't eaten, have the right stuff it is clear. And they get to hang around and have some sex and kids next year. What makes the folks become the kids, but none of them are just the same, as the difference drives survival, evolution is the name. Do not speak of hopeful monsters, the new need back-compatibility. It may take 10,000 generations for a change that you can see. For the germs that cause diseases, this may come in just a year, but o'er centuries for big critters, all you get is what is here. But as the centuries become eons, even big things change their signs, as is shown by their genetics and transitional fossil lines. What makes the folks become the kids, but none of them are just the same, as the difference drives survival, evolution is the name. None of this tells any human what is right or what to do. With our minds we can choose better, it is up to me and you. We can learn and share that knowledge, so much faster than we pass our genes. We can search for truth and beauty and to find out what life means. In the wild I might be eaten, for my eyes focus too near. You could kill me for racial purity or just sell me glasses here. But biologically, what makes the folks becomes the kids, and none of them are just the same, as the difference drives survival, evolution in the name.
Module 11 Wrap-Up
Module 11 Wrap-Up
Review Module Requirements
You have reached the end of Module 11! Double-check the list of requirements on the Welcome to Module 11 page and the Course Calendar to be sure you have completed all the activities required for this module.
Supplemental Materials
Following are some supplementary materials for Module 11. While you are not required to review these, you may find them interesting and helpful in preparing for the quiz!
- Website: Florissant Fossil Beds National Monument
- Website: Dinosaur National Monument
Comments or Questions?
If you have any questions, send an email via Canvas, to ALL the Teachers and TAs. To do this, add each teacher individually in the “To” line of your email. By adding all the teachers, the TAs will be included. Failure to email ALL the teachers may result in a delayed or missed response. For detailed directions on how to do this, see How to send an email in GEOSC 10 in the Important Information module.
Module 12: Biodiversity, Global Warming and the Future
Welcome to Module 12
Welcome to Module 12: Biodiversity, Global Warming, and the Future
Intro video (xx:xx minutes)
Insert transcript here
It's a cold night. You wake up, curled in a little ball, shivering, and you remember that there is a nice, warm blanket in the hall closet. What do you do?
- Stay in bed, because if you get up, your pajama pants, loose from your recent weight loss inspired by your lead role in the new blockbuster movie based on your bestselling novel, will fall off, and losing your pajama pants will make you colder than before.
- Stay in bed, because if you get up, your significant other, the handsome/beautiful actor/actress (choose one of each) who will play the lead next to you in the new movie, will steal the covers already on the bed, you won't notice, and you'll end up colder than before.
- Stay in bed, because if you get up, you'll spill the glass of imported water with the lemon slice that you keep next to the bed for your significant other, soaking the sheets and making you colder than before.
- Get up and get the blanket.
If you picked D, you probably should be thinking about wise responses to global warming, because the physical basis for expecting that the ongoing human addition of carbon dioxide to the atmosphere will raise the Earth's average temperature is at least as strong as the physical basis for expecting warming from putting another blanket on the bed. It’s now extraordinarily unlikely that nature will do something bizarre enough to offset what we're doing—a huge number of volcanoes erupting and throwing things into the stratosphere to block the sun, or space aliens coming and getting in the sun's way—because we're putting a “blanket” on the planet, it is warming the planet, and we are almost guaranteed to get even warmer.
However, that doesn't tell us what, if anything, to do, so let's go take a look at the options. There's some money to be made here and disasters to be avoided and good to be done.
Please note, the topics covered in Module 12 are appropriate for our course and do matter for your future. Old people like Dr. Alley were raised in a world in which these topics were not especially political; scientists did science, engineers did engineering, and voters, politicians, and businesspeople did their jobs without picking sides on the science and engineering. Many things happened over the last few decades, though, and the topics in Module 12 are considered to be political by many people today, even though most of the information is science, not politics.
We’ll try to give you a short enough version of the information to avoid overloading you or driving you crazy, but long enough to give you a good start if you want to know more. We will try to be scrupulous in avoiding taking sides on political issues… but recognize that in the modern politicized environment, it is impossible to even mention some of these issues without being accused of politicization by some people.
For what it’s worth, the progress in developing new energy sources has been so spectacularly fast that Dr. Alley remains optimistic, and he has put that optimism into a book, a three-hour TV miniseries, and various other outlets including about 1000 public talks. The full scholarship really does indicate that we can build a sustainable energy system that will supply more energy to more people at lower cost and with less environmental damage than from our current energy system, providing a larger economy, more jobs, improved health and greater national security in a cleaner and more ethical world. If we remain committed over the next 30 years or so.
Learning Objectives
- Understand how different fossil fuels form, how slowly that occurs, and why, despite the huge value we get from use of fossil fuels, we must move to other energy sources
- Explain how fossil-fuel burning contributes to climate change that is making our lives harder, and thus how moving toward a sustainable energy system will help us to have a bigger economy, improved health, and other benefits
- Discuss reasons why maintaining or reestablishing natural ecosystems connecting national parks will help preserve the valuable biodiversity in those national parks.
What to do for Module 12?
You will have one week to complete Module 12. See the course calendar for specific due dates.
- Take RockOn #12
- Submit Exercise #6
- No StudentSpeak this week
Questions?
If you have any questions, send an email via Canvas, to ALL the Teachers and TAs. To do this, add each teacher individually in the “To” line of your email. By adding all the teachers, the TAs will be included. Failure to email ALL the teachers may result in a delayed or missed response. For detailed directions on how to do this, see How to send an email in GEOSC 10 in the Important Information module.
This course is offered as part of the Repository of Open and Affordable Materials at Penn State. You are welcome to use and reuse materials that appear on this site (other than those copyrighted by others) subject to the licensing agreement linked to the bottom of this and every page. Students registered for this Penn State course gain access to assignments and instructor feedback and earn academic credit. Information about registering for this course is available from the Office of the University Registrar.
Main Topics: Module 12
Overview of the main topics you will encounter in Module 12.
The difficulty lies, not in the new ideas, but in escaping from the old ones, which ramify, for those brought up as most of us have been, into every corner of our minds.
—John Maynard Keynes, economist, Preface to The General Theory of Employment, Interest and Money (1935)
Prediction is very difficult—especially about the future.
— Attributed to physicist Niels Bohr
Fuelish
- Plants use carbon dioxide, water, and the sun’s energy to grow more plant material while releasing oxygen.
- Other life forms “burn” the plants with oxygen to get that energy.
- If buried without oxygen, the plants aren't burned, and as nature heats them, they make fossil fuels:
- With heating, woody plants become peat (which occurs in sediment; some of which is forming at Bear Meadows and in other wetlands) and then become lignite coal (which occurs in sedimentary rock) and then become bituminous coal (found in harder sedimentary rock, including in western PA) and then anthracite coal (found in metamorphic rock, in eastern PA) (some natural gas is also formed with coal);
- Algae may be broken down by bacteria to make natural gas (some is produced in Bear Meadows), and with heating algae produce oil (often with natural gas, common in western PA), and then more heating breaks down the oil to produce more natural gas (eastern PA) (natural gas and oil float up and escape to be burned by bacteria, etc., unless trapped by geology).
Take It to the Limit
- Fossil fuels are NOT infinite:
- Nature really is efficient at recycling, and most formerly living things were recycled rather than forming fossil fuels;
- Oil & coal companies are really skillful, and already found easy-to-find fuels;
- We have not set aside very much fossil fuel in parks or reserves (the oil likely to be produced if Arctic National Wildlife Refuge is opened to full drilling is estimated to equal less than 6 months of US use).
- World oil production is likely to peak soon (within decades?):
- At vaguely recognizable prices and current demand, probably close to ½ century of oil and gas remain, and a few centuries of coal.
Impactful
- Fossil fuels do many important things for us.
- In the US, external energy use is 100 times what we can do for ourselves from energy in the food we eat; the world averages 25 times.
- External energy use is very important for our well-being.
- In the US and the world, most external energy is from fossil fuels.
- But, many negative impacts of fossil fuels, including health problems from air pollution from burning, accidental fires and explosions, leaks that hurt water supplies and wildlife, and climate change.
You’re in the Greenhouse Now
- Some gases in the air let visible light through (sun) but partly block infrared (energy returned from Earth to space).
- These gases make the planet warmer than it otherwise would be, so Earth “glows” brighter, forcing energy past the gases to space.
- We are increasing these gases (esp. carbon dioxide) a lot, and they will stay up for centuries, with some staying up 100,000 years and longer.
With High Confidence
- The greenhouse gases we release are warming the world and will continue to warm it, amplified by feedbacks such as the melting of reflective ice increasing warming.
- This is having and will have mostly negative impacts on us, making our lives harder:
- Sea-level rise from ice melting and ocean water expanding;
- More floods and droughts;
- Dangerous, potentially fatal heat;
- Strongest storms getting stronger;
- Ecological displacements causing extinctions and spreading diseases;
- Ethical issues—changes more dangerous for people less responsible for causing the changes;
- Many more.
- Not much scientific disagreement on these points;
- But much political, social, and economic disagreement (similar political arguments about scientifically clear results have happened with previous environmental issues).
Making Money
- We have to switch from fossil fuels as they become scarcer; will we do so before or after we change the climate in ways that make life much harder?
- Sustainable alternatives are now often cheaper than the cost we pay directly for fossil fuels.
- And, economic analyses including the health and climate impacts show that fossil fuels are greatly subsidized, so the full price of fossil fuels to society is much higher than the direct cost (roughly double).
- Building a sustainable energy system is a huge task requiring decades, but can be done.
- And can improve the economy, employment, national security, health, environment, and ethics.
Lions and Tigers and Bears?
- Biodiversity is valuable to us as a source of medicines and other useful things we can discover, and because more diverse ecosystems produce more that we might use, and living types can serve as “canaries in the coal mine” to warn us of trouble, and diverse ecosystems motivate tourism that is economically important and fun; also, there are ethical issues of whether we have the right to kill off other species.
- Early and modern humans have been hard on biodiversity and contributed to extinctions, and we may be heading for the next mass extinction on the scale of the great mass extinctions of geologic history.
- Just as smaller islands have fewer species because it is easier to eliminate a smaller population, isolating patches of wilderness in separate national parks will turn them into biological islands and cause the loss of species in those parks.
- Climate change will make this worse, forcing migration when there may not be migration pathways.
- There are ways to avoid these problems, especially by maintaining natural connections between parks
The Arctic National Wildlife Refuge
The Arctic National Wildlife Refuge
The Arctic National Wildlife Refuge (ANWR) sprawls across the North Slope of Alaska, from the Brooks Range to the coast of the Arctic Ocean, and is nearly as large as the state of Maine. ANWR is home to grizzly and polar bears, wolves loping across the tundra, moose, vast flocks of waterfowl, and snowy owls ghosting on white wings. The Porcupine caribou herd lives in and migrates across ANWR and is used in the traditional lives of several groups of native people. But beneath ANWR, there probably is oil.
Let's visit The Arctic National Wildlife Refuge (ANWR): Where Caribou Meet Oil Conduits
Energy vs. Environment
The Alaska Pipeline, not too far from ANWR, has pumped billions of dollars’ worth of petroleum south from regions near the North Slope. But as that oil runs out, the pipeline may soon be left empty—a very expensive tube with nothing to carry. The similarity of geology suggests that ANWR also has oil to fill the pipeline, and to fuel automobiles in the U.S., or somewhere else in the world. There is not a lot of oil—maybe 10 billion barrels, according to the USGS, with maybe 1/3 of that likely to be produced over a few decades if production is allowed, according to the US Energy Information Agency. If so, then ANWR might supply a little under 6 months of US oil use, not especially important in the big picture. But, with oil having fluctuated between $50 and $100 per barrel for much of the 21st century, 6 months of US oil use represents more than $100 billion and maybe much more…a LOT of money. The argument between wilderness and development has been going on for decades, and is not likely to end soon. So, let’s look a little more closely at this, which is one of the most important issues for the coming decades, because our well-being depends on using fossil fuels now, and on stopping that use in the future.
Want to see more?
Visit the Arctic National Wildlife Refuge website. While you are not required to review this, you may find it interesting and possibly even helpful in preparing for the quiz!
Fossil Fuels
Fossil Fuels
Plants have an amazing ability. A towering redwood tree, or any other plant, is just carbon dioxide (CO2) and water (H2O) plus a few trace elements, put together with the sun’s energy. All plants that photosynthesize do this, releasing oxygen (O2) in the process. The chemical composition of plants is, more-or-less, CH2O, so an approximate chemical formula for photosynthesis is:
CO2+H2O+sun’s energy→CH2O+O2
Most of the rest of us—animals, fungi, many bacteria—as well as forest fires run this reaction backwards, combining plant material with oxygen to release energy, carbon dioxide, and water. Done rapidly, this is the “burning” of a fire; done slowly, it is still burning of a sort, which you might call "respiration." Plants usually include a little nitrogen and traces of other elements that we didn't write in the simplified formula above, and animals often use the plant material with its nitrogen and trace elements to make proteins that make animals, but after the animals die, they are almost always "burned" by bacteria or fungi or other animals that eat them to release the energy, and the equation is pretty close to what happens.
But, sometimes the dead materials end up in a place without oxygen. Then what? A little more “burning” can be done by microorganisms using certain other chemicals such as sulfate instead of oxygen, but all burning by living things stops when these other chemicals run out, too, and burning by fires does not occur in wet places. Then, the dead things may remain as unburned dead things for a long time. And, if a lot of dead things occur close together, fossil fuels—coal, oil, and natural gas—become possible.
Coal
Coal is formed when bacteria break down dead woody plants (trees, leaves, etc.). When and where there is no free oxygen in the air or water, bacteria remove the oxygen and hydrogen from the plant material, leaving mostly carbon and forming a brown material called peat. (Note that when gardeners talk about “peat”, they usually mean “peat moss”, a specially selected product made mostly of dead sphagnum moss. Peat moss is peat, but most peat would not be satisfactory for gardeners as peat moss.) When peat is buried by more sediment, it gets hotter as that sediment partially traps the Earth’s geothermal heat, which helps drive off more of the remaining oxygen and hydrogen, thus forming coal.
The classification of coal can become quite complex, but in common usage, coal is usually separated into lignite, bituminous, and anthracite. Lignite or brown coal has not been cooked too much; it is common in the western United States. Bituminous coal is formed from lignite by heat and pressure and is common in many places including western Pennsylvania. In a few places including eastern Pennsylvania, closer to the center of the old Appalachian Mountains, the bituminous coal was cooked to metamorphic anthracite coal. Peat is found with loose sediment, lignite with not-too-hard sedimentary rock, bituminous with harder sedimentary rock, and anthracite with metamorphic rock.
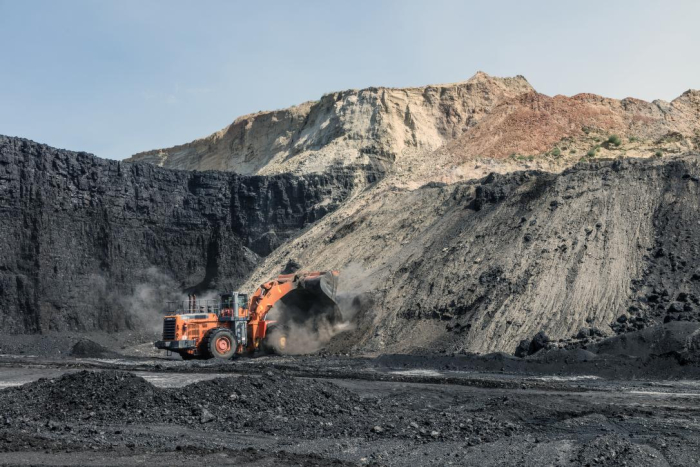
Oil and Natural Gas
Oil has similarities to coal, but oil is formed mostly from dead algae buried in mud, usually from marine settings but sometimes from lakes. Other dead things may be involved in oil formation as well, but they were “slimy” rather than woody in life. Please note that dead dinosaurs or other large creatures have never been important in fossil-fuel formation; there just aren’t enough large creatures at any time to supply the immense amounts of carbon needed to make economically exploitable fossil-fuel deposits.
Algae start with more hydrogen and less oxygen than wood, so the fossil fuel they produce ends up with chemicals containing mostly carbon and hydrogen (usually called hydrocarbons), different from the mostly-carbon coal that forms from woody plants. If mud containing dead algae is buried deeper by more sediment, heat breaks down the algae to release liquid oil. More heat breaks down the oil and makes natural gas, which is primarily methane (CH4). (Some natural gas also is made at low temperatures by bacteria before the algae and mud are buried too deeply, and some natural gas is made during the formation of coal.) While the heat is making oil and gas, the mud is being squeezed to make shale.
Pennsylvania contains some oil and natural gas, and the first modern oil well was drilled in western Pennsylvania in the year 1859. Humans had used petroleum before then, but from natural seeps rather than wells. Indeed, that first Pennsylvania oil well was drilled where oil was leaking out of the ground and had been used by native people for a long time. That first oil well was motivated in part by a looming shortage of whale oil for lamps to light homes on dark nights, because the demand for whale oil far exceeded the ability of the oceans to grow whales. (People also used a biofuel that was a mixture of alcohol and turpentine in lamps, but it was even more explosive than the kerosene that came from the oil, and thus was quite dangerous.)
Where We Find Fossil Fuels
As noted above, early humans found fossil fuels where they leaked out of the ground. At certain oil seeps, after some of the oil evaporated or was used by bacteria, a sticky material was left behind that trapped animals in “tar pits”. Native people probably harvested these trapped animals at what is now the La Brea Tar Pits National Natural Landmark in California, and at other such tar pits elsewhere, in addition to using the oil and tar in other ways. But, to get the huge quantities of fossil fuel we use today, we cannot wait for it to leak out of the ground; we have to go down and get it.
Coal is usually found in layers between layers of other rocks. Early coal mining generally involved digging out the coal from these layers and hauling it to the surface, using supports to prevent roof collapses (which sometimes occurred anyway). Increasingly, coal mining is done by digging giant open pits, stripping off the materials above the coal and dumping them elsewhere, then digging up the coal. Such “strip mining” has large environmental costs.
Most oil and gas are formed in shale, which is made from mud. The shales that are rich in dead algae and thus produce a lot of oil and gas often appear dark in color and are called “black shales”. The mud that makes up the shale has very small particles with very small spaces between them, and oil and gas do not move rapidly through those small spaces unless the shale is broken. Because of this, much of the oil and gas that originally formed in these shale layers is still in them.
We humans have recently become much more efficient at getting oil and gas out of these black shales, in a process generally called “fracking”. An oil company will drill down to a black shale layer, and then use some impressive technologies to turn the drill and bore along inside the layer. Then, the borehole is pressurized enough to break the surrounding shale, and water, sand, and various chemicals are squirted into the new cracks to keep them open and enhance the ability of the oil and gas to move through the new cracks, as shown in the first panel of the diagram below. Oil and gas are then pumped out of the well, as shown in the second panel.
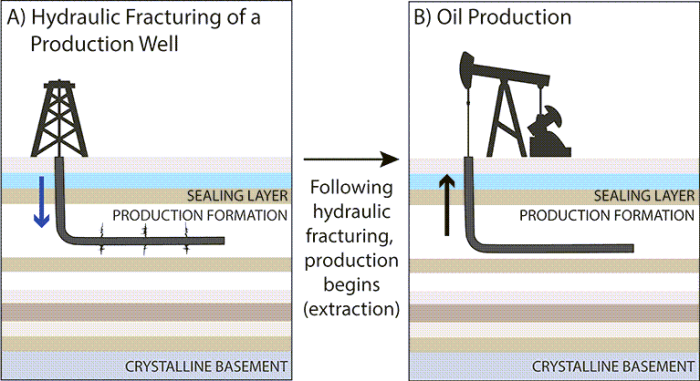
But much of the original oil and gas long ago escaped from where they formed in the shale. Probably most of that original oil and gas has been lost entirely, as described soon, but some of it has been trapped elsewhere. Traditionally, most oil and gas came from oil companies drilling into this oil and gas that migrated to traps.
Gas or oil take up more space than the dead algae they came from, and so as they form, they tend to push on the surrounding shale and help break it, often aided by mountain-building stresses or other stresses in the Earth. Most of these fractures will let some oil and gas out of the shale and then re-seal as the weight of sediments above squeezes them back together and often as new minerals are deposited in the cracks. This keeps much of the oil and gas in the shale and makes it difficult for other oil, gas, and water to move through the shale layers.
Oil and gas are low in density and float on water or vent into the air. So, when they escape from a black shale layer, they tend to rise through water-filled pores in rocks and escape at natural seeps on land or beneath the sea. In some places such as in the Gulf of Mexico, strange biological communities have been found living on oil seeping out of the sea floor. (Oil is natural, and some species “like” oil in small quantities. But if a supertanker wrecks or an oil well blows out, nature cannot use that much oil all at once, and large problems for nearby living things usually result.)
Because of the tendency for oil and gas to escape, a large accumulation of oil outside of black shale can form only if there is a trap of some sort. Many different types of traps exist. For example, the figure below shows one common type of trap.
Deposition of shales often occurred alternating with sandstones, as you saw at the Grand Canyon, so it is common to see a pile of sedimentary layers that goes shale-sandstone-shale-sandstone, and so on. As shown in the diagram, mountain-building processes often folded the layers in such a pile. Then, oil and gas escaping from a deep black shale layer rose into the spaces between grains in the sandstone above, but were trapped by a shale layer above that.
Geoscientists have worked for decades to design better ways to find such special places so that wells can be drilled into them to extract the oil from the sandstone, as shown. Extracting the trapped oil and gas is easier than fracking, and fewer wells can produce more fossil fuels for longer times, thus making more money for the oil company if the geoscientists are really good at finding the special places. If the geoscientists don’t find the special places or the drillers don’t hit the special places, a “dry hole” results and millions of dollars may have been wasted on drilling. Oil companies have hired more geoscientists for decades because the geoscientists have been so efficient at doing their jobs.
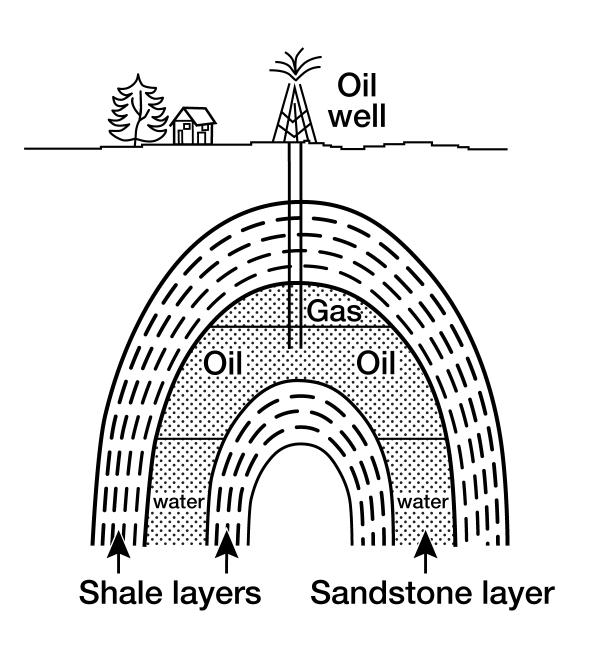
At present rates of use, and at costs vaguely similar to what we see today, the oil and gas will last maybe half a century, and the coal for more than a century. If we were willing to pay more for gasoline, say $50 per gallon, more fossil fuels would be available. As discussed below, that would cause very large and very damaging climate changes, as well as other damaging impacts.
Impacts of Fossil Fuels
There are a few references at the end of the Module if you want to follow up on the topics introduced here.
We use fossil fuels for good reasons. Most of our energy is obtained from fossil fuels. We run washing machines, rather than hand-scrubbing our clothes, primarily with fossil-fuel energy. Most of us are freed from the manual labor of hoeing and plowing to grow our food because fossil-fueled tractors plow and plant and cultivate and harvest. Many of us have been freed from freezing to death in the winter, or perishing of heat stroke in the summer, or dying because we can’t get to the hospital in an emergency, because of fossil fuels. In the US in recent decades, slightly more than 80% of our external energy use was supplied by fossil fuels. And, our energy use in that time was about 100 times as much as the energy from our food—what is done for us by external energy, mostly fossil fuels, is 100 times more than we can do for ourselves. This is a HUGE difference, and an important reason why we live as well as we do. (For the world over the same time, the average is about 25 times more external energy than energy from food, with a similar fraction of slightly more than 80% from fossil fuels.)
For humans, and for the few types of domesticated animals and plants that have benefited from our use of fossil fuels (pigs, rice, chickens and soybeans, for example), there is little question that fossil fuels have been good. For other species on Earth, our use of fossil fuels to tame much of the planet has been less beneficial. How much easier did fossil-fueled trains make it for humans to travel west to shoot bison? How much easier is it to cut a tree with a fossil-fueled chain saw than with a stone hatchet? However, this is complicated by the fact that we have let some trees grow back, and we quit burning whales (or whale oil) to light evenings because we switched to burning the long-dead algae and trees that are fossil fuel.
There clearly are other costs of fossil-fuel use. Damage to tundra from oil exploration may last decades or longer. Acid rain, mainly from coal-fired power plants, killed the trout in headwaters streams in the Great Smoky Mountains National Park and in some other places including in Pennsylvania. Smog is not good for us and shortens our lives. A study published in 2021, for example, found that 20% of global deaths were caused by breathing fine particles released by fossil-fuel burning. (Other studies have found somewhat different numbers, and there are ways to clean up much of this pollution without completely stopping the use of fossil fuels, but there is no doubt that burning causes air pollution that hurts health, and that much of our burning is fossil fuels. We will see soon that fossil-fuel use is also making forest fires worse, further increasing the health risks.)
The list could go on. Interstate 95 was closed twice in less than a year for extended periods because bridges were damaged by the resulting fires when fuel tankers crashed. Various insurance and government data coming out in the early 2020s showed that gasoline-powered cars, with their explosive fuel interacting with electrical systems (spark plugs, batteries, lights, …) were 10-100 times more likely to catch on fire than electric-only cars. Leaks from gasoline storage tanks or other fuel and oil leaks have contaminated groundwater in many places. Carbon dioxide released by fossil-fuel burning is acidifying the ocean and endangering many species. Earthquakes are often triggered when salty, somewhat-radioactive fluids that are recovered from fossil-fuel wells are pumped back into the ground for disposal. This is far from a complete list. And, as discussed in the next section, climate change caused by fossil-fuel use is probably the biggest issue, with potentially immense costs.
There can be no doubt that anything we do to get large amounts of energy will have unintended consequences, and that we could make a long list of problems with energy sources we might use to replace fossil fuels, such as nuclear or hydroelectric or geothermal or wind or solar or waves or tides or…. There is an increasingly rich scientific and engineering literature, though, showing that a sustainable energy system can be built that will supply more energy at less total expense and with fewer unintended consequences than the one we have now, which is really good news. We cannot possibly cover this whole topic in this course, but we’ll return to it a little before we finish this Module. Be assured, though, that there can be good outcomes from what may seem like a really bad situation.
Want to see more?
Join Dr. Alley in this optional video (no, it won’t be on the quiz) to learn about the formation of Fossil Fuels, in Barataria Reserve, Jean Lafitte National Historical Park and Preserve, Louisiana, from the PBS television special Earth: The Operators’ Manual.
Video: Formation of Fossil Fuels (2:25)
So why are fossil fuels such a powerful, but ultimately problematic, source of energy? Conditions on the waterways of today's Louisiana help us understand how fossil fuels are made and why they're ultimately unsustainable. Oil, coal, and natural gas are made from things, mostly plants, that lived and died long ago. It's taken hundreds of millions of years for nature to create enough of the special conditions that save the carbon and energy in plants to form the fossil fuels that we use. Here's how it works... Plants, like these tiny diatoms encased in silica shells, grow in the upper layers of lakes and oceans, using the sun's energy to turn carbon dioxide and water into more plants. When they die, if they are buried where there's little oxygen to break them down, their chemical bonds retain the energy that began as sunlight. If enough carbon-rich matter is buried deeply enough, for long enough, the Earth's heat and pressure turn it into fossil fuel, concentrating the energy that once fed the growing plants. Vary what goes into Earth's pressure cooker, and the temperature, and you end up with the different kinds of fossil fuel. Woody plants make coal. Slimy plants, algae, will give you oil, and both of 'em give rise to natural gas. The fossil fuels formed over a few hundred million years, and we're burning them over a few hundred years, and if we keep doing that, sooner or later, they must run out. But there's a bigger problem with fossil fuels. As we've seen, they're made of carbon primarily, and when you burn them, add oxygen and that makes CO2 that goes in the air. We're reversing the process by which they formed. And if we keep doing this, it must change the composition of Earth's atmosphere. (jet engine roaring)
References
-
The National Park Service note about acid deposition and trout in the Great Smoky Mountains was accessed in 2024 at https://www.nps.gov/grsm/learn/nature/population-dynamics.htm?fullweb=1 and included the quote: “In fact, at least 7 brook trout populations have disappeared in the last 30 years as a direct result of reduced stream pH (average pH<6.0) due to acid deposition in these headwater areas.”
-
The study on the health impacts of particulate air pollution from fossil-fuel burning referenced here is: Vohra, K., Vodonos, A., Schwartz, J., Marais, E. A., Sulprizio, M. P., & Mickley, L. J. (2021). Global mortality from outdoor fine particle pollution generated by fossil fuel combustion: Results from GEOS-Chem. Environmental research, 195, 110754.
-
For a little on the economics and options in transitions away from fossil fuels to sustainable energy, you might start with 2035: The Report, from the Goldman School of Public Policy, University of California Berkeley, June 2020, which has been hosted at https://www.2035report.com/wp-content/uploads/2020/06/2035-Report.pdf?hsCtaTracking=8a85e9ea-4ed3-4ec0-b4c6-906934306ddb%7Cc68c2ac2-1db0-4d1c-82a1-65ef4daaf6c1
-
or, from experts from the National Renewable Energy Laboratory and the US Department of Energy, Coley, W.J., D. Greer, P. Denholm, A.W. Frazier, S. Machen, T. Mai, N. Vincent and S.F. Baldwin, 2021, Quantifying the challenge of reaching a 100% renewable energy power system for the United States, Joule, Volume 5, Issue 7, Pages 1732-1748, https://doi.org/10.1016/j.joule.2021.05.011.
The Greenhouse Effect
The Greenhouse Effect
Because the Earth contains a limited supply of fossil fuels, and we are using them up rapidly, and it will take ~100 million years or more for nature to make a lot of new ones, we must replace fossil fuels with some other energy sources or face really huge problems. But, if we burn most of the fossil fuels that still exist in the Earth and let the carbon dioxide accumulate in the atmosphere before building a sustainable energy system, we will live in a really different climate that will make our lives much harder. The scientific community knows this really well. Several lines of information are involved, starting with the effect of carbon dioxide on the greenhouse effect.
If not for the greenhouse effect, we humans probably would not be here. The Earth’s atmosphere allows the shortwave radiation (what we usually call "sunlight") coming from the sun to pass through to the Earth’s surface, without too much interference. (There is a little interference. Among other things, blue light is scattered off air molecules a bit more than red light is, so the blue light bounces around in the atmosphere and reaches our eyes from all directions in the sky, whereas the red comes more directly from the sun, which is why the sky is blue.) The windows in a greenhouse similarly allow sunlight to enter easily.
But, the sunlight heats the Earth or the inside of a greenhouse, which then radiates longwave radiation (infrared radiation) back upwards. As we saw way back at the Redwoods, the total energy reaching the planet on average equals the total energy leaving, but the arriving energy is mostly shortwave electromagnetic radiation (light that we can see) while the leaving energy is mostly longwave electromagnetic radiation (infrared radiation that we cannot see without special sensors). The windows of a greenhouse do not allow longwave radiation to pass through easily; some gets through, but some is trapped.
When the sun rises after a cold night, energy enters a greenhouse but has trouble leaving, and the extra energy warms the greenhouse. Warming makes the floor of the greenhouse emit more longwave radiation, forcing some through the glass until a new balance is reached between incoming and outgoing radiation, but with the greenhouse at a higher temperature than would occur without the windows of the greenhouse. Some gases in the atmosphere act in the same way as the windows on the greenhouse, intercepting some of the outgoing infrared longwave radiation and keeping that energy in the Earth system. As described in the Enrichment, carbon dioxide really is the most important greenhouse gas, even though water vapor intercepts more of the outgoing radiation from the Earth; methane and some others also matter. Without these greenhouse gases in the atmosphere, the Earth would be mostly frozen.
Human-Caused Greenhouse Warming
Human activities are increasing the concentrations of greenhouse gases in the atmosphere. Carbon dioxide, mostly from the burning of fossil fuels and also from the burning of forests and a few other sources, is by far the most important greenhouse gas, because of its direct effects and because the air warmed by the carbon dioxide picks up more water vapor, also a greenhouse gas. In the USA in the early part of the 21st century, fossil-fuel burning produced about 15 tons of carbon dioxide per person per year! The greenhouse-gas methane, which is produced in cow guts, landfills, rice paddies, and other places where plant material or other carbon-carrying compounds break down in the absence of abundant oxygen, also has been increasing, and human activities also are increasing a few other less-important greenhouse gases.
The world is undoubtedly warming, as shown by thermometers, including thermometers far from cities and in weather balloons and on satellites, in the ground and in the ocean, analyzed by government and university scientists and other scientists in many different countries, including with industrial funding. The thermometer records are confirmed by changes in temperature-sensitive types of snow and ice, NOT the top of Antarctica at -50o, which won't melt even with a fairly large warming, but we see reductions in seasonal river and lake ice, seasonally and "permanently" frozen ground, springtime snow, mountain glaciers, the edges of the Greenland and Antarctic ice sheets, and more. The vast majority of significant changes in where plants and animals live, and when during the year they do things, are also in the direction expected from warming.
Furthermore, there is very high confidence that the observed warming is from the observed rise in carbon dioxide. The physics is unavoidable; rising carbon dioxide causes warming. This basic understanding of the greenhouse effect, and the role of carbon dioxide and other gases, was worked out in the 1800s, with the first calculation of the warming effect of fossil-fuel burning in 1896. That was before quantum mechanics was discovered; newer calculations using quantum mechanics are more precise. Much of the important quantum-mechanical work on this subject was done by the U.S. Air Force after World War II. They were not primarily studying global warming, but instead were worrying about such things as the appropriate sensors on heat-seeking missiles to shoot down enemy bombers. (With the wrong sensor, the missile wouldn’t "see" the infrared radiation from the hot exhaust of the enemy engine because carbon dioxide is in the way.) And, carbon dioxide interacts with infrared radiation going from Earth to space in the same way. Satellites confirm this every day. Indeed, before satellites were invented, scientists predicted what satellites would see when they were launched and looked back at the energy leaving the Earth, and those predictions were right.
Any scientist who could find a true alternate explanation of the warming would help humanity, and would immediately be famous and receive awards and speaking invitations and other good things; thus, you can be sure that many scientists have tried very hard to find some other explanation for some or all of the observed warming. As noted next, there are some other small influences on temperature, but a lot of effort has totally failed to change our understanding that the carbon dioxide we are releasing is the primary driver of climate change now.
Nature did contribute a little to the warming in the early 1900s, when a few decades passed without major sun-blocking volcanic eruptions and when, coincidentally, the sun brightened a little. But, warming continued after that even though the sun dimmed a little and a few volcanic eruptions threw up particles that cooled the climate by slightly blocking the sun, and as humans put up a lot of particles from smokestacks that also blocked the sun. Humans also caused a little cooling by cutting down a lot of dark sun-absorbing forests and replacing them with more-reflective surfaces, but the warming continued anyway.
We know from geologists and other scientists studying climate history recorded in ice cores and other archives that climate is not significantly influenced by natural changes in cosmic rays, space dust, Earth’s magnetic field, or anything else weird; and, we know that none of these are changing much now anyway. Changes in features of Earth’s orbit are important in changing climate, as we learned back in Module 7 with Milankovitch cycles and ice ages, but over “short” times of centuries or less the orbital changes are too small to affect climate significantly, and in addition, we are at a point in the cycles when the changes are naturally small. Extra heat is not coming out of the ocean or land or ice to warm the air; instead, heat is moving out of the air to warm the ocean and land and melt ice, yet the temperature of the air continues to rise. The Pacific Ocean flips back and forth between El Niño and La Niña, shifting the climate a little warmer and then cooler over a few years, but this cannot create trends in climate, only fluctuations around the trend from other causes.
Furthermore, the "fingerprint" of the warming in space and time is just what is expected from the effects of rising carbon dioxide, and completely unlike the pattern expected from changes in the sun, volcanoes, El Niño, or other natural fluctuations. For example, adding carbon dioxide to the air warms near the Earth’s surface but cools high in the stratosphere where the radiation emitted by the extra carbon dioxide can escape to space and thus cool off other gases in the air, but turning up the sun would warm the stratosphere as well as the surface; the data clearly show the carbon-dioxide pattern of warming down here but cooling up there. Computer models of the climate system, when forced only with the known natural causes of climate change such as changes in the sun and volcanoes, do a good job of simulating the climate changes that happened before greenhouse gases had risen much but do a lousy job of simulating more-recent changes after human emissions of carbon dioxide became large; adding those human-caused effects allows the models to simulate what happened quite accurately up to the present, with rising carbon dioxide most important.
The climate models have repeatedly proven to be accurate, predicting future changes accurately and “retrodicting” past changes without cheating, so those models give us clear guidance for the future. If we continue to burn fossil fuels and release the carbon dioxide, and we don’t do extensive geoengineering by taking immense amounts of carbon dioxide out of the air or else doing the huge task of imitating the volcanoes and blocking the sun ourselves, we will continue to see warming and other changes.
When carbon dioxide rises, direct warming is unavoidable from the basic physics. And, the warming causes other changes, which in turn affect the climate in what we call feedbacks. For example, snow and ice reflect a lot of the sun’s energy, and so help keep the Earth cooler than we otherwise would be. Warming from rising carbon dioxide tends to melt the reflective snow and ice, exposing darker dirt or plants that absorb more sunshine, which causes more warming. The most important feedback is from water vapor—putting warmer air over the vast ocean causes the air to pick up more vapor, which is a greenhouse gas itself and causes more warming.
In total, if we put up enough carbon dioxide to warm the climate by one degree, the actual warming will be roughly three degrees, with uncertainties that include a little less, a little more, or a good bit more, but not a good bit less. For more on feedbacks and uncertainties, and for the stabilizing feedbacks that will eventually remove the carbon dioxide we release over ½ million years or so, go to the Enrichment.
So What?
Few people really care about the average temperature of the Earth, but many people care about how changes in that temperature will affect humans and other living things. Impacts are harder to estimate than temperature change, both because of the additional uncertainties involved in estimating how the temperature change will affect the economy and ecology, and because of the involvement of human values. For example, if warming causes species to become extinct, but those species were not economically important, how bad is that? You will find really strong differences of opinion across the political spectrum in the U.S. and the world, with some people really unhappy that we are driving species to extinction and other people apparently not very concerned. (The value of species will be addressed later in this Module.)
Some disagreement probably should be expected about some aspects of climate change. The climate in many places is already too hot for humans and many of our animals and crops to live comfortably; making these places hotter will not be good for us. Other parts of the world, generally with many fewer people, are too cold for comfortable human habitation today, so warming them could be good for the humans living there, although there will be much bad for them as the melting ice floods their coasts, and melting ice in permafrost causes their roads and buildings to settle and break, and warming makes it harder for native peoples there to preserve their traditional lifestyles, and…. Note that most of the use of fossil fuels that drives warming is done by relatively wealthy people living in colder places, while the greatest harm will be done to poorer people in hotter places, raising large ethical issues.
A few of the big impacts of more warming include:
- Too much heat. If we continue to rely on fossil fuels, later this century some parts of the Earth could have heat waves that will be fatal to all unprotected people—a healthy person sitting naked in the shade in the wind drinking water will die from overheating. Long before then, heat stress to people, their animals and crops may drive climate refugees unless major adaptations are made such as exceptionally widespread installation of air conditioning. We already are seeing an increasing number of deaths from overheating, despite the fact that nowhere has yet become hot enough to be truly unsurvivable for a careful, healthy person.
- More floods and more droughts. Warmer air carries more water vapor, picked up from the vast ocean as well as from the land surface, and thus warmer air can generate more, faster rainfall when conditions are right, causing flooding. Clothes dryers and hair dryers have heating elements to dry faster, and in the same way, warmer air can bring on more droughts faster after the rain stops.
- Sea-level rise. Warming ocean water causes it to expand, and warming melts mountain glaciers and the edges of the great ice sheets, releasing their stored water that eventually reaches the ocean.
- Strong storms becoming stronger, because more energy is available to them.
- Ecological displacements. This is expected to cause extinction of many species, and may spread diseases to new places (malaria is limited by cold, for example, and so its spread will be favored by warming).
- More forest-fire weather, with the potential for western-type fires spreading into places including the Appalachians where such fires have not been observed or prepared for.
- And much more.
Note that costs go up much faster than the temperature. With a little bit of sea-level rise, for example, we deal with “nuisance flooding” by staying away from certain flooded roads at certain times, but otherwise we go on with our lives. A little more sea-level rise, though, will require highly expensive engineering in some places to keep salt water out of our drinking water, or will require abandonment of some roads and neighborhoods and even whole cities or else expensive engineering to protect them. Thus, the warming so far has not been hugely expensive because we started with some capacity to adapt to it, but we are using up that adaptive capacity, and the full scholarship shows clearly that costs will rise rapidly with further warming.
Uncertainties
There are of course uncertainties in all of this, but these uncertainties really provide a strong argument for working harder to reduce future warming, not a reason to wait until we’re more certain. And, they provide a strong argument for more research to reduce the uncertainties.
Here’s a short video explaining the uncertainties related to climate change, and a few thoughts on what this might mean to us.
Video: Uncertainties (3:44 minutes)
The scholarship of climate change really does have uncertainties in it, and that's really not good news. So let's take a look at uncertainties, starting with an analogy. Suppose that you have to drive somewhere. What are you likely to encounter? What do you plan for? We'll look at the problems from small to large. We'll look at how likely these are from small to large.
When I drive, I sometimes still turn on the radio and, you know, I get caught in traffic and the tunes are blah and they're playing commercials. And the best thing I can hope for is no traffic and great tunes. But what I usually get is lots of traffic.. And I used to run into them testing the emergency broadcast system where they go, but that's nothing compared to getting run over by a drunk driver and then you're dead. Now what do I do about that?
I have a car with airbags and crumple zones and anti lock brakes. And I put on my seat belt. And when we had kids at home, we put them in child seats and we carry insurance. We're, we're happy that Mothers Against Drunk Driving is out there working. We support the police who want to address those drunk drivers. We support the highway engineers that make the roads safer. We put a lot of effort into something that we don't expect to happen because it could be so bad.
Now, if we go to climate change, there is a best estimate of what's likely to come from the United Nations Intergovernmental Panel on Climate Change, and that would be here. And yes, there are problems and it could be that things will be a little better than that, but they could be worse than that and they could be a lot worse than that. We could hit some tipping point, some abrupt climate change and have an ice sheet collapse, or the North Atlantic current shut down in the ocean, or a drought hit and the Brazilian rainforest burn and not grow back. There really are possible disasters out there now. We sort of know this intuitively.
Building good things like my cell phone is really very hard. It takes a lot of tools you have to get everything right. But you could break this with a hammer or by dropping it in the ocean or in a whole lot of other ways. It's much easier to break things than it is to build them. It seems very unlikely that just cranking up CO2 in a hurry is going to turn the planet into something wonderful, but it's pretty easy to see ways that a lot of warming rapidly could break things that we value. Now, the next little bit is personal. I've had the opportunity to go down and testify to Congress, to meet with senators, to meet with other government officials, and my impression is that I've spent a lot of time having this discussion. Here's what we expect. Couldn't it be better? We expect this. Couldn't it be better? See, we've had both sides, and no, we haven't had both sides. Both sides include the possibility of really bad things, the existence of this large tail on the bad side, the same way we deal with transportation. It would motivate taking more efforts now to reduce climate change if we wanted to be economically efficient, and it also would motivate doing more research to reduce the uncertainties.
First, consider an analogy to a familiar issue—estimating how long it will take to drive somewhere, and how much the trip will cost. Suppose your phone tells you that a trip will take an hour with current traffic. If all goes well, and the traffic clears, you might save five minutes, and maybe you’re a really good driver and can save five more minutes. But, if things go wrong, you might be run over by a drunk driver and never make it at all, or arrive three weeks later after you get out of the hospital. The uncertainties include outcomes that are a little better, a little worse, or a lot worse than your most-likely estimate, but not a lot better. Your response to these uncertainties includes buying a car with crumple zones and antilock brakes and air bags, and putting on your seat belt to protect you, and if you’re transporting a baby putting them in an approved safety car seat, and paying police to arrest drunk drivers, and perhaps you donate to Mothers Against Drunk Drivers—you spend a lot of money on something you do not expect to happen, because it could happen and would be devastating if it did happen.
Uncertainties with climate change are often similar. Drs. Anandakrishnan and Alley study the possibility of ice-sheet collapse and sea-level rise. With warming, the expansion of ocean water and melting of mountain glaciers is virtually guaranteed to raise sea level, giving roughly ½ m (1.5 feet) of rise by the year 2100 under small warming, 1 m (3 feet) of rise by 2100 under large warming, and uncertainties of about ⅓ the rise…if the ice sheets behave. But, if certain possible events actually happen, the rise could be double or triple that, or even more, with no really good possibility to offset the really bad one. With costs are rising faster than sea level, and the uncertainties including the possibility that too much warming will cause very large, rapid sea-level rise, the costs could go up immensely. We will return to economics next, but the uncertainties do motivate more effort now to slow down the warming, and more research now to reduce the uncertainties.
Solution Space
Solution Space
Fortunately, we really do have solutions for the great challenges of supplying energy sustainably and economically. This is NOT the course to deal with all the nuances of future energy systems, a hugely important topic but too big for a portion of one Module in a course on the Geology of National Parks. A few key facts follow, though. Note that your course authors don’t really know the exact future of the energy system; if we did, we could turn that knowledge into a lot of money!
The single biggest development in energy has been the immense reduction in the cost of renewable energy. Solar panels that cost more than $100 in 1975 fell to about 25 cents in less than 50 years. The International Energy Agency, founded in 1974, spent decades being unenthusiastic about renewable energy, but by 2020 reported that state-of-the-art solar installations were supplying the lowest-cost electricity in human history, with wind close to solar in price. The energy that must be “invested” to make new solar cells and wind turbines is very small compared to the electricity they then produce, and probably is smaller than the investment needed to find and develop new fossil fuel deposits, helping explain why the costs of renewable electricity have dropped below costs from fossil fuel.
Although the land area (or ocean area) needed to supply all of human energy use from renewable energy sources is large, it is very small compared to the areas we use for some other purposes. For example, we grow food to eat, to feed animals, and to burn as biofuels (corn ethanol, biodiesel, etc.). Biofuels are a small part of our energy mix, much less than fossil fuels, but installing modern solar cells and wind turbines on the area we use for growing biofuels could supply more energy than is used by all humans from all sources because renewables are so much more efficient than plants at capturing the sun’s energy. Some farmers are choosing to combine wind or solar energy (or both) with ranching or farming, increasing farm income. But, renewables do not need to take farmland at all, and instead can be put across irrigation canals to reduce evaporation, above parking lots to shade them, offshore where the foundations can be designed to help provide fish habitat, and in other places.
Renewables have real needs in addition to land or ocean area, including materials, some of them rare. But, geologists remain confident that we can find sufficient materials that, with recycling, can supply a sustainable system involving much less mining and drilling than are required with fossil fuels. And, materials scientists remain confident that they can shift to reliance on more abundant elements, so the geologists don’t need to find more rare things for mining. For example, sodium batteries are already beginning to replace lithium batteries in some uses, and sodium is MUCH more common than lithium and so requires much less mining.
As noted above, anything that we do to supply the huge amount of energy we use will have unintended consequences. Wind turbines do kill some birds, for example, although the number is tiny compared to human-caused deaths from other sources including the current energy system. A full analysis, including the effects of climate change and the disturbances associated with fossil-fuel recovery, shows that switching to a sustainable energy system rather clearly will reduce overall bird deaths. And, we can now forecast and monitor major bird migrations, turning off wind turbines in important places at the right times to further reduce mortality (Sovacool, 2013)
The future energy system might include fusion if we invent that technology, or nuclear fission if costs can be brought way down and other problems can be solved, or geothermal energy, or some others. Biofuels may remain important for some hard-to-replace uses of liquid fuels such as long-haul airlines. So much energy is available at such low cost from renewables, though, that we know a sustainable system can be built, supplying affordable, clean energy for everyone across the world.
Sovacool, Benjamin K., "The avian benefits of wind energy: A 2009 update." Renewable Energy, Volume 49, 2013, doi:10.1016/j.renene.2012.01.074.
Cost-Benefit Analysis
Cost-Benefit Analysis
Fossil fuels provide great value, which we pay for, but also cause health problems and climate change, which generally are not included in the costs of fossil fuels. How important is this?
Economic analyses consistently indicate that reducing fossil-fuel use would be economically beneficial. The Nobel Prize in Economics in 2018 was given to William Nordhaus of Yale for building new types of models that provide guidance to policymakers and the public on optimal ways to distribute money among consumption now, broad investment to grow the economy and give future people the ability to solve problems, and targeted investment in issues such as climate change to reduce the problems that we leave for future people. Those models show that great improvements to the economy are available if we reduce fossil-fuel use efficiently.
A team working with the International Monetary Fund used these tools, and various other standard economic approaches, to estimate the costs to society of subsidizing fossil fuels. Some of this is direct subsidies such as tax breaks, but mostly it is the fossil-fuel damages we discussed above, from lost health and from climate change, that are not paid for by the fossil-fuel users. The International Monetary Fund group found that the subsidy for fossil fuels in 2015 was 6.5% of the world economy (gross domestic product), or $5.3 trillion. Seven years later, that had increased to $7 trillion, or 7% of the economy. As a rough approximation, for each dollar spent on fossil-fuel energy, society spends another dollar. Clearly, this varies with the costs of fossil fuels, and is higher for some countries and lower for others, but it is a useful first approximation. Governments almost always are involved with any large part of the economy, and there generally are taxes and subsidies scattered throughout the economy, but the size of this fossil-fuel subsidy dwarfs others. Note that the uncertainties mean that these fossil-fuel subsidies could be a little smaller, or a little bigger, or a lot bigger than stated here, but not a lot smaller.
Because the real cost of fossil-fuel energy is so high, there are strong economic reasons to move towards a sustainable energy system. Studies are repeatedly showing that with maybe 30 years of work, we can eliminate at least 90% and perhaps 100% of the global-warming emissions at a cost that is cheaper than continuing to rely on fossil fuels.
Again, we can guarantee that you can find heated arguments about everything we have written on this topic, and many things we have not written. We have tried to provide the best evidence. Dr. Alley has worked extensively with the United Nations Intergovernmental Panel on Climate Change, winner of the 2007 Nobel Peace Prize, as well as with the US National Academy of Sciences on some aspects of this, and has relied heavily on those sources and on other high-quality scholarship for the material presented here. Any energy transition will be a huge effort, and we don’t know in detail what really will be included in a sustainable energy system. But, the scholarship now really does show that this can be accomplished in ways that help the economy, increase employment, improve health and national security, and provide a better environment more ethically.
A few good sources
- For our note about the land area used for biofuels being able to supply all human energy use with renewables, start with Adeh EH, Good SP, Calaf M, Higgins CW. Solar PV Power Potential is Greatest Over Croplands. Sci Rep. 2019 Aug 7;9(1):11442. doi: 10.1038/s41598-019-47803-3. PMID: 31391497; PMCID: PMC6685942. They concluded that “Global energy demand would be offset by solar production if even less than 1% of cropland were converted to an agrivoltaic system.”
- This paper noted that roughly 4% of arable land is used for biofuels, Rulli, M., Bellomi, D., Cazzoli, A. et al. The water-land-food nexus of first-generation biofuels. Sci Rep 6, 22521 (2016). https://doi.org/10.1038/srep22521
- The International Monetary Fund estimate of fossil-fuel subsidies is from Coady, D., Parry, I., Sears, L., & Shang, B. (2017). How large are global fossil fuel subsidies?. World development, 91, 11-27; an update in 2023 was at https://www.imf.org/en/Publications/WP/Issues/2023/08/22/IMF-Fossil-Fuel-Subsidies-Data-2023-Update-537281
- To start learning about the economics of climate change and the value of moving away from fossil fuels, you might try William Nordhaus’ 2018 Nobel Prize lecture on the economics of climate change https://www.nobelprize.org/prizes/economic-sciences/2018/nordhaus/lecture/
- For temperature data, a good starting point is the NASA Goddard Institute for Space Studies GISTEMP site, with lots of graphics, raw data, and much more. https://data.giss.nasa.gov/gistemp/
- Probably the most important source on this topic is the United Nations Intergovernmental Panel on Climate Change, winner of the Nobel Peace Prize in 2007, at www.ipcc.ch Everything they do is open and archived, which is really wonderful, but means that there is a LOT of material. A useful starting point might be to look at the Summary for Policymakers of the Physical Science Basis of report, https://www.ipcc.ch/report/ar6/wg1/downloads/report/IPCC_AR6_WGI_SPM.pdf
- In addition to the Physical Science Basis, the IPCC provides reports on what climate change will do to us, and what we can do to reduce or eliminate our influence on the climate. Just the Summary of only the physical science section is 31 pages, so you can be sure there is a LOT of information there, assembled by the world’s scientists, in the public eye, working as volunteers, to provide guidance on climate.
- The US National Academy of Sciences and the Royal Society have some great resources at https://nap.nationalacademies.org/resource/25733/interactive/. Dr. Alley helped just a little with this one.
Yellowstone National Park
Yellowstone National Park
Island Biogeography, Yellowstone and Avoiding the Next Mass Extinction?
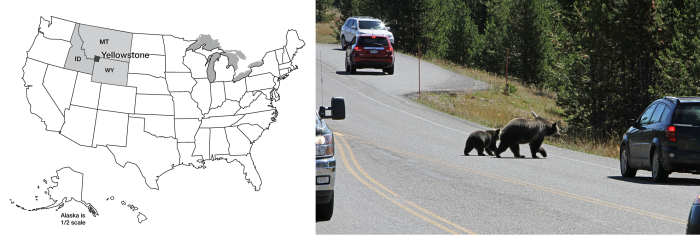
Most of the national parks were established to preserve geological features. A few parks, such as Sequoia and Redwood, were established for biological reasons. Increasingly, however, national parks are visited, used, preserved, and managed for biodiversity. Humans continue to spread. More and more land is brought under cultivation. More of the produce of the sea is netted and served to humans.
A 2023 study showed how grossly humans now dominate, finding that the world has just 20 million tons of wild land mammals (white-tailed deer, elephants…) and 40 million tons of wild marine mammals (whales…), compared to 390 million tons of humans and 630 million tons of domestic livestock (cows, pigs…). That makes 60 tons of wild mammals but 1020 tons of domestic mammals, 17 times more!
As we will discuss below, extinction is more likely for smaller populations, and with over 6000 species of wild mammals, the populations of most of those species are quite small and thus prone to extinction. Different mammals have different requirements for food, water, and other resources, but the differences are not huge because we are all closely related mammals, so this 17-fold difference in domestic versus wild mammals translates into a huge difference in the share of the world’s resources used, with humans increasingly overwhelming nature.
Greenspoon, Lior, Eyal Krieger, Ron Sender, Yuval Rosenberg, Yinon M. Bar-On, Uri Moran, Tomer Antman et al. "The global biomass of wild mammals." Proceedings of the National Academy of Sciences 120, no. 10 (2023): e2204892120.
Let's take a trip through Yellowstone, the Premiere Park
We briefly visited Yellowstone in Module 1, as the world’s first national park, and we went back to Yellowstone in Module 2 to discuss earthquakes. Yellowstone was indeed established to protect the geologic features, which were so rich, varied, and unusual that the early explorers found them hard to believe. The geysers, mud pots, hot springs, canyons, waterfalls, petrified trees, inside-out caves, and so much more cause many of us to believe that this is still the world’s best national park. But, if you chat with the rangers or with visitors, you will immediately recognize that people are deeply committed to the wildlife of Yellowstone. A ranger at any entrance station or a visitor’s center will spend the day fielding questions along the lines of “Where are the bears? Where are the wolves? Where are the moose? Where are the…?”
According to the National Park Service, Yellowstone hosts nearly 300 species of birds, 16 species of fish, five species of amphibians, six species of reptiles, and 67 species of mammals—including seven native ungulate species (elk, mule deer, bison, moose, bighorn sheep, pronghorn, and white-tailed deer; mountain goats are not originally native to Yellowstone but now occur in the north side of the park as well) and two bear species (black and grizzly). Badgers and bobcats, lynx and otters, and so many more species are found in the park. Along the Hayden Valley in the center of the park, or in the Lamar Valley to the northeast, or really almost anywhere in the park, a visitor who takes a little time to slow down, and especially one who goes out early morning and late evening, is almost guaranteed to have wonderful views of wildlife.
Yellowstone played an important role in saving the bison, which were hunted almost to extinction. In 1894, US soldiers arrested a poacher named Edgar Howell, and a photograph of the damage he had done proved to be essential in motivating Congress to pass additional protections for Yellowstone and the wildlife there. Full implementation of that act was some time in coming, and the population of bison in Yellowstone dropped to perhaps 23 animals or so, but, they survived, and Yellowstone is the only place in the lower-48 states that has had free-ranging bison since prehistoric times, with a modern herd that fluctuates a good bit but is generally around 5000 animals.
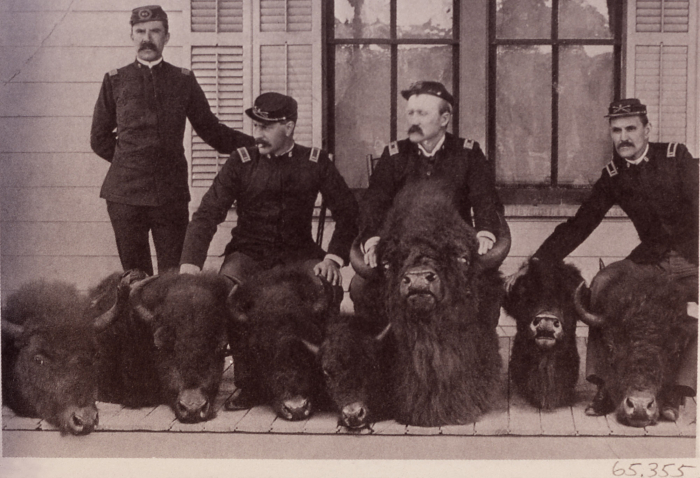
For more on the background of the picture, see Hampton, H.D., 1971, How the US Cavalry Saved Our National Parks, Chapter 7, Indiana University Press.
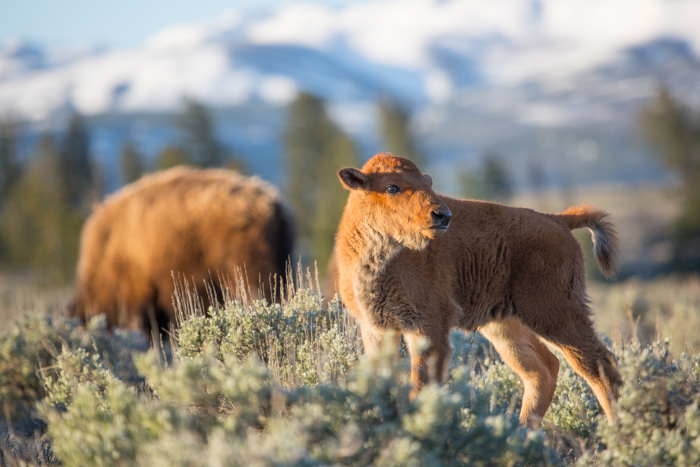
Island Biogeography and Avoiding the Next Mass Extinction
Island Biogeography and Avoiding the Next Mass Extinction
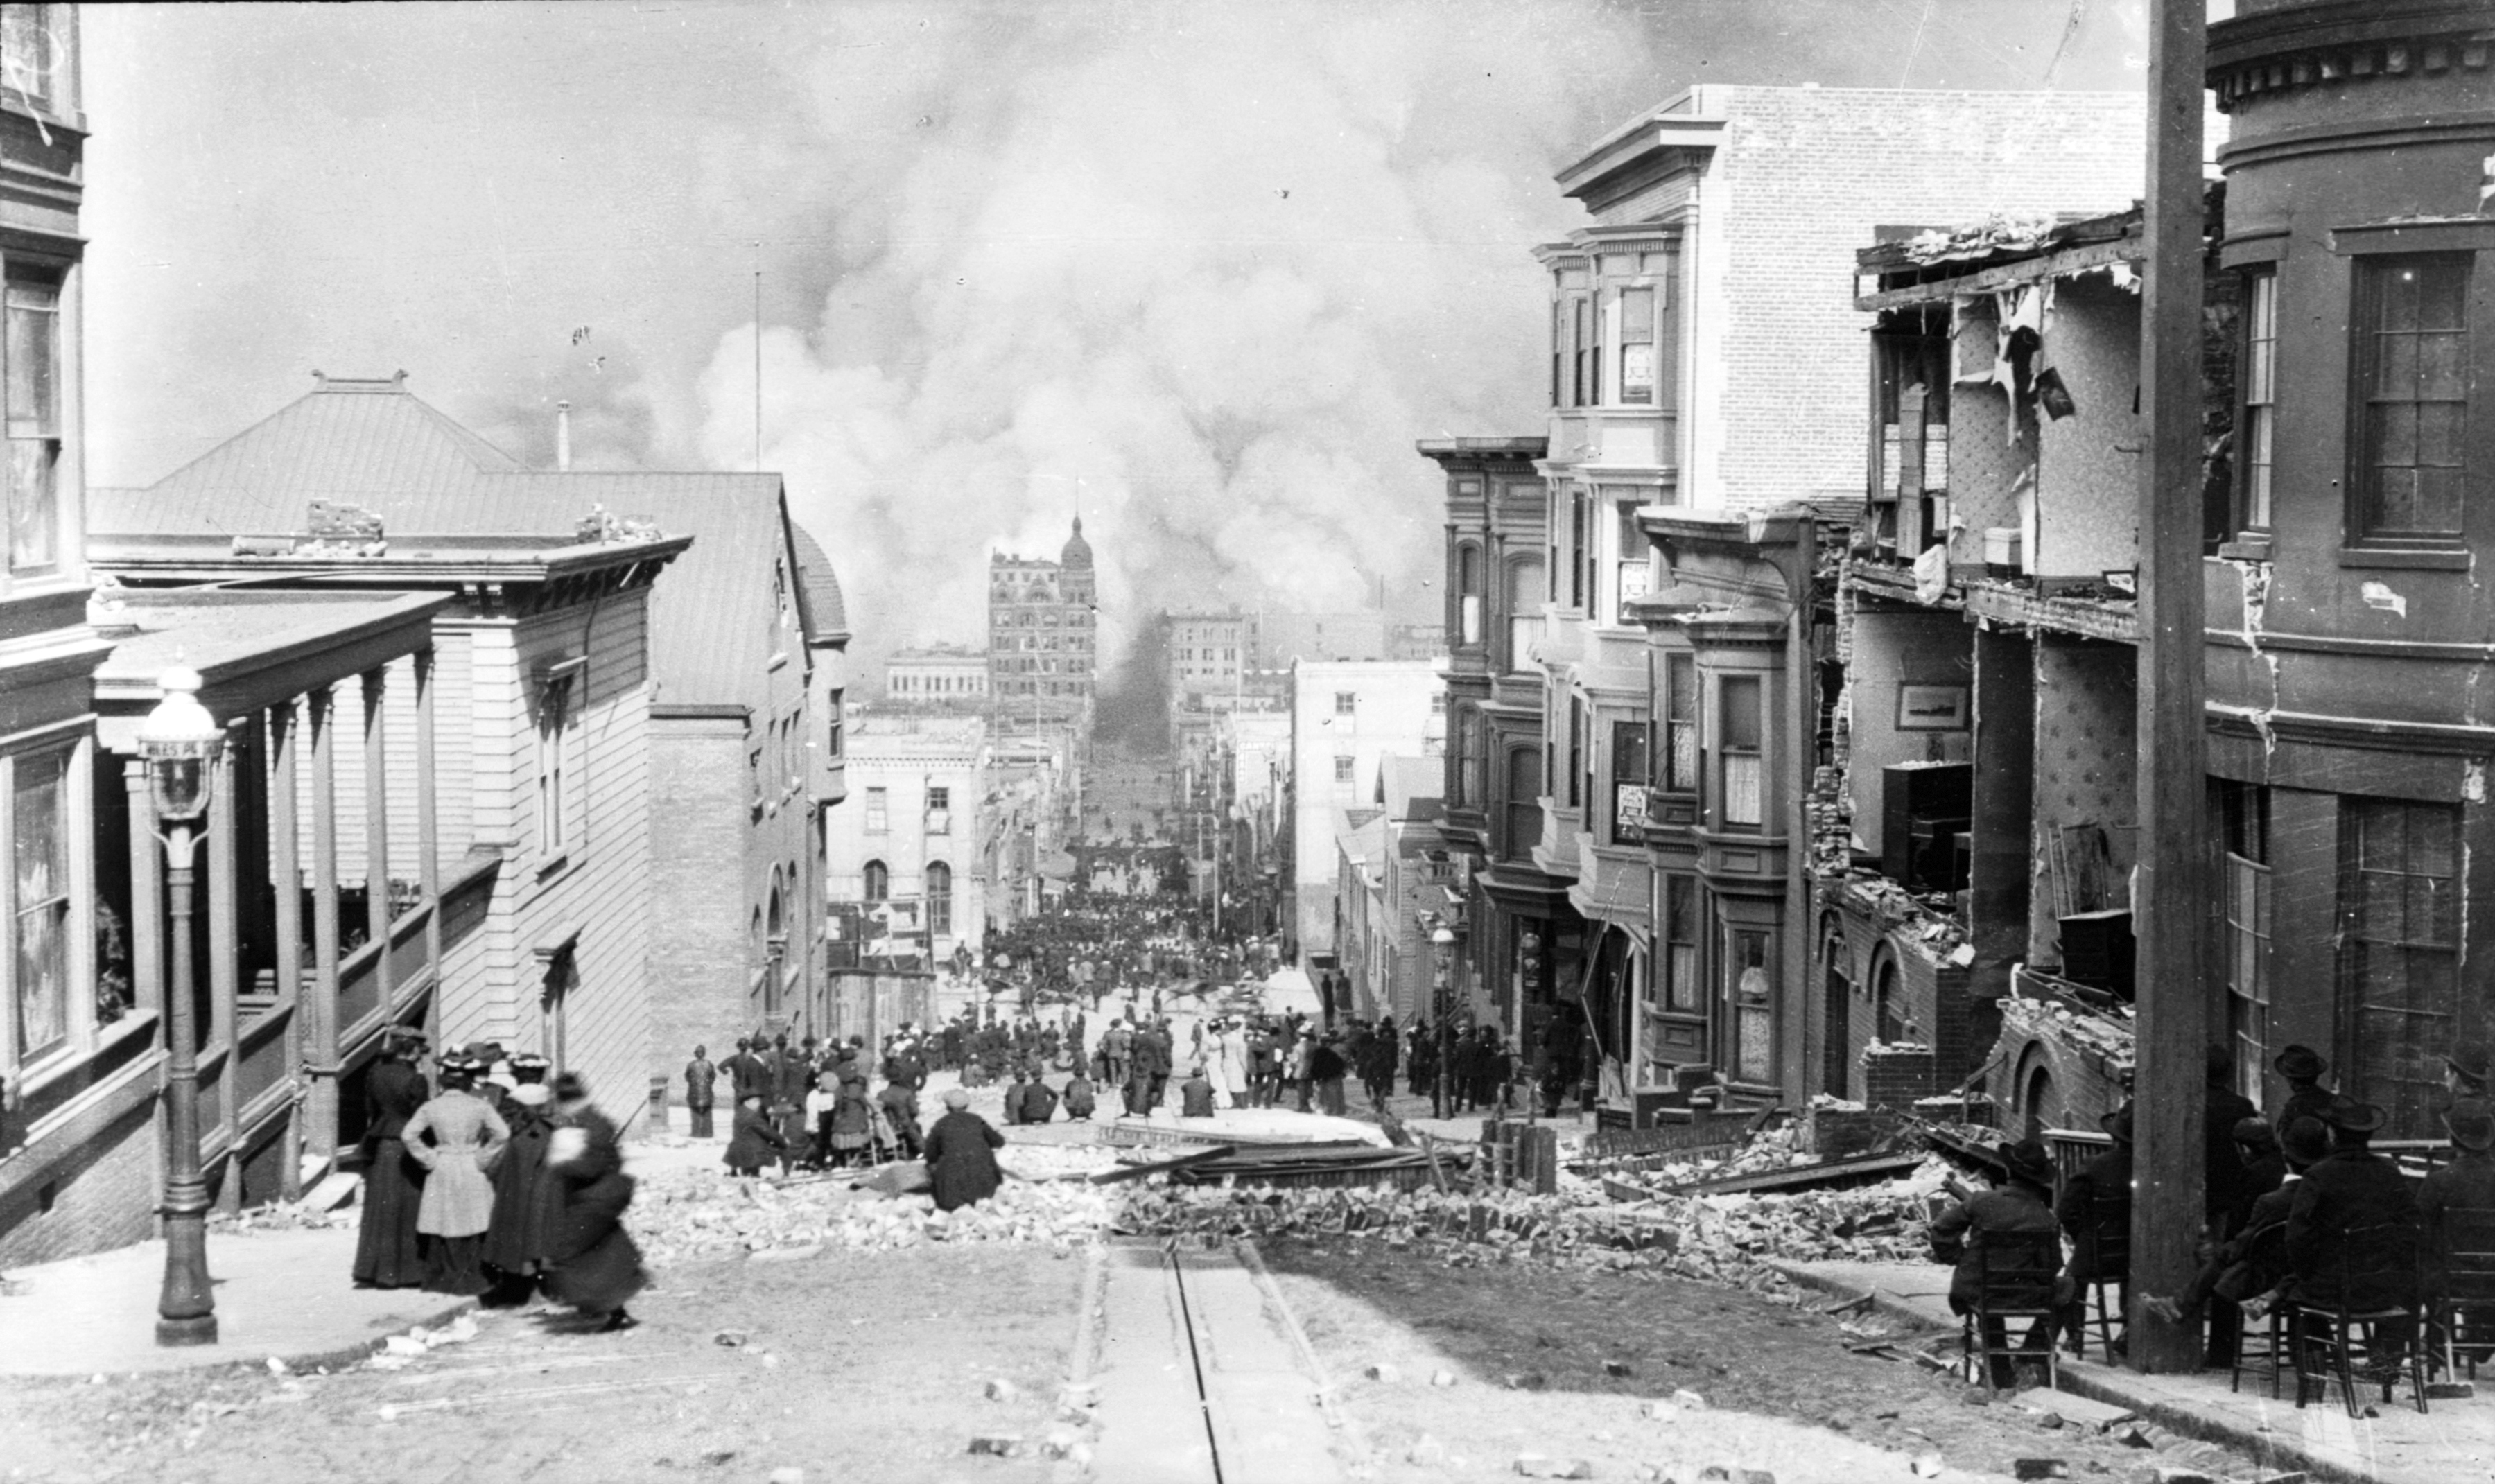
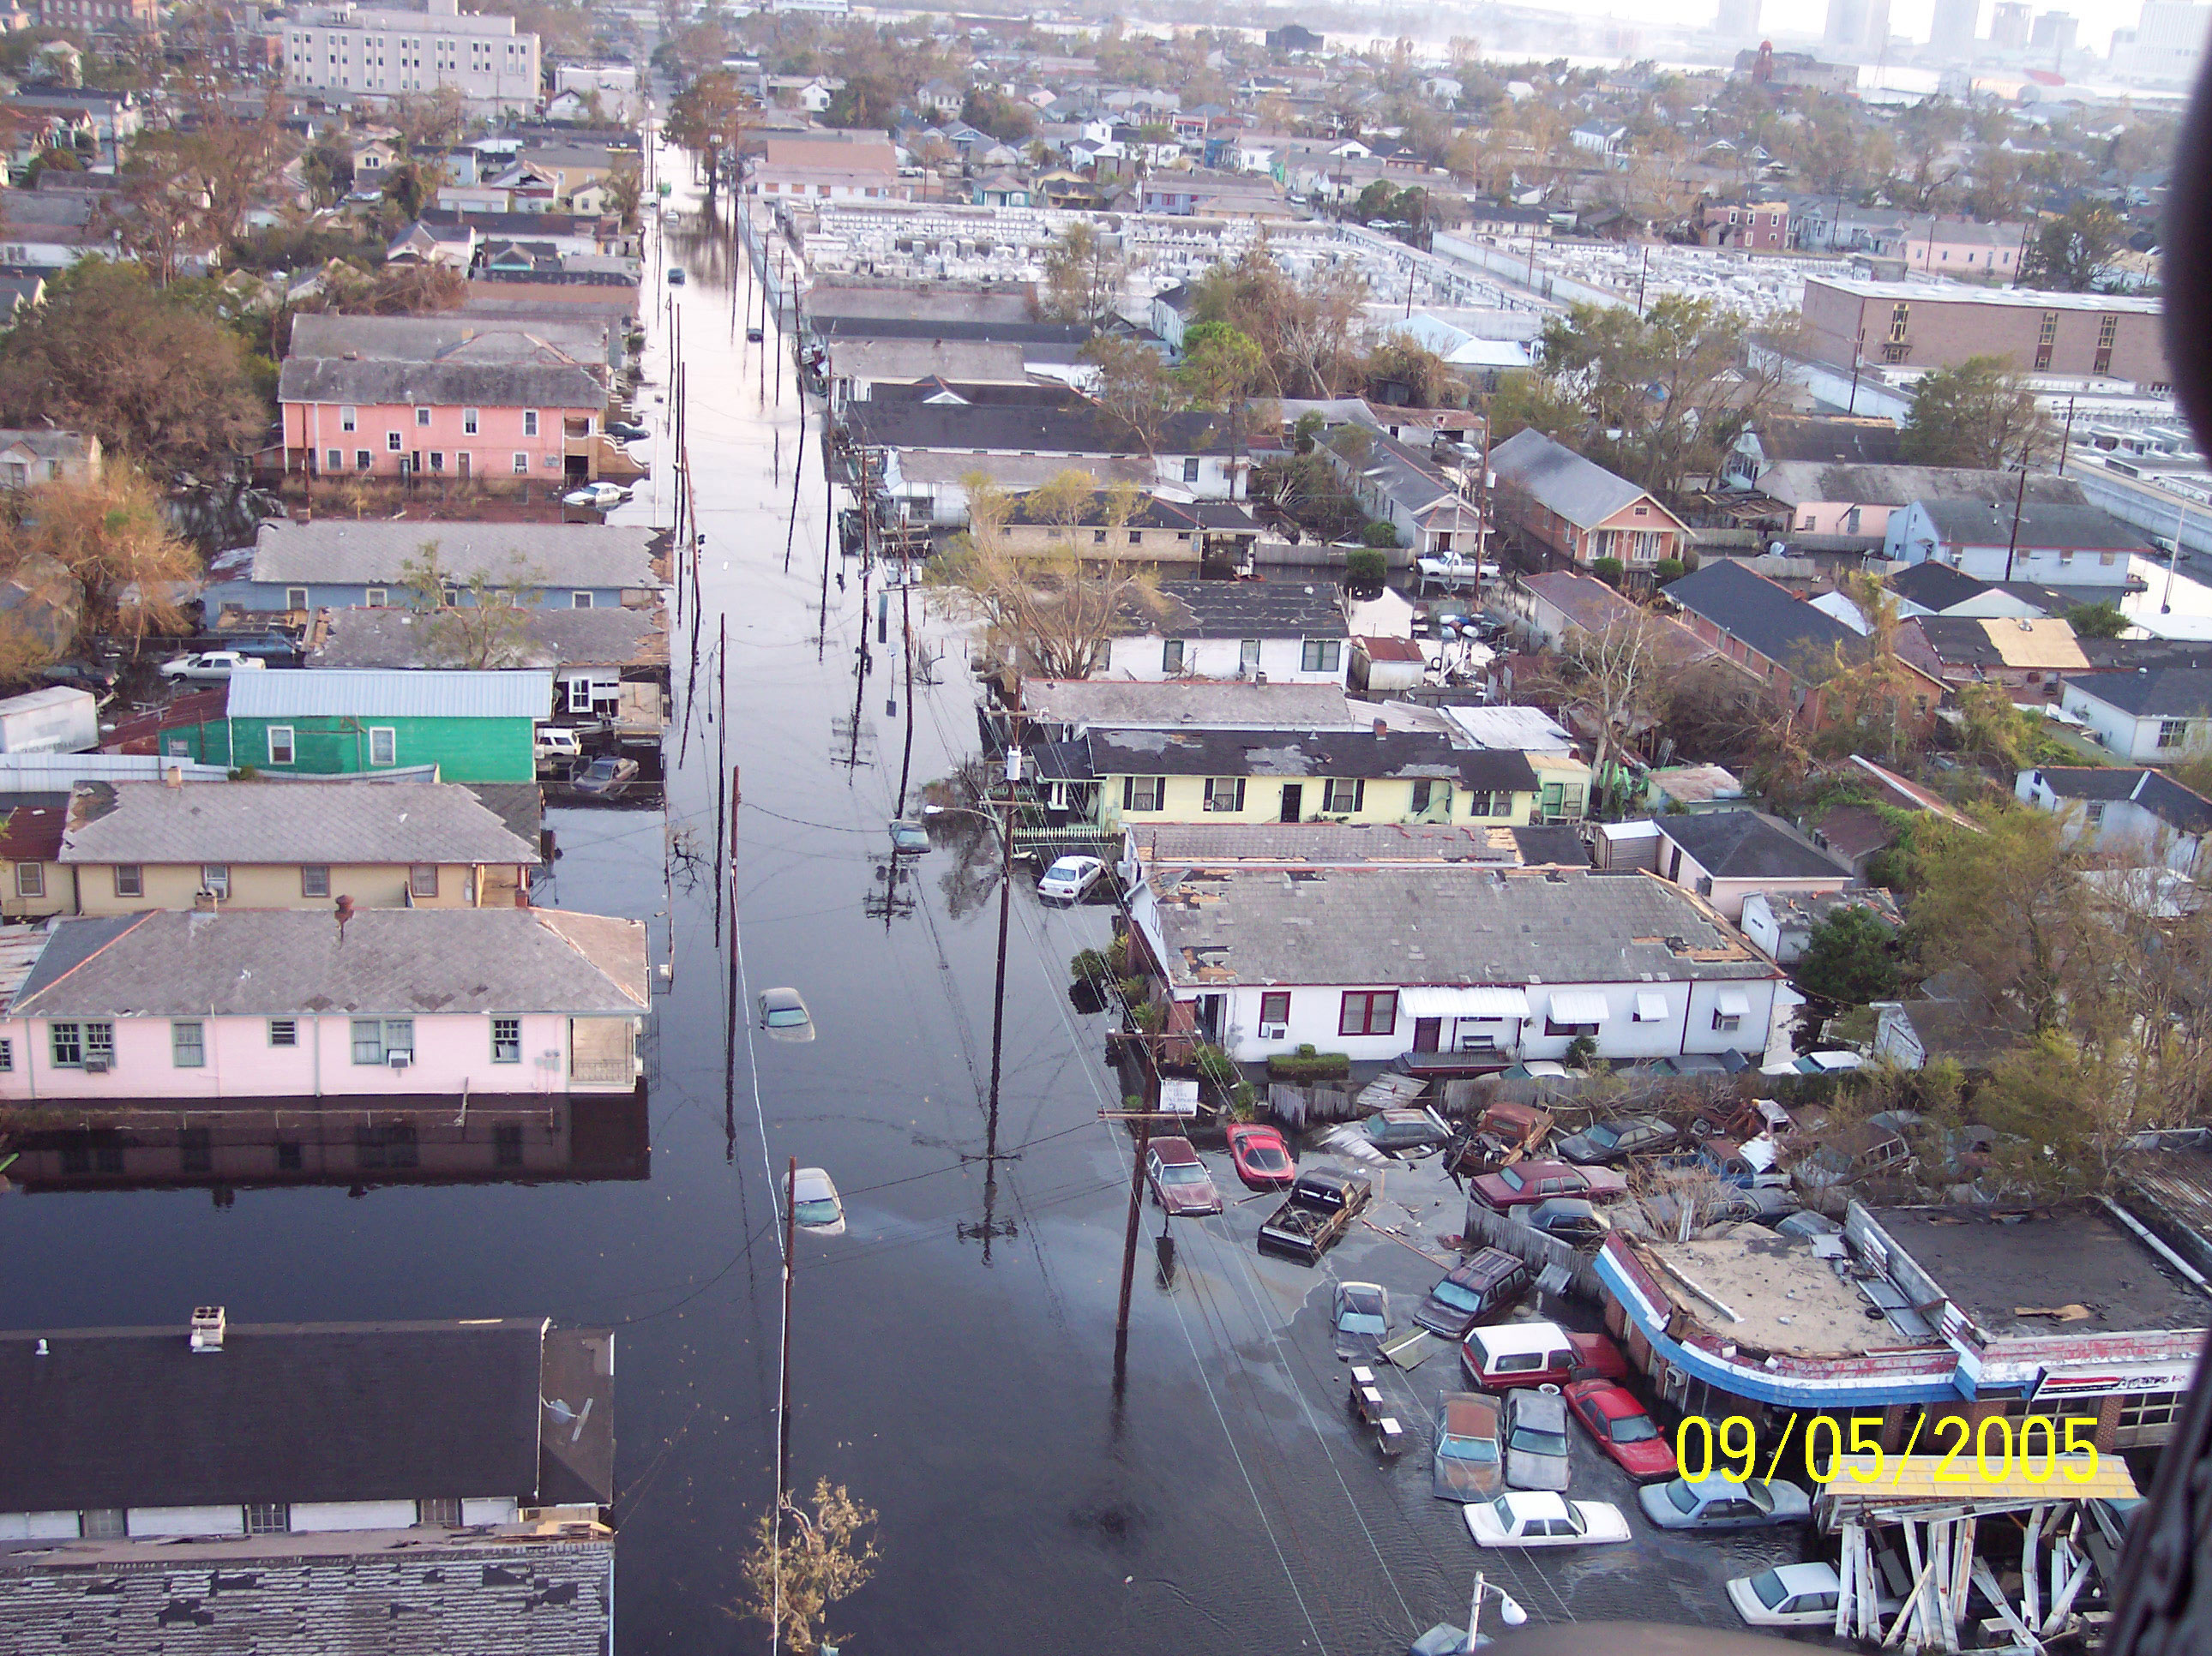
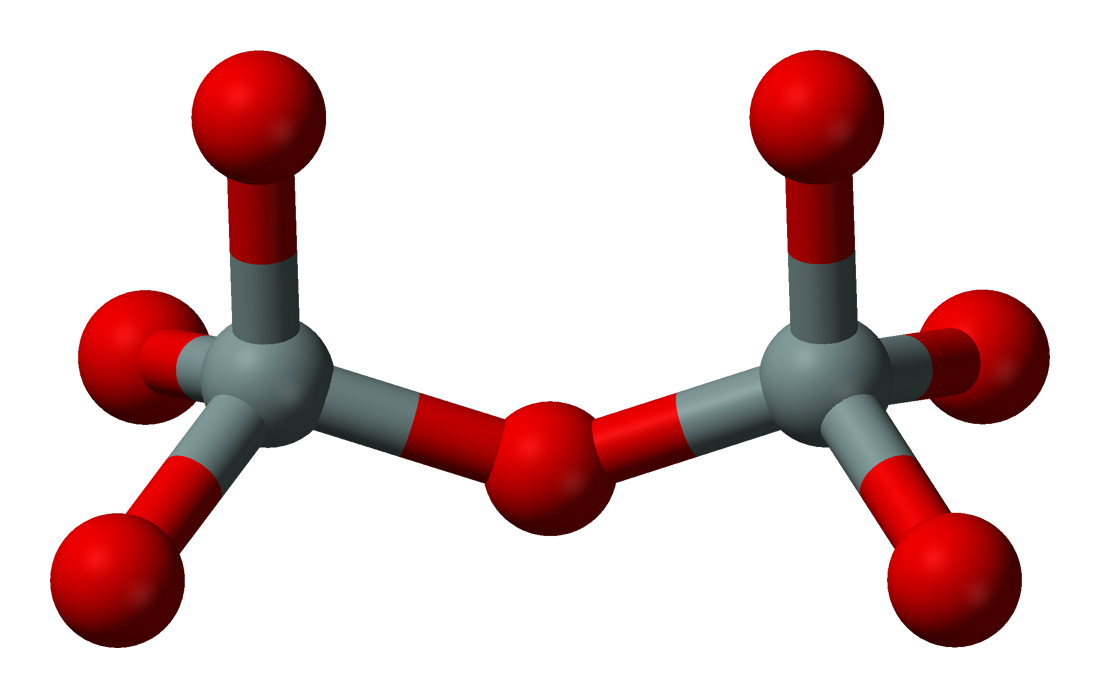
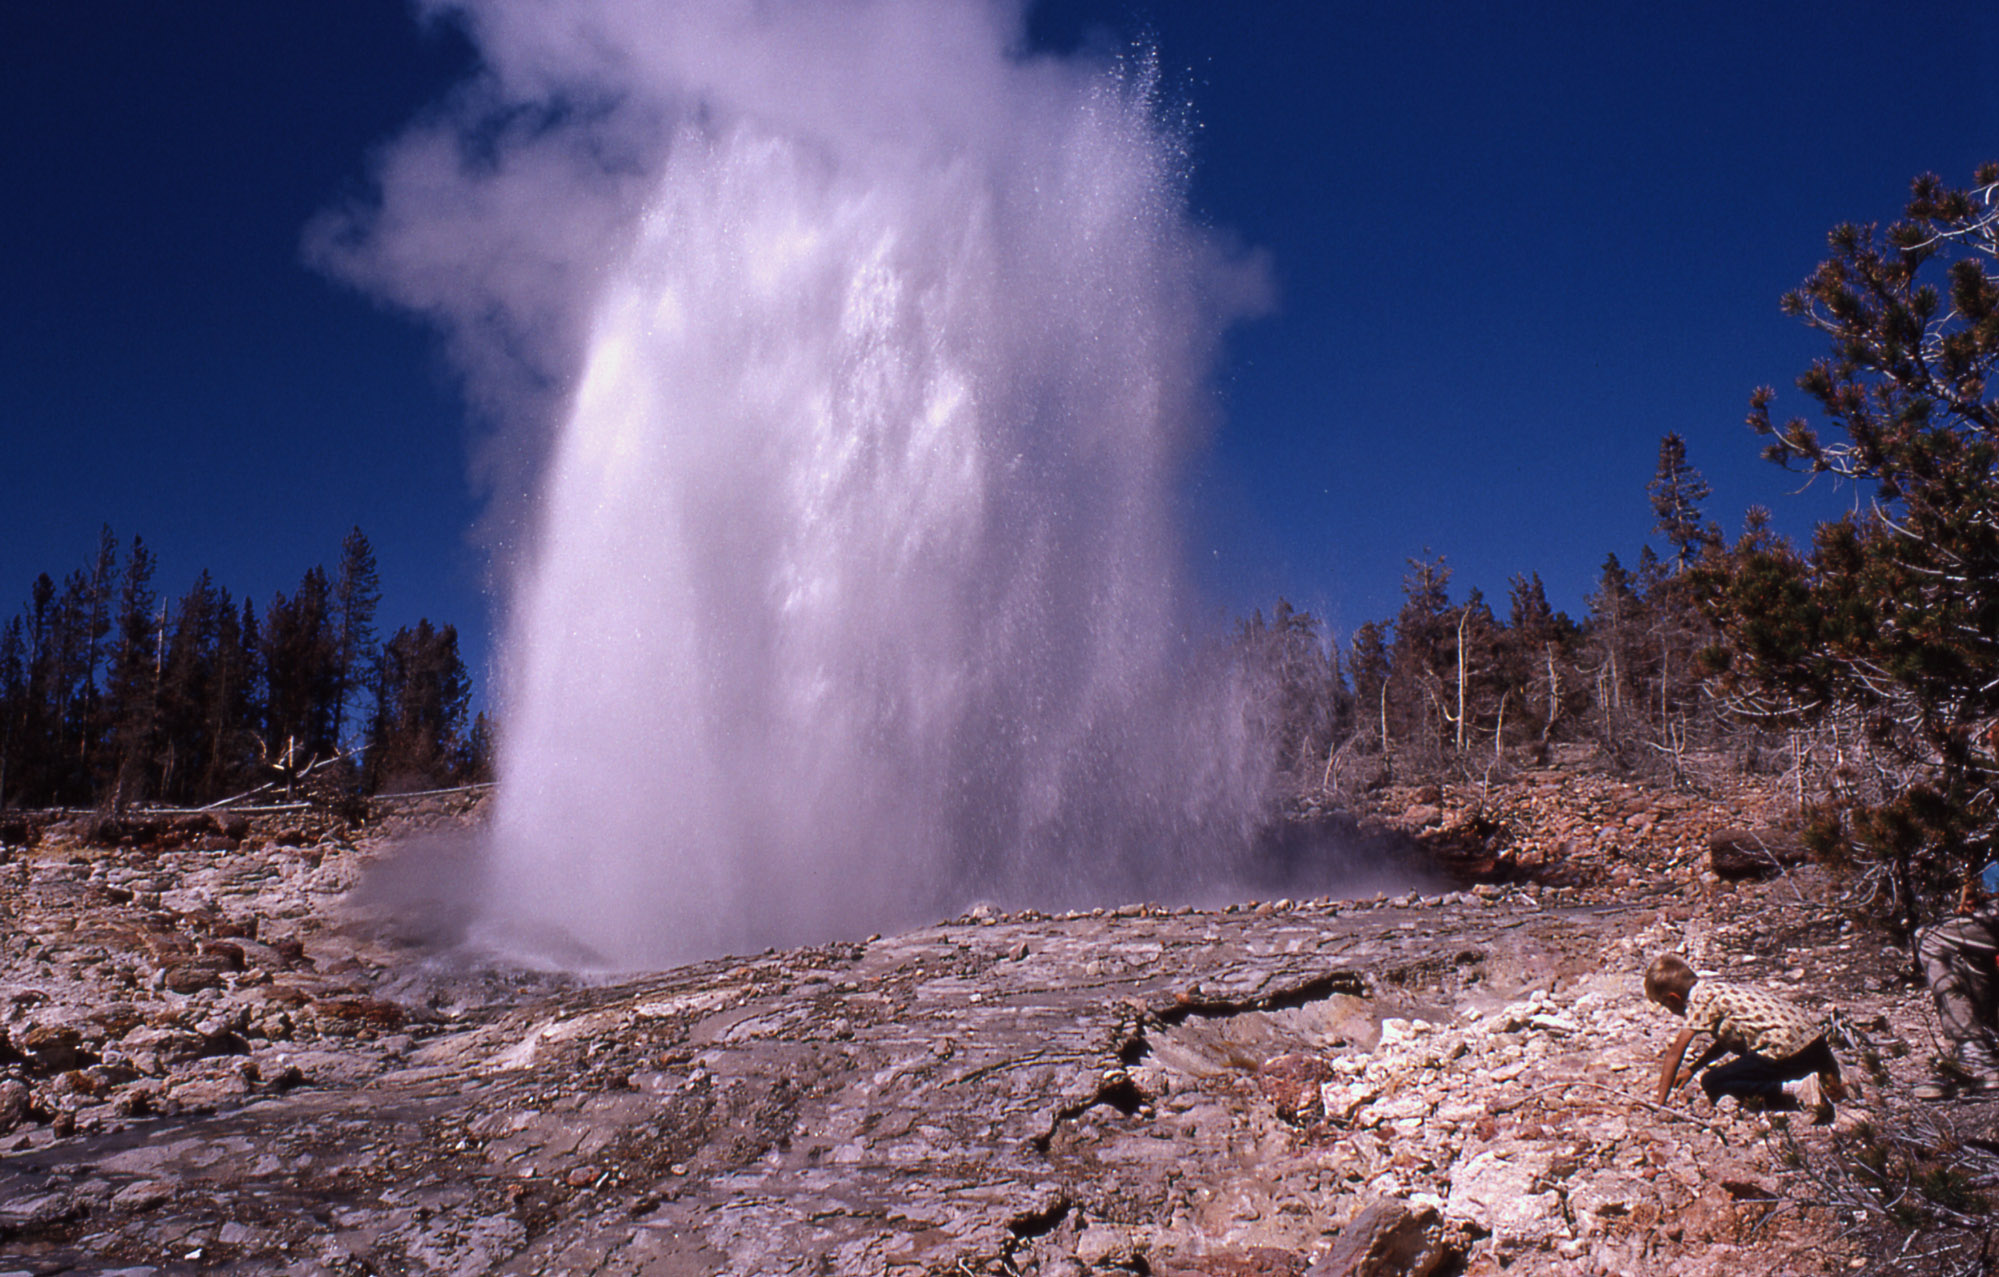
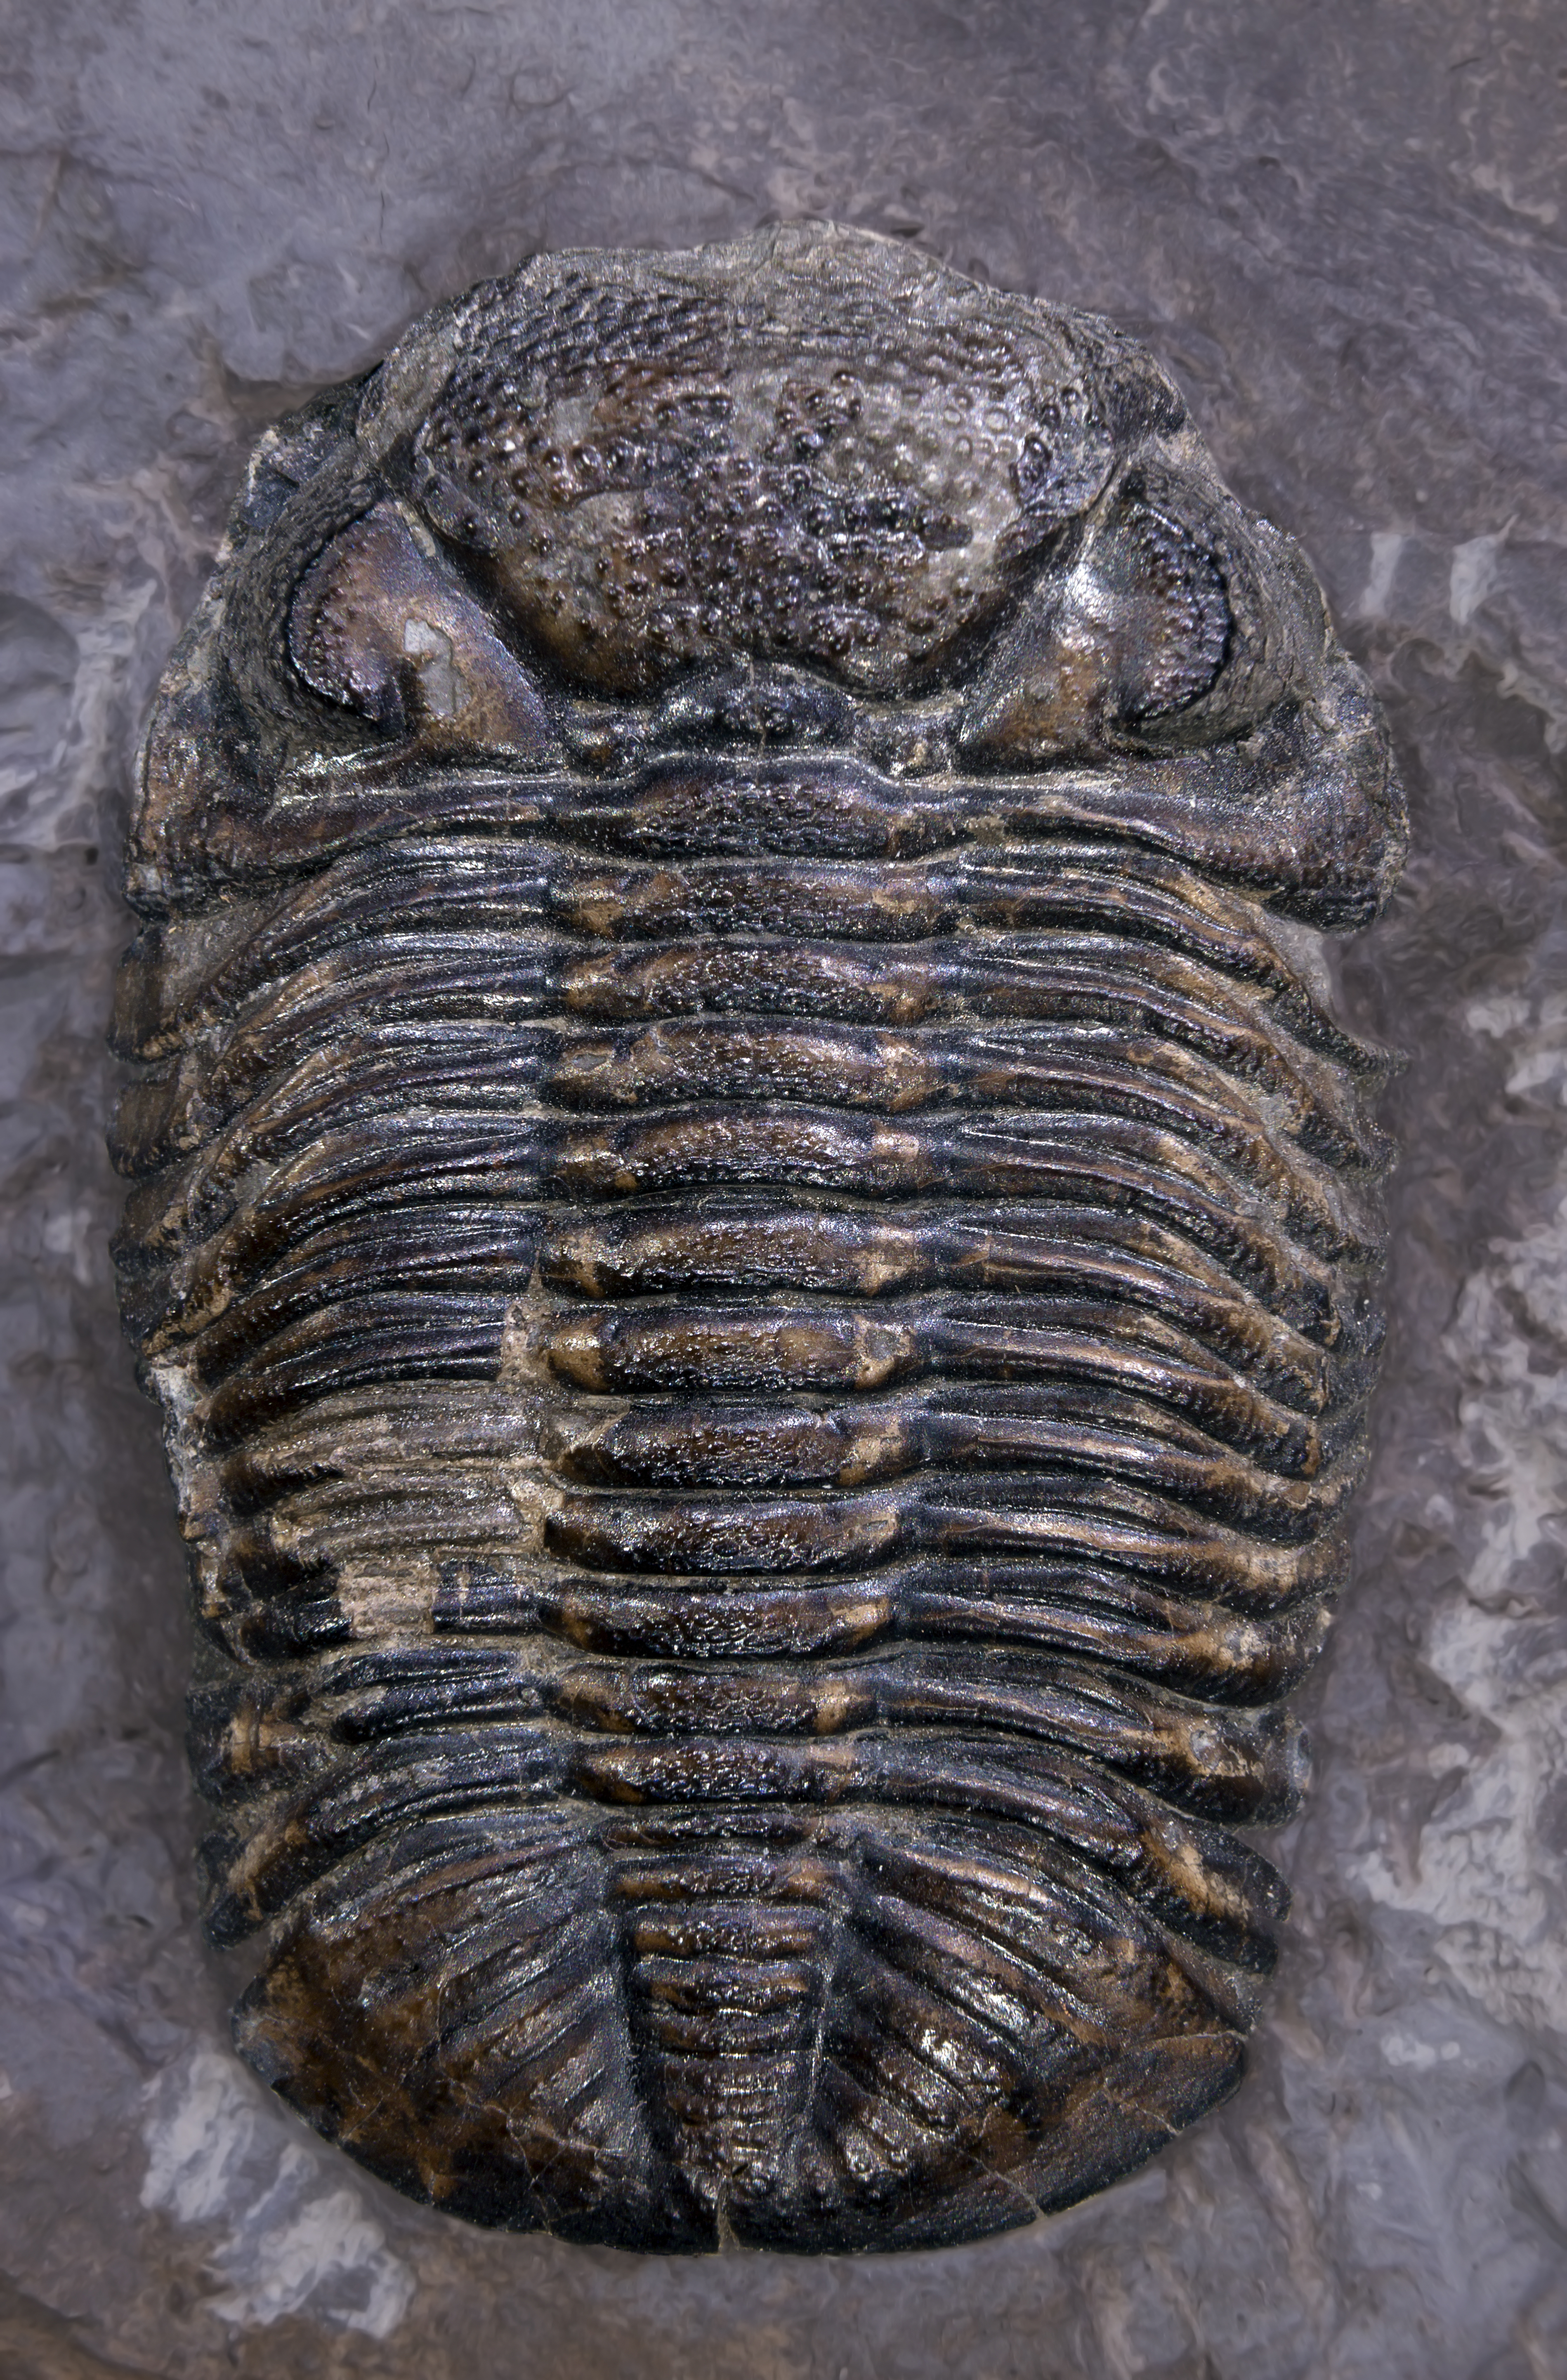
This is a geology class, and biodiversity may seem to be a bit far-afield, but there are many, many links between our class and biology, so let’s take time for a quick detour. We saw that there have been mass extinctions in the past—times when many living types became extinct in a short interval. We are making decisions now that will control whether a geologist far in the future will identify our time as another mass extinction, the end of the Cenozoic and the start of the Anthropocene.
Early humans were surprisingly hard on biodiversity. Wherever humans arrived with their efficient tool kits—in Australia, New Zealand, other islands, the Americas—extinctions of large animals followed. Direct human hunting, or competition from the rats, pigs, dogs, and others that arrived with the humans, likely contributed. The Smithsonian Museum of Natural History Hall of Deep Time shows that arrival of modern humans had smaller effects where humans and animals had long coexisted (extinction of 7% of large animal species—more than 50 kg or 110 pounds—in Africa and 18% in Eurasia), but huge impacts where animals were not already familiar with us (extinction of 74% of large animal species in North America, 82% in South America, and 97% in Australasia).
Some people don’t like the idea that early humans were hard on biodiversity. Many people, including good scientists, have argued that the extinctions of large animals in the Americas were caused by climate change, which happened to occur at about the same time as human arrivals in some places. Dr. Alley has listened to talks in which data he helped produce were used to argue that the climate changes were so large and rapid that they must have been responsible. But, the work by Dr. Alley and others showed that the animals lived through dozens of such abrupt climate changes before going extinct just after modern humans arrived. Climate change probably did reduce populations of many species, but that also occurred at each of the earlier abrupt climate changes that did not cause extinction, so a human role in the extinctions is unavoidable.
The earlier extinctions were mostly of large creatures. Since the industrial revolution, “modern” humans have contributed to the extinction of various creatures. And, the rate of extinction may pick up soon as we increasingly occupy the planet. To see why, let’s take a little detour into island biogeography.
Island Biogeography
If you were to visit a lot of different-sized islands that are more or less the same distance from the mainland, you would find that the bigger islands have more species. Roughly, an island with ten times the area of another will have twice as many species. If you visited islands of about the same size at different distances from the mainland, you would find that those closer to the mainland have more species.
At least some of what controls these observations is not too difficult to understand. If you have a small island, it can hold only a few individuals of a species. From year to year, populations go up and down depending on food supply, predators, and other things. With a small population, a small drop can hit the absorbing boundary of zero individuals and cause extinction, but a large population can survive a small drop. So, extinction is more likely on a smaller island, causing smaller islands to have fewer species. The mainland is there to supply new individuals to islands to replace those that die, swimming across or floating across on logs or in other ways, and repopulation is easier for islands closer to the mainland, so those islands closer to the mainland have more species.
These patterns of island biogeography are well-established. Studies of the repopulation of islands sterilized by volcanic explosions, and even of very, very tiny islands that were deliberately depopulated and then allowed to come “back to life,” have shown that this is the way the world works naturally.
Now, think about Yellowstone. Originally, the boundaries drawn for the park separated wilderness inside from wilderness outside. Today, as shown in the satellite photo, some of the park boundaries are easy to see from space because loggers outside the park work right up to the boundaries. Yellowstone remains connected to other wilderness regions in other directions; it is not an island (yet), and indeed, some of the logging shown here is being replaced by regrowth of trees that have not yet been logged again.
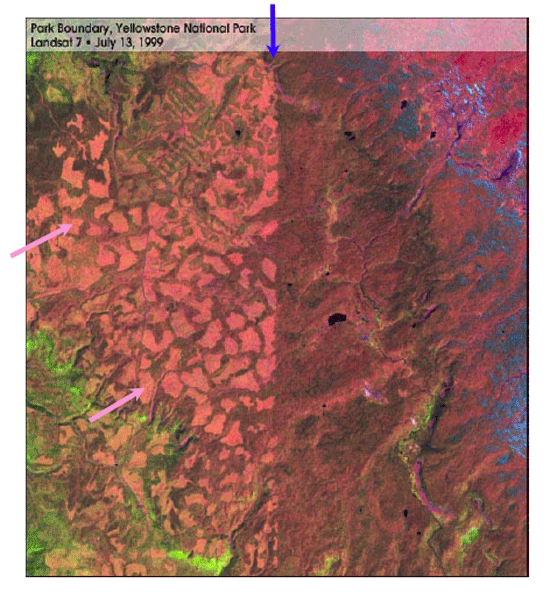
But what if Yellowstone were an “island,” as some other parks are or soon may be? Suppose a park becomes surrounded by farmland, which is used to feed humans and keep us alive. Farmland does not support a lot of wild orchids or other rare species. Farmland is impoverished in biodiversity, with just a few species, carefully selected to feed us. A park surrounded by farmland is in some ways an island, because many species have great difficulty crossing the farmland just as many species have difficulty crossing the ocean. And, from the well-established principles of island biogeography, the isolation of a parkland from other wilderness will cause extinctions in the park. Perhaps more worrisome, if the only remaining wilderness is in parks, there is no longer a “mainland” to replace species lost to local extinction on the island—extinction in the park is then extinction from the world, as shown in the video below.
We know that as the climate changed in the past, plants and animals migrated long distances to stay with their preferred climate. As the climate changes in the future, migration will be required but may be impossible if the parks become isolated.
We can use a cartoon terrarium to illustrate some of the basics of island biogeography, and how isolating Yellowstone and Glacier from each other could cause extinctions in both. Have a look at this short video.
Video: Small-Scale Biodiversity (1:51)
Here we have two identical terrariums, and in each of these terrariums we are growing the rare and beautiful Geosciences 10 daisies that are so endangered. This is a great project, and lots of people come to look at them. There’s one difference between the two terrariums: the upper one is divided in half by an unbreachable purple glass wall, and the bottom one is not. Now, what's going to happen?
As you might imagine, things are not perfect in terrarium land, and a blight comes and kills off one of your Geosciences 10 daisies in each of the terrariums. If you watch the lower terrarium, you're not too worried, because seeds from the remaining daisy can grow a new one to replace the dead one.
Now, after the new daisy grows in the lower terrarium, oh my goodness, another disease comes, and it wipes out one of the daisies in each of the terrariums. And if you're down below, you're still not worried, because seeds from the remaining daisy can plant a new one. But if you're up above, you're really worried, because the Geosciences 10 daisy is extinct.
Next, suppose that instead of terrariums with Geosciences 10 daisies, we are worried about the biodiversity of Glacier National Park, here on a map, and Yellowstone National Park, farther south. For now, Glacier and Yellowstone are connected by corridors that are essentially wilderness running down the Rocky Mountains.
What is going to happen if we lose those corridors of wilderness that connect the two parks and turn them into islands? The simple answer is, you don't lose all the biodiversity, but you probably do lose some of the species that live in both of the parks. Just as for the terrariums, you get extinction.
Let's take a look at some charismatic macro fauna
So, Who Cares?
One can ask whether biodiversity is worth preserving. This is proving to be a difficult topic and one that will be discussed much in the future.
To start, we can easily list many reasons why biodiversity is good and should be preserved.
- Many of our medicines have come from plants, and if many plants become extinct before we can study them carefully, we are likely to lose many possible medicines.
- Engineers and designers are increasingly using “biomimetic” techniques—mimicking nature. Evolution has worked over vast times to select the most successful biological patterns, and we can learn from them, if they are here to be learned from.
- More diverse ecosystems seem to be a little more productive and more reliable (if you have hot-loving and cold-loving and wet-loving and dry-loving types in a region, then something will grow well no matter what weather arrives; if you have only one type, and the weather is bad, so is the crop), so if producing more is good, biodiversity seems good.
- Living things have frequently served as “canaries in coal mines”. Miners would take a canary along in the mine, not only for companionship, but because the birds were more sensitive to bad air than were people, and a sick or dead bird would warn miners to get out before the miners became sick or dead. Birds of prey served that function for us with DDT. This chemical was being used to kill pests, increase crops, and wipe out diseases—until the falcons, hawks, eagles, and other predatory birds started disappearing. A little DDT on a plant led to more DDT in an insect that ate lots of plants, and still more DDT in a bird that ate a lot of those insects, and became so concentrated in a falcon that ate the birds that the falcon’s eggs broke and young ones couldn’t be raised. It became clear that such “bioconcentration” threatened humans as well—the other living things gave us a warning. Loss of biodiversity means loss of warning sensors.
- Many people like diversity, and pay a lot to go see it in different countries and in zoos, supporting an important industry.
- And, for many people, this is an important moral or religious issue—do we really have the right to terminate the existence of other living things, that some people believe were put here by a deity that likes those things?
Some planners today are trying to establish corridors connecting wilderness areas, so that the parks do not become islands and lose species. How successful this plan will be remains to be seen. The “simple” answer is that to maintain many species on Earth, we have to maintain much wilderness. And that in turn has implications for how we humans choose to behave. The 30 by 30 initiative has been adopted by the US Government as of 2021, seeking to protect 30% of land and of sea habitat by the year 2030.
Reference
Optional Enrichment #1: The So-Called Greenhouse Effect
Optional Enrichment #1: The So-Called Greenhouse Effect
As an aside, some of our friends over in meteorology are not happy that the effect of CO2 on climate is called the “greenhouse effect.” They fully understand that CO2 does warm the planet, and they know that the glass of a greenhouse affects radiation in much the same way that CO2 in the atmosphere does—the shortwave radiation from the sun comes through glass or CO2 more easily than the longwave radiation from the Earth goes out through glass or CO2. But, the meteorologists note that this effect of glass on radiation is not the only reason why a greenhouse is warm, nor is this the major reason. Greenhouses also are warmer than their surroundings because the glass blocks the convection currents (air rising after it is heated a little) that take much of the sun’s heat away from the ground outside of greenhouses. Some meteorologists have even suggested renaming the atmospheric phenomenon to avoid possible confusion. But, the “greenhouse effect” is catchier than “the effect that warms the Earth through modulation of radiation balance, akin to the radiative effect that contributes to but does not dominate daytime warming of greenhouses.” Notice that this little discussion about terminology in no way affects the reality that more CO2 in the atmosphere warms the planet—nature works, regardless of what words we use to describe it.
How Much CO2 to Warm?
Many different models have been constructed of the Earth’s climate system, ranging from attempts by large teams to include essentially all Earth-system processes into models that tax the world’s largest computers, to small-group or individual-scientist efforts to build fast and flexible models that allow exploration of uncertainties in many parameters. Across a range of models, the equilibrium surface warming from a doubling of CO2 is often stated to be between about 2oC and 4.5oC, with a central value near 3oC (and with the most recent results pointing to a bit above 3oC). Comparisons to the past, for both the last century and for much longer times, largely exclude the low end of that range—models that change global average temperature less than 2oC or just slightly more than that for a doubling of CO2 are not able to accurately simulate the changes of the past, whereas models with larger temperature change in response to CO2 do better in simulating past changes. Based on the paleoclimatic record, warming of near 3oC or more for a doubling of CO2 seems reasonable, and values above 4.5oC cannot be totally excluded.
Note that this distribution of warming includes a central estimate, and the possibility of somewhat less, somewhat more, or even more than that, but not even less. In the physics, this arises in part because the feedbacks (discussed more just below) act on each other. Raising atmospheric CO2 causes warming. That in turn causes more water vapor to evaporate, which causes more warming. And, it causes snow and ice to melt, causing more sunshine to be absorbed, which causes more warming. And, the warming from more water vapor causes some snow and ice to melt, and the warming from less snow and ice causes more water vapor to evaporate, causing still more warming. This does not “run away”—we are not yet close to turning the Earth into Venus, hot enough to melt the metal lead at the surface. But, we cannot avoid the warming from CO2, and the interactions mean that if our models have slightly underestimated the effects of the feedbacks, the models will have notably underestimated the total warming.
Note also that many of the damages have a similar distribution—for some specified warming, the expected sea-level rise has a central estimate, and could be a little less, a little more, or a lot more. And economics gives a similar answer—for some specified sea-level rise, there is some central estimate of costs, which could be somewhat less, somewhat more, or much more, but not much less (for example, economists often assume we will behave efficiently and follow the least-cost approach to solving the challenges of a rising sea, but observations of people actually responding to challenges indicate that we often are not following the most efficient path). With this same general set of uncertainties for the warming from given CO2 release, and damages from the warming, and costs of the damages, the possible costs if a lot of things go wrong could be really high.
More on Feedbacks
Recall from earlier that feedbacks are important in estimating how much warming will be caused by the CO2 we emit, and as we noted just above, feedbacks are behind the possibility of warming being much greater than generally expected. If you force a system to change by doing something to it, many other things may then change. Some of these will amplify what you just did, making the changes bigger than you could have accomplished by yourself; these are positive feedbacks. Others will oppose what you just did, making the changes smaller than what you initially forced; these are negative feedbacks.
You, for example, have all sorts of negative feedbacks built in. If you are placed in a warmer room (the forcing), your body will begin to warm up. But then a negative feedback kicks in—you start to sweat, and that cools you off. Your body temperature doesn’t change nearly as much as the temperature outside of you changed. But, if you have certain diseases, they may fool your body so that its negative feedbacks are reduced and may even become positive feedbacks. Fever is usually a good thing, helping the body fight invading germs more effectively, but people die of fever when the feedbacks become too positive and the body “burns itself up.” If you’re in a canoe with a really enthusiastic golden retriever, you may try to lean as the dog leaps about in such a way as to stabilize the canoe—you are providing a negative feedback on the tipping. But if the dog tips the canoe, and the ice chest falls to the low side, the ice chest is acting as a positive feedback to amplify the dog’s motion and tip the canoe further. If you lose your balance when the dog lunges to the side, you may suddenly fall toward the dog, providing another positive feedback and perhaps flipping the canoe.
The Earth certainly has positive and negative feedbacks. The easiest stabilizing or negative feedback is the very fast change in radiation—a warmer place glows more brightly almost instantaneously and sends more heat toward space, tending to cool the hotter places faster. Other than this almost-instantaneous change, most of the climate feedbacks over times that are most important to us (years through thousands of years) are positive, amplifying changes. Over still-longer times approaching or exceeding one million years, the feedbacks tend to be negative, stabilizing the climate. Climate changes over years or centuries thus can be almost as large as climate changes over millions or billions of years.
The most important very-long-term stabilizing feedback was discovered by Penn State’s famous professor Jim Kasting and coworkers. Recall that any chemistry lab has a Bunsen burner or a hotplate to speed up the chemical reactions so you can get done before the class period ends—chemistry almost always goes faster at higher temperature. Rock weathering involves CO2 and water reacting with rocks to make dissolved ions that wash away to be turned into shells or the inorganic equivalents, which over millions or billions of years are subducted, melted, and returned to the surface in volcanoes that release rocks and CO2 and water to complete the cycle. The rate of subduction and volcanic eruption does not depend very much on the climate at the Earth’s surface, but the rate at which weathering removes CO2 from the air goes faster when warmer. So, if the temperature goes up, removal of CO2 from the atmosphere goes faster, cooling the temperature back down. And, if the temperature goes down, the removal of CO2 slows but the volcanoes continue to supply CO2 at the same rate, so the CO2 builds up in the atmosphere and warms the climate. However, if something perturbs the climate, such as us releasing a lot of CO2, this takes more than 100,000 years to return the climate to its original state. Note also that this natural volcanic flux of CO2 is about 1% of the human supply primarily from burning fossil fuels; the ongoing rise in atmospheric CO2 is NOT caused by volcanoes!
There may be a second very slow stabilizing feedback. Warming reduces the amount of oxygen dissolved in water, which reduces the ability of animals, bacteria, etc. living in the deep ocean to “burn” dead organic material, favoring burial of those dead things to eventually form fossil fuels rather than “burning” of the dead material to release the CO2 back to the ocean-atmosphere system. Again, this is slow, and removing the CO2 we release will take well over 100,000 years.
Most of the other feedbacks that operate between these very long times and the nearly instantaneous changes in radiation with temperature are positive, amplifying the effect of the original forcing. If we put carbon dioxide into the air and warm the Earth a little, several of these positive feedbacks begin to function. Most importantly, warmer air can “hold” more water vapor (the saturation vapor pressure roughly doubles for a 10oC or 18oF warming), and water vapor is an important greenhouse gas, so warming causes more warming.
Some of the shortwave radiation from the sun that hits the Earth bounces right back to space without first warming the Earth, especially over snow and ice, which have very high albedo or reflectivity. But, warming the Earth removes some snow and ice, which then allows more of the shortwave radiation to be absorbed, which warms the Earth more—a positive feedback.
Clouds reflect some sunlight (so cloudy days are cool), but clouds also interfere with outgoing longwave radiation (so cloudy nights are warm). The largest uncertainties in predicting how much warming will result from a given amount of fossil-fuel burning are probably related to how clouds will change, and whether these changes will produce positive or negative feedbacks. However, these uncertainties are not nearly large enough to affect the conclusion that future warming from fossil-fuel burning is highly likely, and the evidence is now fairly strong that the cloud feedbacks are also positive, with various shifts in cloud types and locations that in total amplify the warming. Vegetation also may change, affecting how much water vapor it returns to the atmosphere and affecting albedo, but this does not seem to be an especially strong feedback.
Climate Models
We clearly wish to predict the future. The knowledge that burning of fossil fuels, combined with bovine belches and a few other greenhouse-gas sources, are nearly certain to cause large problems allows us to change our ways now to improve our future well-being. To predict the future, we need to do experiments. But, we have only one world. We cannot look at many different futures of one physical world, nor do we wish to wait many decades for the experiments to end. The solution we use is to build little worlds in computers, and run the experiments on those.
Note first that this sort of modeling is used everywhere all the time. In one old Calvin and Hobbes cartoon, Calvin asked his dad how load limits were determined for bridges, and his dad said that they drove heavier and heavier trucks over a bridge until it broke, then weighed that truck and rebuilt the bridge. This is of course nonsense; the strength of the bridge is calculated in a model. Your automobile and cell phone were designed on models, too. “It’s just a model” is the sort of thing said by people who aren’t paying attention, and who might be wise to start paying attention.
Anyway, geologists are important in many ways in this effort to model the climate, with two contributions especially important: finding out how the world works, and finding out what has really happened. The computer models always will be simpler than the real world, so careful choices must be made about what to put in, and things put in must be represented accurately; hence we need to know how the world works. And, once the models are built, we need to test them. You wouldn’t trust a model that had never been tested, but you wouldn’t want to wait a whole lifetime for a test. If the models can successfully simulate very different, warmer and colder climates of the past, then the models are probably pretty good. So we need to know about climates of the past, and geologists help supply those data.
The computer models of today actually are doing very well at “retrodicting” climate, predicting things that already happened. Modelers set up the configuration of ice sheets and ocean and continental positions and orbits and solar brightness, then model the climate and see if the computer results can match the climate that is recorded by the fossils and other climatic indicators in the rock record without “cheating” (so the scientists do not go in and tweak a lot of things to make the model match the data and then claim that the model is great—the models actually do work on past climates without such cheating). The models are also doing quite well at predicting the patterns of change we have observed with instruments over the most recent decades. Predictions made by modelers over the last decades are really occurring now.
Models predict that the world will warm about 3oC or just over 5oF for a doubling of the concentration of CO2 in the atmosphere. The full warming will be delayed a few decades behind the rise in CO2, because the air can’t warm all the way until the ocean and ground have warmed and some ice has melted, which takes a while. The global warming to date, somewhat over 1oC or 1.8 oF in the early 2020s, has only recently become obviously bigger than the typical temperature variability at most places, so it is only recently that the warming has become obvious to a lot of people. If we proceed to burn all the fossil fuels, though, roughtly an 8-fold increase in atmospheric CO2 above “natural” levels is possible over a century or centuries, or a warming of about 9oC or over 16oF, large enough that no one would have any doubt about the change. (Note that the land warms more than the ocean, and almost everyone lives on land, so people are experiencing a notably larger warming than this.) The recent drop in cost of renewable energy has caused most experts to conclude that it is unlikely we will burn that much fossil fuel, but there still is a large likelihood that we will push warming past 2oC unless strong actions are taken soon.
Why Not Water Vapor?
Water vapor is the most important greenhouse gas in terms of the amount of outgoing infrared radiation intercepted, and thus the amount of warmth provided. But, we usually start discussions of global warming with CO2, not water vapor. Why? Simply, water vapor is almost entirely a slave to CO2. Put some more CO2 up in the atmosphere, and the atmospheric concentration of CO2 remains much higher for centuries, and somewhat higher for more than 100,000 years before chemical processes remove it. Put more water vapor up, and in just over a week, on average, that water has rained out. The burning of fossil fuels makes approximately equal numbers of water-vapor and CO2 molecules, but because the water vapor stays up less than two weeks and the CO2 perhaps 2000 years on average, our effect on the atmospheric concentration is more than 100,000 times larger for CO2 than for water vapor. We can change CO2 fairly easily (and are doing so!), but we can’t put up water vapor fast enough to make much of a difference, nor can most other natural processes affect global water-vapor loading very much. However, changes in the atmosphere’s water-vapor content are easily caused by changes in temperature.
Remember from back at the Redwoods that cooling reduces the equilibrium water-vapor pressure or “water-holding capacity of the air” (by about 7% per degree Celsius of cooling). Remember that as full-of-water air came in from the Pacific and was forced up over Redwood National Park and then Yosemite and Sequoia National Parks, the air cooled by about 0.6oC/100 m, raining on the way. The temperature at the top of the Sierra was controlled by the height of the Sierra and the temperature of the air before the rise began, and the amount of water left in the air at the top was controlled by the temperature at the top. The air then goes down over Death Valley, and the water-vapor content of the air there depends on the temperature at the top of the Sierra.
So, if the temperature is increased over the Pacific by an increase in CO2, the water-vapor content and its greenhouse effect are increased over the Pacific, going up the Sierra, going back down over Death Valley, and on to the Atlantic or Gulf of Mexico. Water vapor acts as a positive feedback—warming increases the water-vapor content of the atmosphere, causing more warming.
You can find lots of climate-change skeptics or contrarians or denialists who love to point out that water vapor is the big greenhouse gas, CO2 less so, so the scientists must be wrong to focus on the small one and not the big one. Sounds sensible, right? But, it is totally stupid or deliberately misleading, or somewhere in-between. If we pulled all the water vapor out of the air, more would evaporate in a week or so. Pull all the CO2 out of the air, and the cooling would remove a lot of water vapor, with a rather high chance that the whole Earth would freeze over into a snowball. Thus, although water vapor gives us more warmth than CO2, the CO2 is more important overall.
Why All the Noise?
Environmental problems seem to follow a fairly predictable path. First, someone has a good idea. Refrigerators and air conditioners and freezers are useful, but if you use ammonia in the pipes and you’re in the way when a pipe breaks, you might die, so chlorofluorocarbons were a great idea. Then, scientists discover an unintended consequence—the chlorofluorocarbons might break down ozone and allow harmful ultraviolet rays to give living things “super-sunburns,” causing cancer and other problems. There follows a period when the scientists work to improve their understanding.
But, there also follows a lot of yelling and not-entirely-scientific discussion. Some people fear that they are going to lose their jobs, or lose a lot of money, if the problem-causing industry is changed, and these people respond to the scientists by arguing that there is no problem, that the problem that does not exist must be caused by nature rather than humans, and that this natural problem that does not exist would cost way too much to clean up, and that the clean up would involve taking actions that we all will hate and are probably illegal and are promoted by crazy people who hate us. A very common approach is to attempt to convince the public, or policymakers, that scientists are still having a big debate, even if they are not. It is fairly easy to find a few skeptics, fund them and promote their statements, and to “cherry-pick” certain results from the scientific literature and present them out of context.
Politics often feeds into this. Usually, if a problem is identified that affects a lot of people, the government ends up dealing with the problem. You are not allowed to tear out your sewer or septic system, poop in a pot, and dump it over the fence into my yard. Nor are you allowed to smoke in many public places now, or dump your trash in my yard, and laws such as these are passed by and enforced by the government after they are demanded by many people. So, if you don’t much like government, you may think that it is unwise to have the government trying to clean up a problem. And, if you can keep the argument focused on whether or not the science is good, rather than on possible wise responses to the problem, there is little danger that the government will do anything—we usually don't do much about a problem until we agree that there is a problem.
The press makes all of this worse, attempting to maintain "balance" by presenting “both sides” of a “scientific dispute,” even if one side is being manufactured and does not have much scientific basis of its own. Recent scholarship has demonstrated clearly that a reader of the mainstream press in the U.S. would have a very skewed view of the degree of scientific agreement over global warming, for example—many press outlets present a conflict that really doesn’t exist.
But, some forward-looking people also see the problem as a possibility—a new invention may make a lot of money and help a lot of people. And, history indicates that problems usually are followed fairly quickly by new inventions, the cost of dealing with the problem typically is much less than previously stated (often about 10% of the previously stated cost, and sometimes with the cleanup cheaper than the original as well as cleaner), the cleanup becomes part of the economy, and life goes on. (Imagine life without toilets and sewers, with people dumping their poop out the windows in the morning into the street the way we used to do…) (check out this clip, Toilets and the Smart Grid, from Earth: The Operators’ Manual, https://www.youtube.com/watch?v=KJqDQ41m_KI
The twin energy problems—finding replacements for the finite fossil fuels, and doing so before the world is changed too much in bad ways—are arguably the biggest environmental problems we have ever faced, but they can be solved. Because of the huge size, the solutions will take longer, and more inventions will be required than for the ozone hole or DDT or lead in gasoline. The scholarship is clear that speeding up our solutions will make us better off.
Optional Enrichment #2: The Big Picture on Climate and Energy
Optional Enrichment #2: The Big Picture on Climate and Energy
The big picture on climate and energy is a little too big for our course—indeed, Dr. Alley has been the primary author of a different course on this topic, wrote a book on it, made a three-hour PBS miniseries, and has given more than 1000 public talks on the subject. Here, as Enrichment, we’ll give you some of the highlights, emphasizing the ability of people to solve problems, discussing how important energy is to our well-being and the great value we have gotten from fossil fuels, discussing how the CO2 from fossil-fuel burning is changing the climate, exploring some of the threats if continue with our current energy system, presenting the strong reasons why changing sooner rather than later will make us better off, looking at some of the solutions we could adopt, and saying a few words about communicating these issues. The biggest picture is that, if we seriously work to solve these problems, most people who view this material should live long enough to see us build a sustainable energy system, powering everyone essentially forever, and giving us a larger economy with more jobs, improved health and greater national security, in a cleaner and more ethical world. And that’s good news!
A few of the images are not in the public domain but are used here following many public presentations, with attribution for non-profit educational purposes under fair use. Most of the images are in the public domain, and many (including all of the penguins, which are included mostly to lighten the mood) were taken by Richard or Cindy Alley.
Video 1: The Value of Optimism on Climate and Energy (2:50 minutes)
Dr. Richard Alley, College of Earth and Mineral Sciences, Department of Geosciences: "We're going to start with a little on the value of being optimistic on climate and energy. Let's be honest in the big picture on climate and energy, uh the news is not always good. But before you start jumping to bad conclusions, uh consider this uh like many, many other people I helped the United Nations on energy and climate uh with the IPCC, the intergovernmental panel on climate change. This is us in Paris in 2007 (photo of Dr. Richard Alley and Colleagues at in Paris for the IPCC), the year the committee was awarded the Nobel Peace Prize. If you took the tens of thousands of pages of IPCC reports, and you squeeze them into 35 words."
Dr. Richard Alley: "Compared to business as usual, efficient responses on climate and energy will give a larger economy with more jobs, improved health, and greater national security in a cleaner environment, more consistent with the golden rule. This really is correct; this is what the scholarship says. The good news is if you're a young person today, you're part of the first generation in human history that can build a sustainable economic energy system that'll power everyone essentially forever. But we have to remember that we can solve problems and then go out and solve them. And we can solve problems this is a cell phone (holds up cell phone), and I have a picture here of a do-it-yourself cell phone kit. It's just a little bit of quartz or sand for the glass (circles photo of sand on screen), and it's a little bit of organic material such as oil for the plastic (circles photo of oil on screen), and it's the right rocks, the ones with the rarer elements and the Palladium and such (circles photo of rocks on screen). And that's all it is, is sand, oil, and rocks. And science, and engineering, and design, and marketing, and banking. There's a GPS in here that knows where you are. It has relativity special and general relativity from Einstein. If it didn't have those it would begin to get lost in 2 minutes. It has quantum mechanics in the computer. If we can do this, we can surely do energy. So, in this set of short videos, we'll discuss the big picture, the nature of the problems, and some of the possible solutions. Let's go see."
Video 2: The Value of Energy (13:58 minutes)
Dr. Richard Alley, College of Earth and Mineral Sciences, Department of Geosciences: "Here's a little bit about the value of energy. Dealing with climate and energy is hard because energy use is so valuable to us, and right now most of our energy is from fossil fuels. Here's a little bit of history and what's going on."
Dr. Richard Alley: "A human diet:, what we get from our food that allows us to do things: To run, and jump, and hoe, and what have you. We eat about 2,000 calories per day. If you burned your food over 24 hours, the energy coming off is just 100 Watts. It's one, old light bulb. A Tour de France rider can do a few hundred Watts, but they're eating 10,000 calories a day. What we can do is not that much. What is done for us though? We don't have to light our light bulbs. We don't have to cool and heat our rooms by generating the energy from our food. We have air conditioners, and we have tractors, and trucks, and all this wonderful stuff that's done for us. In the United States, what is done for us from outside is 100 times more than what we could do for ourselves. Averaged over the world, it's about 25 times. We really love this, our well-being depends on it. And it is still more than 80% fossil fuels in the US, and in the world. That's why this is hard."
Dr. Richard Alley: "You can tell the history of humanity from so many different ways. And from the common workers, and from the leaders, from our art, from our religion. You could tell the history from our use of energy. Ever since the discovery of the control of fire, we have this long history of energy crisis. We find something to burn to get energy from to do our work for us, we burn through it much faster than nature makes more, we suffer very large unintended consequences, we get sick and other sorts of things, then it becomes scarce. We have intrusive governments, we may fight wars over it, and then we find something new to burn, and we do it over again. And here's the history from Penn State's view. If you drive into State College from the East, headed towards Penn State University, you go past the reason that Penn State is there. Because Penn State was founded by the iron masters, up the hill, from the iron furnace. And the furnace was put here because there was Red Dirt that you could get iron out of, there was limestone flux, there were trees for charcoal, and there was a stream, a spring, a water source that could drive the water wheel that supplied the blast to make the furnace hotter."
Dr. Richard Alley: "This tremendous picture (Figure 11: Civil Engineering Students Taking Velocity Measurement on Thompson Run) is early on when Penn State had been founded, which has students in civil engineering in their ties and their hats, gauging the outflow of the spring, that is why the furnace was put right where it is, to learn how to do this important task before they became engineers."
Dr. Richard Alley: "We go back to the furnace (picture of iron furnace in State College). When the furnace was operating, it would have looked like this (image of Hopewell Furnace in Philidelphia, Pennsylvania). This one is Hopewell Furnace down towards Philadelphia, and it is turning that red dirt into the iron that was used to build the East. The water wheel is over here that would have been driven by our spring, and it's burning. And to do the burning you've got to be dumping in things to burn, and what was it burning? Charcoal. Near here we have something called Collier lake. Colliers or the Colliers (different pronunciation), were the people that turned trees into charcoal because charcoal was just able to burn hot enough to smelt the iron, whereas the trees were not. They make this giant pile of logs, then they'd cover it with dirt. This is actually a demonstration (picture from the US National Archives, reenactment of people making charcoal), these people did this job when they were young, and they were now showing in their old age, they were showing a photographer how they used to do it. You bury the trees in dirt, you burn them with reduced oxygen, drive off the water and some other things, hope that the dirt doesn't break so someone has to climb up there and fix it and try not to fall in and die, and eventually it makes the charcoal that allows you to smelt the iron. And it did this (photo of individuals reenacting logging for charcoal, showing a field of chopped down trees). An iron furnace, and the people who took care of it, think about a square mile of trees per year to make it go. If you had an open forest and you could walk for 20 minutes. and then turn and walk 20 minutes. and then come back. that would be enough trees for one year. And then it's maybe 50 years until enough trees would grow back that you could do it again. You need this huge quantity of trees."
Dr. Richard Alley: "Now if you go to a map of Pennsylvania today, and ask where is furnace still on the map? Every line on your left here (list/graph of Pennsylvania furnaces by hometown), is a furnace that we still remember and there are many more furnaces that are back in the woods that we've forgotten on this map. And every one of those, when it's running, is a square mile of trees per year. They made something called pig iron that then was shipped to four forges, like Valley Forge, where you made valuable things from the pig iron. Every one of these on the right (circling list of forges with furnaces on Pennsylvania list/graph), is a forge another square mile of trees. And trees are being used by people who are not making iron, to make their houses, and to heat, and to cook, and so on. And what happened, this ("Penn's Woods" to "Pennsylvania Desert" Picture; indicating trees were chooped down leaving woods bare). Pennsylvania means "Penn's Woods." They said when the first European settlers arrived in Pennsylvania, a squirrel could have gone up a tree on the Atlantic Coast and stayed in trees all the way across to the Mississippi. The first Forester of the Commonwealth of Pennsylvania was someone named Rothrock, and around 1900 he wrote about the great Pennsylvania desert. Now it wasn't a desert, we still had rain, but we didn't have trees. We had cut them all down. We now have a million deer in Pennsylvania, there might have been a few left. We reimported elk because we got rid of them, we got rid of the bears, we got rid of the nittany lions. There wasn't a deer to eat, and there wasn't a tree to do it behind. We just use groundhogs for Groundhog Day. We couldn't use bears or something else large because we got rid of them."
Dr. Richard Alley: "It was not just us. If you know Cape Cod, you know so Cape Cod sort of sticks up there off the coast, and right about here on Cape Cod (Dr. Richard Alley indicates coast with his arms/hands) is where the pilgrims first met the native people in Eastham. They said it was so goodly a land and wooded to the brink of the sea. Still in the 1600s the town, of Eastham outlawed the ability of people to cut their own trees on their own property. There weren't any left. Deforestation was so extreme that they panicked, they didn't know what to do. It was the row walks the cape in the 1800s and he wrote: "Many of the people get all of their fuel from the beach. If there is a shipwreck, you can burn it. If a tree drifts over from Maine you can burn that, otherwise you can't cook dinner." Over in Manhattan still in the 1600s, the common council is passing many laws on rights to wood, fair trade in wood, they're paying inspectors to make sure you're getting what you paid for. If you don't like government, you better not get into scarcity, because we demand governments to help us at that time when we have shortages and we hit energy shortages very early."
Dr. Richard Alley: "Now, if you've ever tried to read by fire light in a dark, Pennsylvania winter before electric lights are invented, it's not very easy. You're not going to do 12 stitches to the inch on your quilt in that flickering light of a candle or a fire. So, what did you do? Poor people burned a biofuel a mixture of alcohol and turpentine, it was fairly cheap, it was good light, but it was explosive. And there's horrible stories you know the Methodist Minister and his wife go out to visit the parishioners, and the daughters try to refill the lamp, and it blows up and burns them to death. And so rich people, burn whales. The whale oil was clean, and it was bright, and you didn't have it exploding. So, you take large quantities of money, you ship it to New England, and they put sailors on ships, and they go out and kill whales. This is the history of whale oil production from the Yankee Fleet from 1800 to 1880. And at the peak, there are 10,000 sailors out of New England trying to kill whales. This is a complicated story. The fleet got crushed in the sea ice off of Alaska, the insurance went through the roof, and that could shut down some whaling, but what were they doing in the sea ice off of Alaska? They couldn't find any whales that they could kill closer. They had basically killed all the whales they could find. There were some whales that were too fast for these sailing ships, and various other people from Japan, and from Norway, and Russia, and what have you killed them with diesel and harpoon cannons. When we finally quit whaling, there was no economic resource of whales left. We had killed so many whales that there just wasn't much left in the ocean. As they got good at whaling, they drove the price down. That low spot there (pointing at dot on graph indicating $7/gallon of whale oil) was about $7 a gallon in modern equivalent. When they hit the peak of whale oil, not when it was totally gone, but when they hit the peak, it's up to about $25 a gallon. Just this huge, huge price increase, not when it's gone but when it was half gone. If you took a hundred years of Yankee whaling, all of that oil, 10,000 sailors at the peak, you put it into modern tankers, and you replace the petroleum we're using, it would last the United States 11 hours. The idea that we go back when we run out of oil and do the things we used to do, is laughably absurd. We cannot do that; we need something better."
Dr. Richard Alley: "But we do have trees, and we have whales, because we switched to burning fossil trees and fossil algae. This is not a new idea. This is an editorial cartoon (showing photo of "Grand Ball Given by the Whales in Honor of the Discovery of the Oil Wells in Pennsylvania"), it was published in the magazine Vanity Fair in the year 1861, just before the US Civil War. And you can see the title, it was the Grand Ball Given by the Whales in Honor of the Discovery of the Oil Wells in Pennsylvania. So just before the US Civil War, the oil wells of our native land, may they never secede. Oils well that ends well, we whale no more for our blubber! We saved whales with mineral oil, with petroleum. This is a piece of sheet music (photo of the American Petroleum Polka) from the year 1864. Tt's the American Petroleum Polka. We're going to dance to oil wells. It says at one point, this oil well through pure oil 100 feet high, so there comes oil. Oil was always black. It is black. It will always be black. But with her wearing her white top here (woman in photo dancing with white top), they didn't want black oil falling on it so they made it white."
Dr. Richard Alley: "When we quit burning so many of them, a lot of the trees, and a lot of the whales, grew back in a hundred years. When we quit burning fossil fuels, nature will make more in maybe a 100 million years. The rated formation is so close to zero that you can just set it to zero. We must change. We cannot decide between say renewables and fossil fuels. Either we burn and then we learn, or we learn while we burn. And we are confident, if we burn before we learn, we will change climate in ways that we really don't like."
Video 3: The Problem of Human-Caused Climate Change (12:01 minutes)
Dr. Richard Alley, College of Earth and Mineral Sciences, Department of Geosciences: "It's worth taking a little time to discuss why human-caused climate change is a problem. It is true that politicians and the public are still debating whether we humans are causing global warming, whether global warming is happening, whether it's really fossil fuel burning that's doing it. But the fossil fuel burning releasing CO2, changing the atmosphere, changing the climate, affecting us, is really undeniable fact now."
Dr. Richard Alley: "So let's take a little bit of history. We'll start over here in 1800, and run through today with a timeline, and look at a few events, some of which are connected to my cell phone and its development. So, in the year 1900, Planck introduces quantum mechanics. And you know that the computer in my cell phone is designed using the principles that come out of our understanding of quantum mechanics. In 1905, Einstein introduces the first part of relativity, special relativity. My cell phone has a GPS in it, and the GPS is using both special and general relativity because the satellites are higher in Earth's gravity well going faster than we are, and it works. You know this is a wonderful thing. In 1915, Wegener introduces his ideas on continental drift, and we geologists use our understanding of continental drift as one of many ways to help us find or deposits that go into getting the things that you use to build the cell phone. Now the cell phone has a nice person in there, there's a lady's voice that tells me where I am, and she is using filters to hear the signal from the satellite. And those filters are based on mathematical work that was done by the great French mathematician Fourier. In the year 1824, Fourier started calculating the balance of energy for the Earth, and he said the simplest model leaves us colder than we really are. But the simplest model has to be about right, so something else must be going on. And he suggested that there's something happening in the air that warms us in a way that's similar to how a glass plate on top of a sunlit box will keep that box warmer. And we now call this the greenhouse effect. So, Fourier introduces the greenhouse effect in 1824. The role of CO2 was first identified by Eunice Foote in the US, and then there's a lot more work done on this by Tyndall in the UK 1856-1859. The first calculation that's accurate of the warming of the surface that will be caused by humans burning fossil fuels, is by Arrhenius in 1896. So, climate is not some newfangled, speculative thing that's going into building the cell phone that's in your pocket, but it is really long-established science."
Dr. Richard Alley: "Arrhenius's calculation was done with classical mechanics, it was before Quantum. Our Quantum understanding is in many ways based on work that was done by the US Air Force after World War II. They wanted to do communications, and operations, and heat seeking missiles. If you're going to target the hot exhaust of an enemy bomber by looking at the infrared radiation coming from it, if you use the wrong wavelength on your sensor, CO2 absorbs the radiation, and your missile will not hit the target. And I can tell you today, wherever you are in the course of the day, there will be more infrared radiation going up from the sun-warmed Earth, than coming down from enemy bombers. And some of that radiation is absorbed in the atmosphere. Before we ever had satellites, the physicists predicted what those satellites would see when they looked down, and how it would change over time, and those predictions have been successful. So that blue line (pointing to blue line on graph showing the increase in wave number and temperature energy to space to cool Earth) is following the predicted and observed radiation going up from the sun-warmed Earth to be seen by satellite. In fact, that has changed over time as we've changed the atmosphere and the temperature of the Earth, so it's up just a little bit here's two lines on there. But maybe the most important thing here, is that that huge divot is energy that is kept in the earth system because CO2 absorbed it. And if we have more CO2, more can be absorbed. You meet the person who says oh I don't believe in this. They don't believe in the ability of the Air Force to build a heat seeking missile? This is physics, we raise CO2 in the atmosphere that has a warming influence. It's just physics. It is successfully predictive, and I'll show you just a little bit of a vast amount of data. Here's a plot starting in 1880 and coming up towards the present of different temperature records developed for the surface of the Earth, by different groups with different funding (showing temperature anomaly graph from different 5 different agencies). Including one of these groups that started from a physicist who sort of didn't believe that the other scientists had done their job right, got money including private money to demonstrate that the temperature records weren't good, and the temperature records were beautiful. This one show, (pointing to graph with arrows) that sometimes even a little more warming than the others but you can see all of the data agree with the temperature wandering up rapidly, because we're driving it up."
Dr. Richard Alley: "Now, that's thermometers. If you simply restrict yourself to thermometers that are far from cities, they also show the warming. Thermometers placed in the ground, show that the ground is warming. Thermometers placed in ocean water, show that the ocean is warming. Thermometers taken up on balloons, show that there's warming above the surface. Thermometers looking down on satellites, show the warming. If you look at temperature sensitive snow and ice, not South Pole. I've been to South Pole it's minus 50 if it warms up to minus 40, it won't melt yet. But if you look at the temperature sensitive ice: springtime snow, lake ice, river ice, sea ice, temporary frozen ground, um perm frost (permanently frozen ground which is now not frozen), and places the mountain glaciers, the edges of ice sheets, all of these are being lost with warming. If you ask plants and animals where they're living and when they do things, the vast majority of the shifts are in the direction you expect from warming. So as early as the 2007 UN report, warming in the climate system is unequivocal."
Dr. Richard Alley: "Now how do we know that the warming that must happen from the CO2 is what is driving the warming here? Well we've looked very hard for other causes, and no the sun has not brightened over the time we're looking at it wiggles a little. Nothing else is going on to drive this, and the CO2 predicts it beautifully. So this plot which comes from the director of the NASA Goddard Institute for Space Studies (showing graph of forecast evaluations for models run in 2004), has on it both data and model output, and it's it starts over here on the left where the models have been told about things like the particles from volcanoes blocking the Sun, and making that little cold divot there (showing dip in graph between 1990-2000), that was Mount Pinatubo. And then it runs into the future, we don't know when the volcanoes will erupt, so there's nothing put on there but there haven't been any really big volcanoes in this interval. So that there's not a huge volcanic influence. What the models say is that our CO2, the other changes we're making but mostly CO2, will drive warming. Every model run has in it some variability from things like El Ninos, but more than a few years in the future you can't predict El Ninos exactly, it's like predicting the weather exactly. And so what's happened in this plot (indicating Forecast graph on screen), is the models have been averaged to give the black line (on graph), and what you should expect is the black line plus a little bit of wiggling from El Ninos. What then happened after this was predicted, is just what was predicted. This is successfully predictive for the warming, for the pattern of the warming. The stratosphere cooling as CO2 holds heat down here, more warming at the Arctic, more warming on and then the ocean, and other sorts of things. The pattern the amount of warming is indeed being successfully predicted and we know this."
Dr. Richard Alley: "Now this is a particularly interesting one. It starts um further back in time, it goes further into the future than we've gone. On here our projections and predictions and actual data, and this happens to be scientists who we're working with, or for funded by, oil companies. So, each of the gray lines (on graph) starts at some time well in the past. That one was way back, others are a little closer to today, and each one of them is one of these. This is what we'll get if we keep burning fossil fuels into the future for an oil company, and then the red (line on graph) is what happened. This works. It really, really, really does work. The science is solid, we are driving this."
Dr. Richard Alley: "The warming effect of our CO2 is not the least bit surprising, but what is surprising Arrhenius said I don't think we'll burn that much fossil fuel. That was what's really surprising is how good fossil fuel companies have been at getting us what we burn. There's a comparison here. You know what trash looks like, you've taken out the trash for your parents maybe, or done it for yourself, or try to get kids to do it for you. In the US, we throw away at the curb for the trash collector a half a ton of trash per person, per year. And the US averaged over sort of the early part of the 21st century was about 16 tons of CO2 per person, per year. That's dropped a little maybe even a shade below 15 now, but it's still 15 tons per person per year and it is changing the climate."
Video 4: The Dangers of Not Changing our Energy Systems (6:39 minutes)
Dr. Richard Alley, College of Earth and Mineral Sciences, Department of Geosciences: "There really are dangers if we don't change our Energy System soon. We could exhaust the fossil fuels and go look for alternatives, but remember the prices went way up at peak whale oil, not when the whales were nearly gone. If we let scarcity arrive with fossil fuels before we find alternatives, there will be big problems. Scarcity in the past has contributed to wars, and conflict, and government interventions, and other things that we really don't like. And if we burn before we learn, climate change will make life much harder for people. And many people are already suffering from this and many more will."
Dr. Richard Alley: So I will come back to the good news of what happens if we restrain CO2 efficiently and make a good change to a better system, but if we don't there's a lot of problems that can come. The coming changes in climate and what that does to us will be bigger than the ones we've lived through already. The past changes had some winners and some losers, we had adaptive capacity to handle them. As we move outside of that it will be mostly people who are hurt by the change not helping people. The cost goes up faster than the temperature does. Each degree costs l lot more than the previous one so it's super linear. And the uncertainties are mostly on the bad side, it could be a little better a little worse or a lot worse but not a lot better. So, we'll walk through a few of these. Maybe the biggest one is going to beat heat stress on people, and crops, and animals. People are dying of heat already, but there's nowhere on Earth that has to be fatal if you're careful from the heat outside. That if you're sitting there, naked, in the shade, in the wind, drinking water, that you're going to die because your body can't lose heat. Younger people who are listening to this, could live to see the day when we make places on the Earth that are fatal for unprotected humans. You can't go out there for long because you will die. Long before that, people don't want to live there. We're going to be driving people to move. It's very difficult to get everyone on Earth an air conditioner right away, and so there's huge dangers could come from this to our animals, to our crops, to us. We'll talk about sea level rise, we are driving that, More floods, and more droughts. We'll get that. More energy for the strongest storms, loss of some protections against some diseases that can spread, stress on living things, and it especially hits poor people in hot places. So that's what we're worried about. Let's look at a couple pieces of that."
Dr. Richard Alley: "This is a picture stolen from The Voice of America from the civil war in Syria, a drought hit (referring to photo on screen). The drought did not cause the war that killed a half a million people, other neighboring areas also had droughts, and they didn't start fighting a war. The drought clearly contributed to stress on the people living there, and the least happy country broke and went into war. We loaded the dice to come up drought. We made that drought two or three times more likely. The drought contributed to stresses, which contributed to a horrible war."
Dr. Richard Alley: "This is the future by the time today's students are old, if we do not change our energy system (graph on screen of high drought rates globally). It's a projection for medium, sort of somewhat, high release of CO2 but not the highest. Green is less drought, but no you are not farming in the Sahara, it's still the Sahara. Every other color on here is more drought, and as it goes towards reds, and purples, it's a lot more drought. And in places where drought is already implicated in causing bad outcomes, lots, and lots, and lots, more drought."
Dr. Richard Alley: "This is a NASA history and projection, beautiful little image that NASA put together (Drought history and future under strong warning photo). This is going to start in the past and run through today into the future. Blue is not drought, and Brown is drought. And so here we come. We're going to zoom in. We're going to start in 1950. And we're going to run up through today, and into the future. And this is again as if we don't change our energy system (graph of US shows most are brown shaded). And no, you are not moving all the corn fields of Iowa, and Illinois, up into Alaska. They do not have the soils for that. This is a really bad thing if it happens."
Dr. Richard Alley: "Drought can contribute to fire, and this one is pointing out great increases in the weeks that we'll have good weather for really big fires if we don't change our energy system, including fires running up the Appalachians and up the Atlantic coast (showing three graphs of climate change in the US from 1971-2071). You could see spread of what has we think of as happening out west, could be coming to the east if we don't change our energy system. Now you get the fires in part because it dries out fast. Any clothes dryer or hair dryer fire has a heating element to dry it out faster, but when it rains in a warmer world, the air has more water because it's warmer, and that gives more intense rainfall. And so, this one in the upper left (showing two graphs of increase in precipitation levels from 1958-2016, and 2070-2099). is showing the changes that have happened in intense rainfall. The most intense rainfall. And in fact, every part of the US, every big region has seen an increase in the most intense rainfall. In this plot down here (2070-2099 graph) is the changes expected if we don't change our energy system, again we're expecting lots more intense rainfall. That contributes to floods. This is something that came out of out of a group called The First Street Foundation, a non-governmental organization, and this is looking with better mapping. And this increase in intensity of rainfall, at the people who think that their property is safe from flooding, but it's really not. And regions of the US have hidden flood risk. Up to 40% of the properties in some counties, people think they're safe, but they're not."
Dr. Richard Alley: "Now the sea is rising. These are the data from satellite altimetry looking at the surface of the ocean as it rises. It's not very fast yet, but it is accelerating. That already matters. This is not a canal, it's a street (photo of Fort Lauderdale Street flooded). This is not a storm, it's a high tide. They call this nuisance flooding at this point. And they call this adaptation. You don't want saltwater splashed into your front yard to kill the grass by big vehicles going through fast, so you put up a no wake zone sign in the middle of the street when the tide is high."
Dr. Richard Alley: "This one, I've stolen some of these pictures under fair use, this one is from the Miami Herald. This is not a storm, again, the octopus was not thrown here by hockey fans, it swam in on a high tide (showing photo of octopus in parking deck after nuisance flooding). Having saltwater around the base of the pillars that support the building, might make you nervous, but they still call this nuisance flooding. And then at some point, the rise in sea levels starts causing big problems. The costs go up faster than the ocean, faster than the temperature, and now it's billions, and billions, and billions, of dollars to fix the water system, and to relocate roads, and other big problems that happen."
Dr. Richard Alley: "This is another of these pictures that I've taken from out there in the real world (Police officer flooded inside the Industrial Canal after Hurricane Gustav). This, I'm glad I was not this peace officer in this hurricane. This particular hurricane did not get into New Orleans. We are already committed to enough sea level rise that this wall has to be raised to keep the water from getting over, But our work here at Penn State and elsewhere on the possibility of ice sheet collapse, says that there is a possibility in the next hundred years or so, and certainly beyond that, of sea level rise that would blast out of this picture, huge rise. The projections that people are most relying on now, that come from the United Nations, do not melt most of Antarctica in the lifetime of today's students. They have 99.8% of Antarctica surviving through 2100. Except then they say well but there is a possibility that it won't, and so then sea level rise would be much more. So the uncertainties on sea level rise, it could be a little better, it could be a little worse. There's no huge good out there, but there could be a real bad."
Dr. Richard Alley: "Now, what we'll look at next, is how we use this knowledge. And how we get a response that gives us a larger economy, with more jobs, with improved health, with greater national security, in a cleaner environment that's more consistent with the golden rule, because we can do that."
Video 5: The Benefits of Changing our Energy System (6:39 minutes)
Dr. Richard Alley, College of Earth and Mineral Sciences, Department of Geosciences: "Now, we can have a look at some of the benefits of building a sustainable energy system because there really are large benefits available if we take actions now, to avoid the worst damages from a warming climate."
Dr. Richard Alley: "If we do this well, compared to business as usual, we get a larger economy. More jobs, we're healthier, our nations are more secure, the environment is cleaner and were more ethical. I'll show you one slide on each of these. This comes from the Nobel prize in economics in 2018, William Nordhaus, I actually had the honor of serving on a committee with him, an amazing person. He was awarded for building tools that provide guidance to policymakers and the general public on how to make the economy help more for more people. We have resources, we can use those resources for consumption now to help people feed them, and clothe them, and house them, and so on. We can invest broadly in the economy to make it bigger in the future to help more people. We can target those investments on particular issues, such as climate change. When these models are run, they keep saying over, and over, and over, that we're not in investing enough in slowing down climate change now to make the economy be its best. You may meet the person who says oh yeah, the climate is changing, but we can't afford to deal with it. The Nobel prize in economics says you can't afford not to deal with it."
Dr. Richard Alley: "Now a bigger economy is likely to give more jobs, and that's especially true if we shift away from fossil fuels Now, I worked for an oil company one summer, great people, many of our students have gone to work for oil companies, but it's fairly clear that any other good approach to making our energy system makes more jobs. And the reason is at least in part, that the cheapest oil in the world, which maybe from some other country, can probably be produced for about $5 a barrel. And that goes to jobs, but we may be paying $75 a barrel or some other large number, because oil is scarce. And the money is going to those people or countries that control the scarce resource, not to the workers who make that scarce resource useful. The Sun, the wind are just about everywhere, so if we switch to those, more of the money of the energy system goes to good jobs, not to controlling a scarce resource.Now if we make it too hot to live in places, that is very unhealthy. There was a recent study that found that 20% of deaths globally are linked to breathing particles that come off of burning of fossil fuels. Making more forest fires is not going to be good flooding people's houses, and then spreading diseases is not good. So, all of these medical groups in the US got together and they said, if we want to be healthy, we need to go on the inevitable transition to clean renewable energy."
Dr. Richard Alley: "Here's a picture of rear Admiral David Titley from our earthy operators manual PBS miniseries. Admiral Titley is a Penn State grad, he came back and taught at Penn State for a while, and truly amazing, brilliant wonderful person. And after his retirement he served on the CNA military Advisory board, with a large number of other military leaders. And they said, you know if we make it too hot to live in some parts of the world, this will drive climate refugees across borders. It's not good for them. It's not good for the security of the countries. If we flood our navy bases with sea level rise, that's not good for the security of our country. If we want secure nations, we need actionable agreements on ways to stabilize the climate. That's our military leaders."
Dr. Richard Alley: "We're increasingly driving climate change that forces species to move. Some of them are going up mountains and trying to track after colder conditions, and then they get shoved off the top of the mountain and they're gone. Some of them may be isolated in national parks and they need to go to a different park, but we're in the way. If we don't take actions to stabilize climate, the studies are that roughly a third of the species on Earth could be placed on the road to extinction by the time a typical college student is in the prime of their career."
Dr. Richard Alley: "And then there's the ethical thing. The top picture here (Geographic disparities and moral hazards comparing maps, pointing at CO2 map of the world), the countries in red (North America, Asia, Europe, etc.) are emitting a lot of CO2 per person, per year. The ones in blue (Africa, South America, etc.) not much down here who suffers from the warming. All future generations and poor people in hot places now. And if you notice these two plots (both maps) sort of look like they're backwards from each other. The people causing the most warming are suffering the least from it. I quoted Pope Francis here, that we can't leave this to a future generation. I could quote many other religious and ethical leaders; this does not look like the golden rule. So, if we get a handle on this, larger economy, more jobs, improved health, greater national security, cleaner environment, more consistent with the golden rule. How do we do that? Let's go take a look at a few of the many options."
Video 6: Some of the Possible Solutions (8:53 minutes)
Dr. Richard Alley, College of Earth and Mineral Sciences, Department of Geosciences: "So now, some of the possible solutions for building a sustainable energy system. The solution space is huge. And we're only going to highlight a very few things here, but I'm picking out some of those that are especially likely to help."
Dr. Richard Alley: "Start here (map of the world comparing croplands and rangelands). Everything in color on these maps, we use to get the 2,000 calories per person per day that are the human diet. On top is crop lands, on the bottom is grazing lands where animals eat grass, and we eat the animals, or we milk them. Suppose we decided to replace every bit of external energy used by every human from oil, and coal and gas, and nuclear, and everything else with a modern solar farm. And then we added a little extra to allow growth. That pink square in the Sahara (indicating on map), would be enough to replace all external human energy use. Okay now we're not going to put it all there, some of it's on the roof over my head right now, but that gives you the scale. It's a huge area. It's a huge task. But it's surely doable, and that's the really important thing, and it's small compared to what we've already done to the land."
Dr. Richard Alley: "When we made the PBS miniseries, Earth The Operators, manual we got to go talk to some Texas ranchers, they were having real economic trouble. There was danger of the town going broke, the high school being closed, people losing the ranch. They put in a wind farm, and they get what they call mailbox money. You go out to the mailbox and it's full of money. 5% of the land in and renewable energy, often pays more than 95% of the land in the old ranching. If we put a wind farm on the windy parts of the plains and deserts of the world, the places where the wind blows enough to run the turbans at least 20% of the time, that would be five times more energy than now used by all humans. So, the resource is there. The International Energy agency, they spent a lot of years sort of not being enthusiastic about renewable energy, but by 2020 they got to the point of saying hey it's the cheapest electricity in human history. Cheaper than anything else in many places. Okay? So, the cheapest electricity in human history with a resource that's far greater than what we can use at this point. But there are ways to combine this wisely. This particular experiment was done at Oregon State, it dries out there in the summer, and when they put solar cells in it held some snow underneath early in the year, it kept it a little moisture farther into the summer. They got extra hay cutting because they were also getting extra electricity from the solar cells."
Dr. Richard Alley: "This was an experiment done in Germany. They made High solar cells you could drive tractors under. They planted different crops extending outside and under, so they could compare how it worked. And this summer had a nasty drought, and in this summer, they got more food where they were also getting electricity. So, you're getting more money from the electricity, but they also got more food because of reduced evaporation in the drought. So there are ways to combine these things. Right? There are just times when it's nice to have a little shade, and because the area needed to do this is so small compared to the area we use for agriculture, you could design things that give us the best of both worlds. This particular study said, you know global energy demand would be offset by solar production if less than 1% of crop land is converted to this dual use. We grow food and we eat it. We grow food and we feed it to animals, and we eat them, or we milk them, or take their eggs. We grow food and we burn it. Some of it is ethanol in in gas tanks and we burn palm oil, and other things. Biodiesel. We use more than 1% of the crop land now for food that goes into biofuels, than we burn. We could get all of our energy from that much area. So, somebody says oh we don't have the land to do this, they're not really serious."
Dr. Richard Alley: "You go places that we irrigate. Water is evaporating from the irrigation canals, and that's food that we're not growing. If you put solar over the top of the irrigation canals, less evaporation, more water, more food, and you're getting energy from those solar cells. It's a win-win-win. This is for the US grid. This comes from Lazard, the world's largest independent Investment Bank (graph of cost of energy comparison on screen as of November 2019). They've said suppose there were no subsidies for wind and Sun, how much does electricity cost if you want to add a little to the US grid compared to other sources? And here's a blow up of this (showing from cheapest to most expensive: Utility scale solar, wind, gas peaking nuclear, coal, and gas). Cheap as is over on your left expensive is over on your right, going that way. And what you'll notice here, (circling Utility scale solar and wind) is that the renewables are the cheapest now. Gas generally costs more, coal costs a lot more, nuclear is having real troubles being competitive. Gas peaking is just you run it when you really need it. These two diamonds down here (circling gas peaking nuclear and coal) are if you have an old nuclear plant, or a coal plant, it's completely paid for. It is wired in. All the construction is done, and you're not paying it off. And that's just to operate it. Compared to building and operating new renewables this is why you're seeing coal and nuclear in looking for subsidies from state governments and elsewhere, because they're having real trouble competing with the renewables at this point. Now this would look much better for the renewables if fossil fuels were not subsidized. Because we now have authoritative statements that the fossil fuels are much more subsidized than the renewables are."
Dr. Richard Alley: "So, this is something from people working with the international monetary fund, the IMF has been updating this, and they found that now the subsidy for fossil fuels in the world is more than $7 trillion dollars a year, or more than 7% of the world economy. More or less, when we pay a dollar for fossil fuels, society pays another dollar. Some of this is direct subsidy, tax breaks and other things, mostly it's because when we burn fossil fuel, the cost of the health impacts, the cost of the change in climate, is paid by society not by the consumers of the fossil fuel. And the IMF folks found that if we eliminated this subsidy, we would cut air pollution debts, we would reduce CO2 emissions more than half, we will increase the well-being of people."
Dr. Richard Alley: "Now do not kid anyone. Building a sustainable future is going to be hard, it is going to be decades. We don't really have all of the answers. But we now know that it can be done. And if you're a young person, you're part of the first generation in history that knows that you can build a sustainable energy system, and that doing so can help the economy, and health, and security, employment, environment, ethics. I took this picture in Greenland. Can we really have a world with icebergs and rainbows? Yes, we can. And I think that is really good news."
Video 7: A Few Thoughts on Communications (7:48 minutes)
Dr. Richard Alley, College of Earth and Mineral Sciences, Department of Geosciences: "So, a few thoughts on communications. If the new energy world is so wonderful, why aren't we moving forward on it faster? It's a really valid question."
Dr. Richard Alley: "This came out in 2024 (NATO Climate Change and Security Impact Assessment), from the North Atlantic Treaty Organization, NATO, you're welcome to stop this and read the text if you'd like, but the key part is at the bottom. They found that Kremlin-backed, that is Russian actors, are pushing climate change denialism. They are actively attempting to derail climate change, mitigation policies, and renewable energy Investments. Why would they do that? Well, the world bank has been tracking these things, and they said that roughly $1.5 trillion dollars per year across the world, goes to oil producers. Not for finding, drilling, pumping, and shipping the oil, but because they control a scarce resource. The extra above what's needed to produce the oil is a trillion and a half dollars a year. The cheapest oil producers can probably make it for $5 a barrel, and they're getting something vaguely like $75 a barrel, and that might be a really strong reason why some actors, Russia, and others, could be working to block progress on this. In addition to this grossness misinformation though, they really are issues, that really do matter in the energy transition. The change won't be easy there are things we have to learn yet. There are some things that won't work beautifully initially. It took us a century to learn how to handle most of the explosions, and the leaks, and the carbon monoxide, and all these other problems that come with fossil fuels. Which are really huge and dangerous. It's likely to take us at least 30 years to replace that with something even better. And for example, even though we will get more good jobs by doing the transition right, some people will lose jobs as we switch. And either we take political actions to help them, or we will have some unhappy people, mostly concentrated in certain places."
Dr. Richard Alley: "This map (Overall employment carbon footprints, by county in the United States) was published in the proceedings in the National Academy of Sciences, and it's showing how much CO2 is produced per year by a typical job in each county in the US. So, this is tons of CO2 per year from the average job in each county. The Bluer ones, as low as 1.5 tons. The redder ones, as much as 2,000 tons. Now there is a cost to society of this, the cost to health, the cost of climate change. The paper took an estimate of what this cost is, and then applied it to the CO2 from the jobs. The lowest ones below $400 for a job for the cost of society of the warming from other things from the CO2. The highest ones almost half a million dollars. Alright? So, I hope it's evident, that relatively few jobs produce most of the CO2, but those jobs are very important in some counties. And either we do things politically to help people in the transition, or there will be very strong unhappiness in some places."
Dr. Richard Alley: "Now a few thoughts on communicating this. Please note that the color scale will be different in the next plots, they were not done by the same people. Bluer now is going to be sort of rejecting climate change, and redder is accepting. This is work done by Yale Climate Communications, they are very well respected. A note here, a map is a valid way to look at the US, but it is not the only way. So, if you go up to the dot (showing population map in the United States) that's Philadelphia up there, there are almost three times as many people in Philadelphia as are in the entire state of Wyoming. The Philly metro area, which is more or less that little blue circle up there in the right, has more people than all six states that are outlined in pink there (Alaska, Montana, Wyoming, Idaho, South Dakota, and North Dakota). More people than all six put together. But those states have 12 Senators, Philly does not. Okay, so most Americans accept climate science, you'll see that down below which is the people part (on map). But we'll see that people in most of America, are not as sure about climate science. And so, a map based on area, and not people, can give you a very odd view of the country."
Dr. Richard Alley: "So, this one, to ask, is global warming happening (Another map of the US, circling a county in Utah). There's a couple of counties that said no, but most places said yes, and most people certainly said yes. Is it caused mostly by humans? Most people still say yes, but now huge chunks of the country are saying no."
Dr. Richard Alley: "Do scientists agree? You learned about this from scientists, yet a lot of places think that scientists don't agree, most people still say they do. Somebody probably paid a lot of money, and a lot of effort to confuse the public about this one. Are you worried about it? The worries are actually somewhat higher, that probably reflects reality. Should we look for solutions, should we help find solutions? The moment we move from problem space to solution space, it's a very different view. When you get a job, the boss does not say bring me your problem. The boss says bring me your solution. And that's what America is saying, bring your solution. But are you talking about it with your neighbors? There are one or two counties that more than half of the people are, but that's just about it. We're not talking about it anywhere. This is, you might say this is the Uncle Ed effect. You sit down to Thanksgiving dinner, you say how about that global warming, Uncle Ed says oh it's an evil plot to take away my pickup truck, you say it's okay Uncle Ed, just calm down and pass the potatoes, and how about the Steelers. Right?"
Dr. Richard Alley: "So many people believe that we can successfully solve problems that they deny exist, and you just saw it there. Very few are talking about it. Personally, I think there's a real lesson here, and that communicating on solutions finding the good, as well as the bad, is really important. Because if we do that, we can build a sustainable energy system that will power everyone essentially forever, with a larger economy, more jobs, improved health, greater national security, in a cleaner environment, more consistent with the golden rule. And I think that's great news."
A Rocking Review
Rollin' to the Future
We really are throwing wads of money at people to get energy from oil wells that really are starting to run dry, and burning oil really does make carbon dioxide that really does have a warming influence on the climate. If we keep doing what we're doing, we have high scientific confidence that the fossil fuels will run out, but not before their CO2 and other problems damages a lot of things on the planet. The long-term solution is highly likely to involve the sun, through photovoltaics, or wind, or possibly waves and geothermal and others. Fossil fuels are just stored energy from the sun—think of them as a great battery, charged up over a few hundred million years, that we are discharging over a few hundred years, and we can already see the bulb on the flashlight starting to dim. Creedence Clearwater Revival watched the "big wheels keep on turning" in the John Fogerty song Proud Mary; in this parody, we review the ways to keep the big wheels turn without making our lives a lot harder.
PRESENTER: (SINGING) Left a bad job in the cornfield, hoeing out the weeds 12 hours a day. You may never lose one minute of sleeping, 'cause you think there are tractors and trucks on the way. The big wheels keep on turnin', but it's dead algae that they're burnin'. They're rollin', rollin', rollin' on the oil fields.
If you you turn on the light switch, you expect electrons coming your way. Lignite or bituminous or anthracite burnin', livin' on stored sunshine from a long-ago day. The big wheels keep on turnin', but it's dead trees that they're burnin' when they're rollin', rollin', rollin' on the coal fields.
If you go down to the oil fields, bet you're gonna find some wells are runnin' dry. Cleanin' up the coal mines isn't always easy. Even all those coal seams will run out by and by. The big wheels keep on turnin', but it's your paycheck that they're burnin'. They're rollin', rollin', rollin' a scarce resource.
If you look up at the sky now, then you're gonna see where all those burned things go. CO2 is rising, and it's not surprisin', temperature is climbin', and we're meltin' the snow. The big wheels keep on turnin', but the climate knows we're burnin'. Rollin', rollin', rollin' up the damage.
If you look up at the sun now, so much energy there if we can learn what to do. Many billion years of power for each and every hour, clean and fresh and odor-free, sustainable too. The big wheels can keep on turnin', when it's sunshine that they're burnin' when we're rollin', rollin', rollin' to the future. I said rollin', rollin', rollin' to the future.
Jedediah Was a Spotted Owl
Climate changes driven by fossil-fuel burning may trigger extinctions and reduce biodiversity. But, if we cut down forests and burn trees rather than burning fossil fuels, extinctions may occur that way, too. Most of the logging in the Pacific Northwest is for lumber rather than for fuel, but the trees are cut down just the same. Hoyt Axton wrote Joy to the World (Jeremiah was a Bullfrog), Three Dog Night made it famous, and countless DJs have used it to get the wedding party lurching about the dance floor at the reception. In this parody, we visit the raptor center at Penn State's Shaver's Creek Environmental Center, to discuss the impacts of deforestation on spotted owls, and the general issues of biodiversity.
DR. RICHARD B. ALLEY: We're at Shaver's Creek Environmental Center at the Raptor Center of Penn State and this is a barred owl that Janet is holding while we listen to the eagles scream in the background.
The barred owl is native to the east, named for the bars on it. And this is an owl that has sort of figured out people. It can live in the edge of suburbia. It still needs nature, but it can put up with some of us.
As a very close cousin who lives in the Pacific Northwest, the Northern Spotted Owl, who has not figured out people. That Northern Spotted Owl needs vast tracts of undisturbed old growth forest to survive. When we cut that into islands, we log away some of it and make little islands. This one actually will replace the Northern Spotted Owl, and by disturbing things, we're starting to get rid of a species.
[MUSIC PLAYING]
Jedediah was a spotted owl, nesting in an old-growth tree. Needed lots of forest for to find his food, but we logged it into islands you see. So he lost his family.
Singing small supports few. Large can grow more. If we isolate our national parks, it's true, some species going out of the door. Extinction's going to follow for sure.
A diverse ecosystem's more productive and stable, it warns us when things are going wrong. It may have new foods that we can use on the table, and medicines to help us along, cures to keep us singing our song.
Now we use half of all that's here, and we may double, and each want more. If we don't find a better way the outcome is clear lots of species going out of the door. Extinction's going to follow for sure.
If we want a diverse world, there's so much we can do. Be smarter in feeding and fueling our lives. Connect the parks for the wild things who will really please our grandkids, too.
For extinction is the end. Or we can leave them living free. So many wise things we can do, my friend, for them and for you and me. For biodiversity.
Jeremiah is a bullfrog, he's a good friend of mine. Hope that our grandkids' grandkids know his unless we're smart, it's the end of the line. But if we're smart, we can make it fine.
Singing joy to the World. All the boys and girls, now. There's room for the fishes in the deep blue sea, to live here with you and with me. Lots of biodiversity. I'm singing biodiversity.
Chaos and Phil the Groundhog (and weather, climate and global warming)
Many people, including US senators, have offered the opinion that our inability to forecast weather more than a week or two in advance means that we cannot forecast climate years ahead. This seems sensible, but is actually really wrong. And, anyone who understands the game of Wheel of Fortune knows why. Here’s a musical explanation, prepared for Groundhog Day 2015, when Dr. Alley was inducted into the Punxsutawney Weather Discovery Center Hall of Fame.
A parody of "Rhythm of the Rain" by John Claude Gummoe (The Cascades), and of Wheel of Furtune.
As the wheel of fortune wheel is spinnin, slowin down, you can predict it just before it stops.
Where it's gonna end, whether a smile or frown, but for no more than a few seconds tops. But you know before the spin, the million-dollar pie is skinnier than all the rest. You can predict it will be rare as a few weeks go by, confident you'll pass the test. The game is chaotic, so you cannot know too far in the future just how it will go. But the wheels deterministic, as the averages show, through the years.
The weather follows rules that we now know quite well, the physics cannot go away, but too far in the future and you cannot tell what will happen on a single day. Because no data can be perfect, we can never know, everything, exactly, everywhere. Tomorrow's forecast is quite good, but the uncertainties grow till we can't tell what will occur then, there.
But this chaos doesn't mean that anything goes. Brazil's hot rainforests won't get Antarctic snows, the climatic averages show how the wind blows (in your ear).
If they widen the million wedge, the chances would rise that any spin would hit it square. You still could not predict one spin but no surprise, more millions would be spun up there.
If the sun brightens up or less reflects back out or there's an increase in greenhouse gas, that turns up the thermostat, there is no doubt, and climate change will come to pass. And history .physics, data, models show, our CO2 warms the surface here below, so we're heating the climate as our emissions grow through the years.
But climate averages the weather, you still have to spin and see just where the pointer stops. Sometimes you lose and other times you win, some lovely days and yes, some flops.
On February 2nd of another year, the faithful sun will surely rise, but will it bring shadows on a morning clear or diffused light under cloudy skies? Phil, please tell us what will March 1st bring, sleet, snow, tornados, a warm day in spring? You're just as good for that as a computer thing… and you're cuter!
Phil please tell us what will March 1st bring, sleet, snow, tornadoes, a warm day in spring? You're just as good for that as the computer thing … and you're cuter!
Module 12 Wrap-Up
Module 12 Wrap-Up
Review Module Requirements
You have reached the end of Module 12! Double-check the list of requirements on the Welcome to Module 12 page and the Course Calendar to be sure you have completed all the activities required for this module.
Reminder
Exercise #6 is due this week. Check the Course Calendar for the specific due date.
Comments or Questions?
If you have any questions, send an email via Canvas, to ALL the Teachers and TAs. To do this, add each teacher individually in the “To” line of your email. By adding all the teachers, the TAs will be included. Failure to email ALL the teachers may result in a delayed or missed response. For detailed directions on how to do this, see How to send an email in GEOSC 10 in the Important Information module.
Course Review
Course Review
Into the Sunset
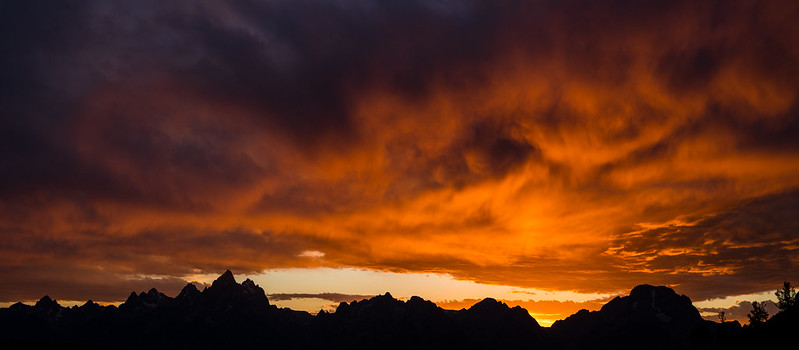
We’ve been through a lot—a tour of some of the finest places in the world, and a “tour” of the science of the Earth. What should you have learned from all of this?
First, science is a successful human activity that allows us to do things we want by first learning how things work. Scientists come up with ideas, and then try very hard to prove those ideas wrong. Situations are found in which a new idea makes predictions that differ from those of old ideas. These situations are then created (experiments), and the outcomes show which idea predicts better. An idea that makes wrong predictions many times is discarded; an idea that makes correct predictions many times is accepted tentatively. It may be right, or just a good approximation, or just lucky. If we behave as if the ideas that make accurate predictions are in fact true, we are able to do things successfully. Many people believe that this shows that the successful ideas are in fact true, or at least close to being true, but there is no way to prove this.
Geology is the science of the Earth. Geologists study the materials that make up the Earth, and the processes that happen to them or have happened to them in the past. Much of geology is highly practical: finding oil, clean water, metals, and other valuable things in the Earth; warning people of geological hazards such as landslides, earthquakes, and volcanoes. Some of geology will become important; geologists are helping in writing the “operator’s manual for the Earth” to help us and the Earth live in harmony in the future. Some of geology is just plain fun—learning about the dinosaurs, for example. Much of geology is fundamental, and contributes to all of these.
The Earth formed about 4.6 billion years ago. It has a layered structure, with a mostly-iron core (which is solid in the middle but liquid outside of that), with a silicate mantle (but, as silicates go, with relatively much iron, magnesium and calcium and relatively low silica), and a thin silicate crust on top that is rich in silica, sodium, potassium, and aluminum.
Crudely, the heat of the Earth drives processes that build mountains, and the heat of the sun drives processes that tear the mountains down. Inside the Earth, radioactive decay makes heat, with a little help from other processes. Heating rocks softens them and reduces their density. The heating of rocks from below causes convection cells. Columns of hot rock rise from deep in the Earth, perhaps from the core-mantle boundary, to feed hot spots that erupt basaltic lava (higher in silica than the mantle) and produce volcanic chains such as Hawaii. Where a hot spot exists under a continent, the basaltic lava may melt some continental rock to become silica-rich and explosive, as at Yellowstone.
Most of the heat loss from the Earth is through roll-shaped convection cells higher in the Earth’s mantle. These reach into the upper mantle; the very upper mantle and the crust make the cold and brittle lithosphere, which floats on the softer rocks deeper in the mantle. Where the convection cells rise and spread, the rocks above are raised high and split apart. Basaltic lava leaks up through the cracks and hardens, making sea floor at spreading ridges in the oceans. Where a spreading ridge passes under a continent, the ridge splits the continent to form fault-block, pull-apart mountains separated by deep valleys, including the Sierra Nevada and Death Valley.
Ocean lithosphere initially is warm, but cools and becomes more dense with time. Eventually, it sinks back into the mantle at a subduction zone. The downbending at a subduction zone makes a deep trench in the ocean. Sediments may almost completely fill a trench near a continent, but trenches lacking abundant sediments are the deepest places in the oceans. Sediments scraped off a downgoing slab may pile up to make coastal mountains, such as those of Olympic National Park. Some sediments go down with the subducting slab, but are heated as they go down, and eventually melt to make andesitic lavas, higher in silica and lower in density than the basaltic sea floor. These feed explosive, steep stratovolcanoes such as Mt. St. Helens and Mt. Rainier. Sometimes, such stratovolcanoes form offshore rather than on the land, giving island arcs. When such an island arc, or another continent, reaches a subduction zone, the silica-rich rocks are too low-density to sink. The collision of an island arc or a continent with another continent is called obduction, and forms folded and thrust-faulted mountains such as the Appalachians, including the Smoky Mountains and Mt. Nittany.
Above all of this activity, the Earth is wrapped in a thin layer of air and water and ice that erupted from volcanoes over time. The sun heats the air, causing convection cells. Convecting air cools by rising and expanding, or by radiation, and this cooling causes rain and snow.
Rocks at the surface of the Earth often formed in the Earth under different conditions and are unstable at the Earth’s surface. Physical processes break these rocks into smaller pieces, and chemical processes change the minerals in the rocks to other types. Silicate rocks release ions that wash to the sea, and clays, quartz sand and rust that mix with organic materials (worm poop, etc.) to form soil. If loose soil and rock are too steep and wet, they slide or creep downhill in mass movements.
Rain that reaches the surface of the Earth is mostly returned to the atmosphere after being used by plants, with most of the remainder soaking into spaces in the ground to form groundwater. Groundwater eventually returns to the surface to feed streams; we humans intercept this flow in the ground with wells. Pollution of this groundwater is a common problem, and very difficult to clean up.
The rocks and water that are moved across or beneath the surface of the Earth feed streams. The characteristics of streams—whether wide and braided or deep and meandering, for example—depend on the debris supply as well as the water supply. If humans interrupt the usual pattern of water and sediment transport, we usually cause other changes (erosion, sedimentation, subsidence, etc.) that cause problems for us.
Glaciers are really cold-weather streams. Glaciers move water and rock from place to place on the Earth, and typically are more effective at moving rocks than are other mechanisms of sediment transport such as mass movement, streams, and wind. Glaciers have grown and shrunk many times over the last million years, covering as much as 1/3 of the modern land surface. The Earth’s surface in those formerly-glaciated regions is still dominated by features left by the glaciers. Many of our most beautiful landscapes, including Glacier and Yosemite, center on the works of glaciers.
Mass movement, streams, and glaciers wear down the mountains. These processes also deposit sediments. The types of sediments, their fossils, and other features contain a history of events at the Earth’s surface. Reading this history, we find that the Earth is very old. Annual layers in the very youngest deposits, including trees and ice sheets, record more than 100,000 years. Rocks beneath the trees and ice sheets contain evidence of old seas and deserts and mountains, which early geologists realized had required more than about 100 million years to form. Radioactive clocks tell how long the time gaps were in the sedimentary record and how much time was required to make the oldest rocks, revealing that the Earth is about 4.6 billion years old.
The fossils in the rocks show that offspring differ from their parents slightly; these differences affect ability to survive to have offspring, and the genetic basis of these differences is passed on to offspring in greater or lesser degree. Over long times, accumulation of these differences has led to changes in the types of living things on Earth (evolution by natural selection). At some times, catastrophic events such as meteorite impacts have caused mass extinctions; at other times extinction has been a gradual process.
In the geologic record, recent times would look like a mass extinction. Humans are using more and more of the Earth’s resources. Because these resources are not available to other species, individuals and entire species have disappeared. Humans are also changing the climate, and spreading pollutants across the globe. These changes are not yet catastrophic, and may never be, but humans will need to reduce our impact in the future if we wish to prevent more extinctions and possible catastrophic harm to ourselves. This must be accomplished through some combination of controlling our numbers, or controlling our impact per person.
Science has proven, over and over again, to be the best tool humans have ever developed for learning enough about the world that we can keep ourselves sufficiently fed, clothed, free of disease, and otherwise healthy so that we can worry about the big questions of what we are here for and how we get along with each other and stay happy. Geology is an important piece of the big picture of science. National parks have proven, over and over again, to be beautiful, enjoyable preserves of our shared natural and human heritage. It is our fondest hope that you will have a happy and prosperous future, that you will appreciate and perhaps even contribute to the benefits of science, including geology, that you will enjoy using the benefits of science to contemplate big questions, and that you will do some of your contemplation in your national parks. Pleasant journeys!!!
Acknowledgments
Building a real online course takes a community. The primary author of GEOSC 10 is Richard B. Alley, and I’d like to thank a whole lot of other people who have worked very hard to make the course a reality. In no special order, here are a few of the key folks.
The transition from all-paper to online content was made in concert with the College of Earth and Mineral Sciences' CAUSE trip to the Grand Canyon and surrounding national parks during 2004. Eric Spielvogel was the primary architect and guiding force of that trip, and was aided by Anna Brendle with the enthusiastic support of Dutton e-Education Institute director David DiBiase and help from Annie Taylor. WPSU contributed a lot of resources. Topher Yorks filmed the whole thing and kept us in batteries, good music, and goodwill, Tom Keiter and Joe Myers really bolstered filming during part of the trip, and the WPSU management (including Ted Krichels, Jeff Preston, and Tracy Vosburgh) supported the effort. The CAUSE students were Sam Ascah, Risa Goren, Raya Guruswami, Ryan Hanrahan, Dave Janesko, Kym Kline, Lainie McGuiney, Irene Mckenna, Amish Shah, Steph Shepherd, Sameer Safaya, Sheri Shannon, and Dave Witmer, TV stars and stars in and out of class. Dave Witmer really worked to get the “GeoClips” in order after the course ended.
Sridhar Anandakrishnan was the other prof on the trip, is the other prof in the course, and is the best rubber-duck herder ever. His contributions are woven seamlessly through the course in so many ways, and it would not be what it is without him.
At the Dutton e-Education Institute, Eric Spielvogel has been responsible for filming, course planning, course building, HTML programming, and a great range of additional things from the very beginning—you’ll find his handiwork throughout. Annie Taylor and Jennifer Babb have made the course work, solved the myriad technical problems, planned, and upgraded. David DiBiase has been a continuing guide and supporter. Marty Gutowski and Dave Babb have helped out, too.
Cindy Alley has done the textbook publishing, the figures in the textbook, the geovisualization of the rock videos, a lot of the filming of rock videos and various other parts of the course, as well as putting up with a lot of complaining over the years. Eric Spielvogel started the rock-video filming, including bringing his truly artistic eye to the effort. Additional help for the rock videos has come from Janet Alley, Karen Alley, Adam Jones, Amanda Jones, Carl Pillot, Will Ross, and WPSU. Flash animations in the exercises were supported by the Penn State Blended Learning Initiative, with Dean Blackstock’s animation and help from Mark DeLuca.
Much of the work of the course is done by the Teaching Assistants. We have had great ones. The course dates back to 1996 and began the transition to electronic in the fall of 2005. There have literally been dozens of TA's that have contributed to this course. I wish I could list them all, but the list is just too long.
The externally funded research that Sridhar and I conduct informs the teaching we do. Although we have not been funded directly to build the course, our funding agencies encourage education and outreach, and we are grateful for that. Our research has especially been funded by the US National Science Foundation, primarily through their Office of Polar Programs. We have also received support from NASA, and from the Comer Science and Education Foundation. Supplying this material to so many students, and making this material available to the public, is a way to pay back our funding agencies for support that ultimately originated with the public.
Some “Greatest Hits”:
The CAUSE effort and the development of GEOSC 10 have been rather prominently featured in various Penn State efforts and more broadly. At the Outreach Conference “Engaging Faculty: Public Service Media as Service Learning” in 2004, the effort was described in talks by Sridhar Anandakrishnan, David DiBiase and Eric Spielvogel as well as by me. CAUSE student Stephanie Shepherd and I described our efforts to the Partners of the Penn State Trustees. The work was featured prominently in my College of Earth and Mineral Sciences (EMS) G. Montgomery and Marion Mitchell Innovative Teaching Award (“Rocking the Parks: Big Canyons, Big Craziness, and a Big Team Innovating in General Education”). Similarly, GEOSC 10 and CAUSE figured prominently in my Eisenhower Teaching Award from Penn State. The film of the CAUSE trip won an Emmy Award, has been shown on WPSU many times, and in the EMS museum many more times. Shorter versions were shown to the New Student Convocation at University Park for at least two years, to incoming Schreyer Honors Scholars, in the University President's State of the University address, and in the Road Scholars orientation for new faculty at Penn State. We were also featured on the cover of the EMS undergraduate recruiting packet. In addition to offering GEOSC 10 to students across the Penn State system, our materials have been incorporated in locally taught courses at Penn State’s Dubois, Delaware County, and Lehigh Valley campuses, and are being used in university education outside of Pennsylvania. Dispatches from the CAUSE trip were highlighted on Penn State’s website, and a discussion on Deep Time with Eric Spielvogel was featured at Research Penn State. We’re happy that thousands of students have learned lots from GEOSC 10 while providing high ratings on Student Educational Experience Questionnaires. With many more people studying our materials outside of the normal classroom (including more than 5000 views of the YouTube spinoff of our Rock Videos as of the end of 2008), we’re even happier.