Lesson 3: Script that makes a plot
Syntax introduced:
legend
% this is a test script. it makes a plot
x=0:.1:2*pi;
y=sin(x);
z=sin(2*x);
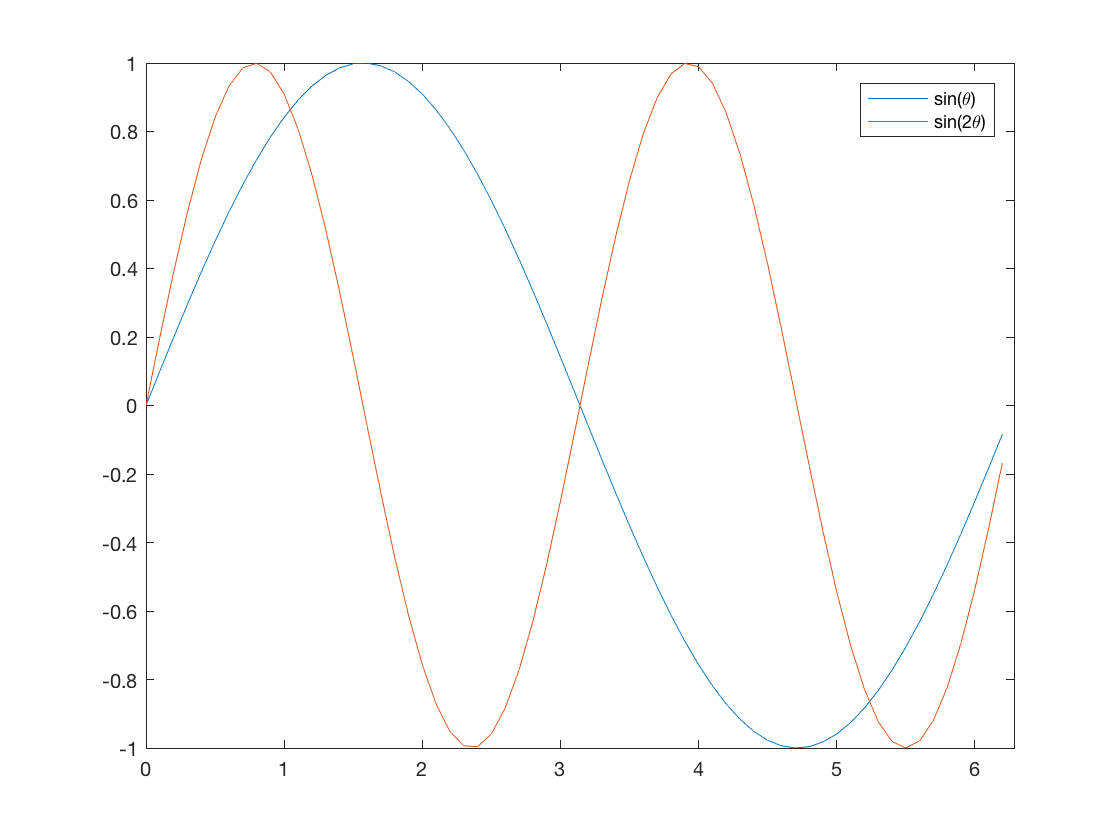
plot(x,y,x,z);
axis([0 2*pi -1 1]);
legend('sin(\theta)','sin(2\theta)');
Explanation of the script
First I wrote a comment that says what the script does. Then I created a vector named x. Then I created two more vectors the same size as x that are functions of x. Next I used plot to plot both functions on the same axes. I set the axes limits, and then I made a legend to label both lines. legend is a new command. By default it correctly labels the plotting elements in the same order as you plot them in your script. Enclose any plain text in single quotes so MATLAB will render it as text. This works in the legend and also in axes labels and tick labels. Many special symbols such as Greek letters can be rendered by typing the word out with a backslash in front of it. The table below tells how to make some common special characters so they'll be rendered correctly on labels.
| SYMBOL | AN EXAMPLE | HOW TO TYPE IT |
|---|---|---|
| lowercase Greek letter | α | '\alpha' |
| uppercase Greek letter | Γ | '\Gamma' |
| degree | 40.8° N | '40.8\circ N' |
| superscript | x2, ∂O18 | 'x^2', '\deltaO^{18}' |
| subscript | H2SO4 | 'H_2SO_4' |
Efficiency vs. Readability, take two
I could have saved a couple of lines in my script if I had just written:% this is a test script. it makes a plot
x=0:.1:2*pi;
plot(x,sin(x),x,sin(2*x));
axis([0 2*pi -1 1]);
legend('sin(\theta)','sin(2\theta)');
MATLAB can do calculations within plot. But, even though the second example is shorter, it's my personal preference to do calculations and plotting as separate parts of my scripts. (This is probably a holdover from growing up with programming languages like C and FORTRAN in which you would do all your calculations there, and then pipe the output to a separate plotting package.) Nevertheless, I think separating data manipulation from plotting is not such a bad habit, especially once you get to more complicated programs. When you are working through difficult concepts, it is easier to isolate and fix mistakes if the math and/or science analysis is not wrapped up inside the choice of how to display the output, in my mind.