Lesson 4: Mechanical Properties
Overview
Many materials are subjected to forces or loads when in use. In such situations, it is necessary to know the characteristics of the material and to design the member in order to avoid failure during the expected life and service environment of the material. Key mechanical design properties are stiffness, strength, hardness, ductility, and toughness. Factors to be considered include the nature of the applied load and its duration, as well as the environmental conditions. The applied loads could be tensile, compressive, or shear and their magnitudes may be constant with time or may fluctuate continuously. Application time may be only a fraction of a second, or it may extend over a period of many years. Service temperature may be an important factor. In this lesson, we will introduce how the various mechanical properties are measured and what these properties represent.
Learning Objectives
By the end of this lesson, you should be able to:
- Define stress and strain.
- Define elastic region, plastic region, fracture point, elasticity, tensile strength, and the yield strength.
- Given a stress-strain diagram, determine elastic region, plastic region, fracture point, elasticity, tensile strength, and the yield strength.
- Distinguish between tensile, compressive, shear, and torsional stress.
- Define hardness, resilience, and toughness.
- Evaluate whether a material is ductile or brittle using a stress-strain diagram.
Lesson Roadmap
Lesson 4 will take us 1 week to complete. Please refer to Canvas for specific due dates.
| To Read |
Read pp 66-98 (Ch. 4) in Introduction to Materials ebook Reading on course website for Lesson 4 |
|---|---|
| To Watch | Making Stuff: Stronger |
| To Do | Lesson 4 Quiz |
Questions?
If you have general questions about the course content or structure, please post them to the General Questions and Discussion forum in Canvas. If your question is of a more personal nature, feel free to send a message to the instructor through Canvas email. The instructor will check daily to respond.
Reading Assignment
Things to consider...
When you read the web material for this lesson and e-book material for this lesson, use the following questions to guide your reading. Also, remember to keep the learning objectives listed on the Overview page in mind.
- What is the difference between stress and strain?
- Given a stress-strain diagram for material, how can one identify the elastic region, plastic region, fracture point, elasticity, and the yield strength?
- Given a stress-strain diagram for a material, how can you determine if the material is ductile or brittle?
- How do tensile, compressive, and shear stress differ?
- Do the terms stiffness, strength, hardness, ductility, and toughness mean the same to the general public as they do to materials scientists and engineers?
Reading Assignment
Read pp 66-98 (Ch. 4) in Introduction to Materials ebook
Tensile, Compressive, Shear, and Torsional Stress

As we can see in the above graphic, there are quite a few materials terms that are used when describing the properties of materials. In this lesson, we are going to define the above terms. It turns out that many of the above terms are related to the stress-strain curve of a material. What are stress and strain, and how are they related?
Let us take a cylinder and stress it. To stress it, I would fix one end of the cylinder and pull from the other end as shown in the figure below.

According to Newton's third law, the cylinder will experience a force downward on the lower surface of the cylinder and an equal and opposite force on the upper surface of the cylinder. My cylinder has an original length of Io and surface area of Ao. As I pull on my material with the force F the cylinder will lengthen and the resulting length will be l. Stress, σ, is defined as the force divided by the initial surface area, σ=F/Ao. This pulling stress is called tensile stress. Strain is what results from this stress. Strain, ε, is defined as the change in length divided by the original length, ε
If instead of pulling on our material, we push or compress our cylinder we are introducing compressive stress. This is illustrated in the following figure:

If instead of applying a force perpendicular to the surface, we apply parallel but opposite forces on the two surfaces we are applying a shear stress. This is illustrated in the following figure:

Stress related to shear is torsional stress. If we hold one end of our cylinder fixed and twist the other end as shown in the figure below, we are applying a torsional (or twisting) stress.

Examples of Materials Under Stress

If we look at a picture of a ski lift, we can see several different types of stress. The cable, highlighted in the box labeled A, is subject to tensile stress. The driveshaft, highlighted in the box labeled B, is experiencing torsional stress. The support pillar, highlighted in box labeled C, is subject to compressional stress. In the two figures below, the boulder is applying a compressive stress on the rock that is supporting it and the metal struts of the bridge are experiencing compressive stress while supporting the upper structure of the bridge.

Stress-Strain Testing

A typical stress-strain testing apparatus is shown in the figure above, along with the typical geometry of a tensile test specimen. During a tensile test, the sample is slowly pulled while the resulting change in length and the applied force are recorded. Using the original length and surface area a stress-strain diagram can be generated.
To Read
Now that I have introduced stress, please go to your e-textbook and read the first two sections (pages 65 to 70 in Chapter 4 of Materials for Today's World, Custom Edition for Penn State University) of this lesson's reading. When finished with the reading proceed to the next web page.
Elastic Region
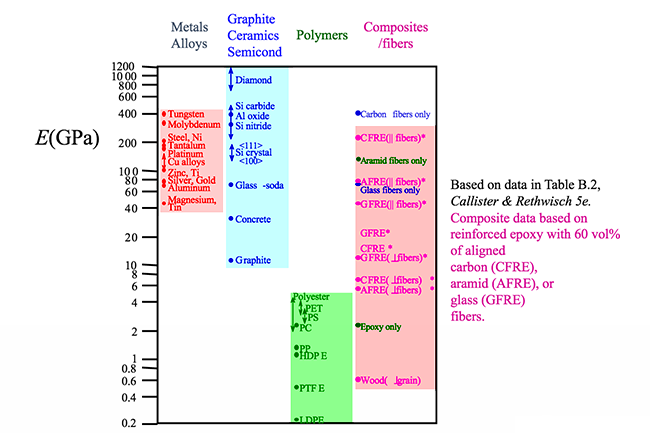
What is the elastic region? It is the region where the material can be deformed and when released will return back to its original configuration. Many metals in the elastic region have a resulting strain that is proportional to the tensile load when the applied tensile load is small. Mathematically, this can be written as , and more generally is known as a form of Hooke's law. E is the proportionality constant and is called the modulus of elasticity or Young's modulus. Physically, the larger the value of the modulus of elasticity the stiffer the material is, i.e., the more resistant to bending the material is. If we look at a stress-strain diagram for a metal in the elastic region such as that shown in the figure below, the slope of the curve is the modulus of elasticity.

If we look at the figure below it is not surprising that the material listed with the highest E is diamond. Diamond has strong carbon bonds and is incredibly stiff. Larger E indicates a stronger bond. Later when we study composites in more detail, we will see that fibers are added to polymers to increase the stiffness of the material. Increased stiffness implies increased E, which you can see in the figure for the composite/fiber materials.
To Read
Now that you have been introduced to elasticity, please go to your e-textbook and read section 7.3 (pages 71 to 74 in Chapter 4 of Materials for Today's World, Custom Edition for Penn State University) of this lesson's reading. When finished with the reading proceed to the next web page.
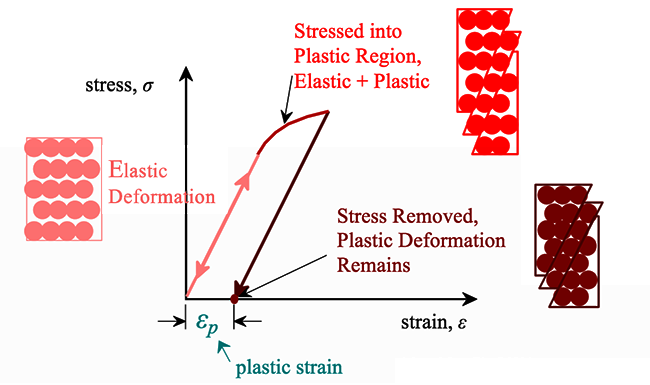
Plastic Deformation
For most metallic materials, the elastic deformation region is relatively small. At some point, the strain is no longer proportional to the applied stress. At this point, bonds with original atom neighbors start to break and reform with a new group of atoms. When this occurs and the stress is relieved, the material will no longer return to its original form, i.e., the deformation is permanent and nonrecoverable. The material has now moved into the region referred to as plastic deformation. In practice, it is difficult to identify the exact point at which a material moves from the elastic region to the plastic region. As shown in the figure below, a parallel line offset by 0.002 strain is drawn. Where that line intercepts the stress-strain curve is identified as the yield strength. The yield strength is equal to the stress at which noticeable plastic deformation has occurred.
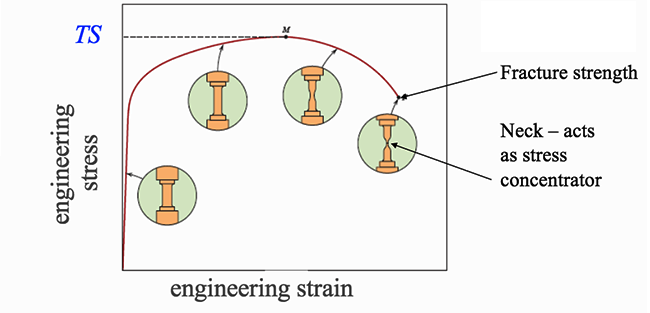
For many materials, the stress-strain curve looks like the curve shown in the figure below. As the stress is increased from zero, the strain increases linearly until it starts to deviate from linear at the yield strength. For increasing stress, the curve proceeds to a maximum, at which point it curves downward toward the fracture point. The maximum corresponds to the tensile strength, which is the maximum stress value for the curve and is indicated by M in the figure. The fracture point is the point at which the material ultimately breaks, indicated by F in the figure.
Resiliency and Toughness
When a person is resilient, we mean that they bounce back from change to their original personality. Resiliency in the material sense is similar. We can define resilience of the material to be the amount of energy the material can absorb and still return to its original state. If we are talking about stressing the material and having it return to its original state, we are talking about the material remaining in the elastic region of the stress-strain curve. It turns out that we can get the energy of elasticity by taking the area under the curve of the stress-strain curve. That area has been highlighted in the figure below, which is the area under the curve from the origin to the yield strength.

Toughness, in contrast to resilience, is how much energy can be absorbed and still keep going. One analogy that can be used when describing toughness is that of a car in a demolition derby. The car is allowed to continue the competition as long as it is capable of moving. It does not matter how many hits and how much destruction has been done to the car, but rather as long as the car can move it can stay in the competition. The toughness of the car is based on how many hits and how much damage the car can sustain and continue in the competition. In the case of materials, the amount of energy that the material can absorb plastically before fracturing is the toughness.
In the figure below, we can see that a material can have a high tensile strength (ceramics) and yet have a small toughness. In addition, materials can be extremely ductile (unreinforced polymers) and also have a small toughness. So, a large toughness (metals) is obtained by having a high tensile strength and a high ductility.

What is a Brittle Material?
Brittle material breaks while little to no energy is absorbed when stressed. The material fractures with no plastic deformation. The material in the figure below marked with (a) shows what a brittle material will look like after pulling on a cylinder of that material. Typically, there will be a large audible snap sound when the brittle material breaks. A brittle material is also known as a material having low ductility. A stress-strain curve for brittle and ductile materials is shown in the figure below. We will talk more about ductile materials in the next section.

You may be asking: why are ceramics so much more brittle than metals? It has to do with the type of bonding. In metals, their metallic bonds allow the atoms to slide past each other easily. In ceramics, due to their ionic bonds, there is a resistance to the sliding. Since in ionic bonding every other atom is of opposite charge when a row of atoms attempts to slide past another row, positive atoms encounter positive atoms and negative atoms encounter negative atoms. This results in a huge electrodynamic repulsion which inhibits rows of ceramic atoms from sliding past other rows. In metals, the sliding of rows of atoms results in slip, which allows the metal to deform plastically instead of fracturing. Since in ceramics the rows cannot slide, the ceramic cannot plastically deform. Instead, it fractures, which makes it a brittle material.
Malleability and Ductility
Malleability and ductility are related. A malleable material is one in which a thin sheet can be easily formed by hammering or rolling. In other words, the material has the ability to deform under compressive stress.

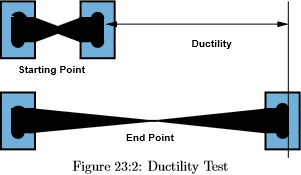
In contrast, ductility is the ability of a solid material to deform under tensile stress. Practically, a ductile material is a material that can easily be stretched into a wire when pulled as shown in the figure below. Recall pulling is applying tensile stress.

If we pull on a rod of material, some of the possible profiles of the rods at fracture are shown in the figure below.
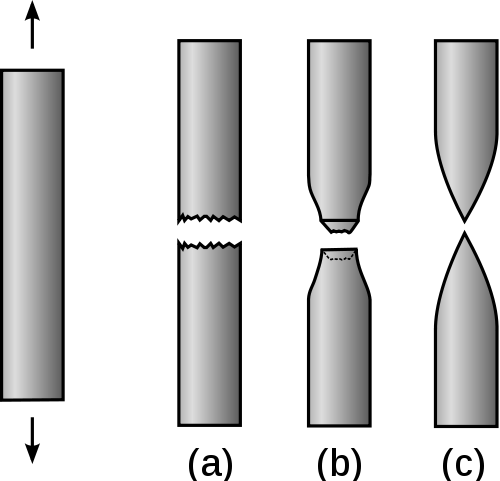
Profile (a) is an example of the material that fractures with no plastic deformation, i.e., it is a brittle material. Profile (b) is an example of a material that fractures after very little plastic deformation. These two profiles would be classified as having low ductility. Profile (c) in contrast is a material that plastically deforms before fracture. This material has high ductility. The stress-strain curves for the brittle, profile (a), and the ductile material, profile (c), are shown in the figure below.

To Read
Now that you have learned a bit about the mechanical behavior of metals, please go to your e-textbook and read pages 75 to 84 in Chapter 4 of Materials for Today's World, Custom Edition for Penn State University to learn more about this subject. When finished with the reading, proceed to the next web page.
Mechanical Behavior of Ceramics
It is difficult to measure the yield strength of ceramics as they tend to fracture before they enter the plastic deformation region, i.e., they are brittle. Examples of two brittle materials that fracture before entering the plastic deformation region are aluminum oxide and glass, as shown in the figure below.

Tensile tests of brittle ceramics are usually not performed. It is difficult to shape these materials into the proper test structure, difficult to grab the brittle material without breaking it, and it is difficult to align the test samples to avoid bending stresses which can destroy the sample. For brittle ceramics, a three-point bending apparatus (shown in the figure below) is used determine the stress-strain behavior, and the measurement results are used to calculate an equivalent modulus of elasticity.

To Read
Now that you have been introduced to the mechanical behavior of ceramics, please go to your e-textbook and read more on this topic on pages 84 to 86 in Chapter 4 of Materials for Today's World, Custom Edition for Penn State University. When finished with the reading proceed to the next web page.
Mechanical Behavior of Polymers
Polymers exhibit a wide range of stress-strain behaviors as shown in the figure below. The brittle polymer (red curve) elastically deforms and fractures before deforming plastically. The blue curve is a plastic polymer and is similar to curves for many metals. Its behavior begins in the linear elastic deformation region. As the curve transitions from the elastic to plastic deformation typically there is a peak stress. For polymer materials, this peak stress is identified as the yield stress. As the material is pulled further, fracture occurs. The stress value when fracture occurs is defined as the tensile strength for polymer materials. The tensile strength can be greater than, equal to, or less than the yield strength. The green curve is a class of polymers known as elastomers. These materials exhibit rubber-like elasticity and will return to their original shape and form unless they are extended to the point of fracture.

While some of the stress-strain curves for polymers might look similar to ones for metals, polymers are mechanically different than metals (or ceramics). A highly elastic polymer may stretch over 10 times the original length before breaking, while a metal might elastically stretch 10% of the original length elastically and may stretch plastically to double the original length before reaching its fracture point. As seen in the figure below, the largest elastic modulus values for polymers are well under the values for ceramics and metals.

As shown in the figure below, the tensile strength of some polymers can rival some ceramics but are no match for even the softest of metals.

To Read
Now that you have learned a bit about the mechanical behavior of plastics, please go to your e-textbook and read pages 87 to 89 in Chapter 4 of Materials for Today's World, Custom Edition for Penn State University to learn more about this subject. When finished with the reading, proceed to the next web page.
Hardness
Hardness is a measure of a material's ability to resist plastic deformation. In other words, it is a measure of how resistant material is to denting or scratching. Diamond, for example, is a very hard material. It is extremely difficult to dent or scratch a diamond. In contrast, it is very easy to scratch or dent most plastics. As shown in the diagram below, hardness increases from the very soft plastics to the incredibly hard diamond with most other materials ranging between.

A common method for measuring the hardness of a material is outlined in the figure below. A very hard-sphere is pushed with a set force into the material. The resulting indent is measured for width and depth. A harder material will have a smaller width and depth, i.e., smaller indentation. Larger hardness results in a high resistance to deformation from compressive loads, i.e., resistance to scratches and dents, and better wear properties.

To Read
Now that you have been introduced to the concept of hardness, please go to your e-textbook and finish the reading for this chapter (pages 90 to 97 in Chapter 4 of Materials for Today's World, Custom Edition for Penn State University). When finished with the reading proceed to the next web page.
Video Assignment: Making Stuff Stronger
Now that you have read the text and thought about the questions I posed, take some time to watch this 53-minute video about trying to find the strongest materials in the world. As you watch this video please pay particular attention to: (1) the ways that materials can be made stronger, (2) how stronger materials can be made lighter, cheaper, or better in other ways, and (3) how new stronger materials are designed for specific applications.
Video Assignment
Go to Lesson 4 in Canvas and watch NOVA's Making Stuff: Stronger Video. You will be quizzed on the content of this video. Skipped for Summer 2024 LEAP.
Summary and Final Tasks
Summary
In this lesson we discussed the stress–strain behaviors of metals, ceramics, and polymers and the related mechanical properties. Understanding and classifying the properties of materials allow us to design, produce, and utilize materials more efficiently and productively. In some cases, understanding materials allow us to utilize them for new applications. Lesson 4 provides us a language to discuss and compare different materials, while the previous lessons on the classification of materials and atomic structure along with upcoming lessons on the structure of materials will inform us regarding how geometric atomic arrangements and atomic structure can affect materials properties. In the next lesson, we will study how metal atoms arrange to form solids and some of the applications of metals.
Reminder - Complete all of the Lesson 4 tasks!
You have reached the end of Lesson 4! Double-check the to-do list on the Overview page to make sure you have completed all of the activities listed there before you begin Lesson 5.