Prioritize...
You should be able to discuss why cloud-drift winds are important in tropical weather forecasting and what their main applications are once you've finished this page.
Read...
As you've already seen, remote sensing from satellites can be used to estimate the intensity of a tropical cyclone via the Dvorak Technique. Indeed, several other satellite-based remote sensors help forecasters observe various aspects of a tropical cyclone's structure and intensity as well. We'll cover several more of these sensors as we continue through the lesson. In this section, I'm going to focus on a remote-sensing technique that has broader applications than just tropical cyclone analysis.
The same geostationary satellites used to execute the Dvorak Technique can also be used to remotely retrieve tropospheric wind information by calculating what are formally called atmospheric motion vectors (AMVs) -- you'll also sometimes hear AMVs referred to as cloud-drift winds (CDWs) or cloud-tracked winds. On the Web, you may encounter any of these phrases, so just realize that they refer to the same thing. For simplicity however, I'm going to stick with the term "cloud-drift winds" because it intuitively describes how this product is created. In a nutshell, this technique retrieves estimates of wind speeds and directions at various altitudes by tracking the movement of clouds on satellite loops. The process sounds pretty simple, but it can actually be quite challenging.
Before we really explore cloud-drift winds, I should point out that they rarely get a mention in any NHC discussions. So, what's the role of CDWs in tropical weather forecasting? Well, as you know, there's a serious dearth of routine radiosonde observations over the oceans, where the lack of data introduces errors into numerical simulations of the atmosphere. Thus, the capability of getting a proxy for winds by measuring how fast clouds drift over open seas is invaluable. With numerical weather prediction in mind, it should come as no surprise to you that CDWs are assimilated into computer models. Cloud-drift winds also have applications to aviation and mesoscale meteorology, and if you're interested, you can learn more about the utility of cloud-drift winds from this 2005 article published in the Bulletin of the American Meteorological Society (BAMS).
Cloud-drift winds are also used to help in assessing a tropical cyclone's wind field. For example, one of the remote observations that contributed to this H*Wind analysis of Hurricane Isabel from 0130Z on September 18, 2003 was "GOES from 0102 - 2202Z." Indeed, the technique of determining wind speeds from geostationary satellites via cloud-drift winds helped forecasters construct an estimate of Hurricane Isabel's wind field by tracking cloud movement over a period of 21 hours.
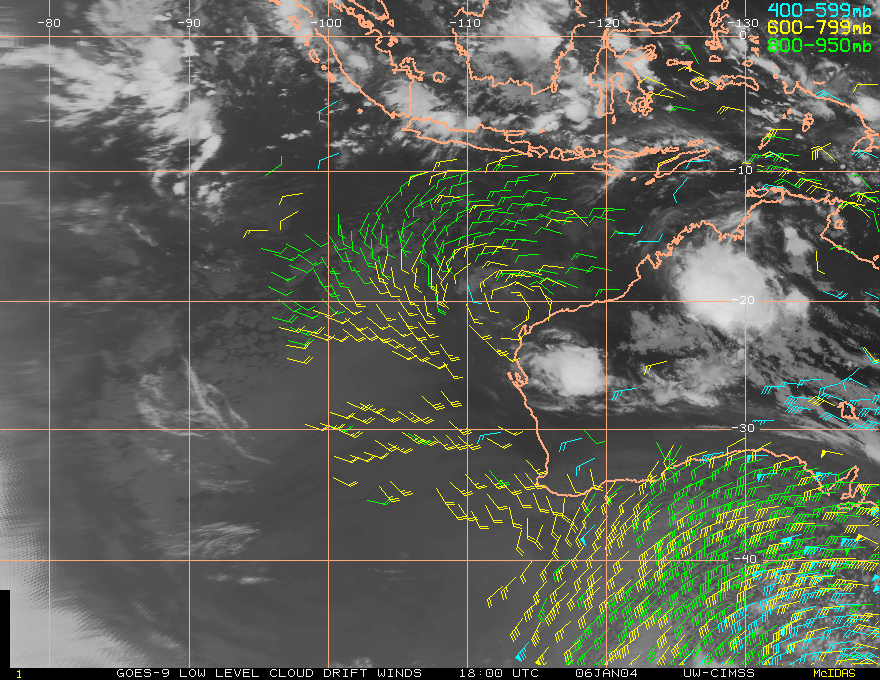
More commonly, cloud-drift wind data are displayed as in the image below, which shows wind barbs annotated on infrared satellite imagery over the Southeast Indian Ocean (if you need to get your geographical bearings on this image, please refer to this political map of the Indian Ocean(link is external)). The various colors are described by the key in the upper-right corner of the image (green wind barbs are in the layer between 800 mb and 950mb; yellow = 600 - 799 mb; blue = 400 - 599 mb). For example, look off the west coast of Australia and note the closed, cyclonic circulation. Remember that this image is from the Southern Hemisphere, so "cyclonic" refers to a clockwise circulation. Using infrared imagery alone, the system would only appear as an innocuous blob of relatively low clouds, but the yellow barbs derived from cloud-drift winds showed that a closed circulation existed between 799 mb and 600 mb. These CDW observations helped forecasters not be fooled by the unremarkable blob of low clouds and refer to the system as "Tropical Cyclone 08S" (which was a tropical depression at the time).

If you're interested in accessing satellite images that include cloud-drift wind data, you can get the latest imagery from the Cooperative Institute for Meteorological Satellite Studies (CIMSS)(link is external) site (look for "Winds & Analyses" for any of the tropical basins). A variety of CDW products are available (they're not all based on infrared imagery), and now that you have a little background on CDWs and their applications, let's look at the technique of retrieving winds from various types of satellite imagery.
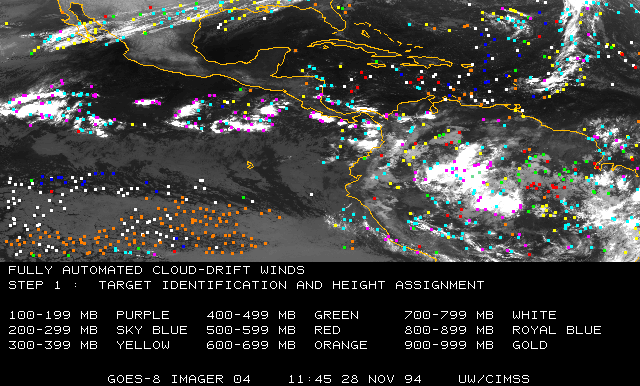
As its name suggests, cloud-drift winds are derived from a sequence of satellite images. In the simplest sense, you could spot a cloud and watch it move with time; but, as you can imagine, in reality, it's not really that straightforward. As an example, I'll describe the technique for retrieving winds in the lower to middle troposphere from infrared satellite data. First, the technique requires three successive images (the images are typically 30 minutes apart, but can be more frequent). Next, "target clouds" are selected according to brightness gradients (large gradients in brightness, for example, typically mark cloud edges). The pressure altitudes of the cloud targets are then estimated from the intensity of infrared radiation detected by the satellite.
An important caveat here is that the brightness gradients associated with candidate targets must remain relatively consistent in time, which means that not all clouds provide viable targets. To get a feel for what a sample of suitable cloud targets might look like, check out the dots on the infrared satellite image below. Indeed, multilayered clouds (decks of low, middle, and/or high clouds lying over the same geographical area) are eliminated as potential targets because trying to assign altitudes to multilayered clouds poses nightmarish challenges. So, ultimately, we can't accurately determine CDWs everywhere using infrared imagery because of these challenges, and the fact that some areas have no cloud cover at all.

Fortunately, we're not limited to infrared imagery for CDW observations. As you already know, loops of water-vapor images can be used to assess winds in the upper troposphere (even without using a formal CDW technique). For example, study this loop of water-vapor images of Hurricane Isabel(link is external) that spans from 1415Z on September 13, 2003, to 1215Z on September 16 (the interval between successive images is two hours). For the most part, the high cloud-tops associated with Hurricane Isabel make up the prominent feature in the Atlantic Ocean (remember that high cloud-tops "contaminate" water-vapor images). Without high clouds to mark the upper-level steering winds along the path of Isabel, however, water-vapor imagery becomes indispensable because it allows us to follow "vapor targets" (like cloud targets on infrared imagery) in time. Following "vapor targets" allows us to deduce the speed and direction of upper-level winds over tropical seas. Indeed, by looking at the loop, you get the idea that Isabel encountered upper-level winds blowing from the west (noted in the first paragraph of this NHC discussion(link is external)) that disrupted and weakened the westbound storm.
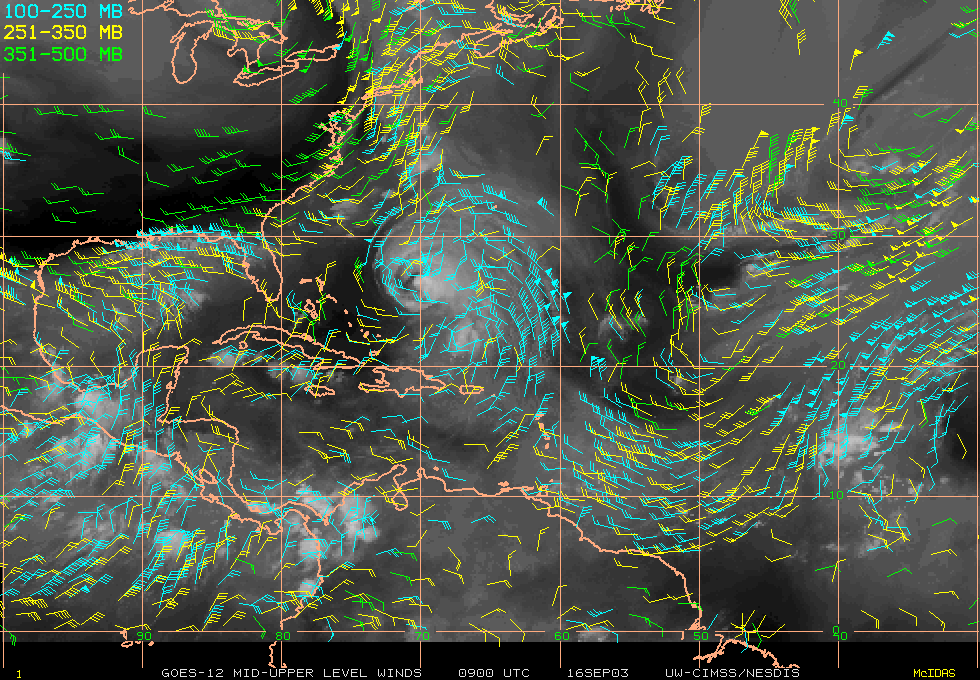
Forecasters use such qualitative approaches for assessing middle- and upper-tropospheric winds frequently when looking at water-vapor loops, but quantitative cloud-drift wind observations can be determined from water-vapor loops, too. The schemes used to generate middle- and upper-tropospheric winds from water-vapor loops are similar to the technique used to generate lower-altitude winds from infrared-satellite loops. For starters, three successive water-vapor images are required. From this loop, horizontal gradients in water-vapor (or high cloud tops) that remain coherent in time serve as potential "vapor targets." Note that even though many more "vapor targets" appear on this image compared to the image of cloud targets on infrared imagery above, many of the vapor targets end up being removed because of various quality control issues. After applying the same principles involved in retrieving CDWs from infrared imagery, out pops water-vapor images with middle to upper tropospheric winds -- just like the one below that shows upper-level winds from the west disrupting Hurricane Isabel at 09Z on September 16, 2003.

The different colors of the wind barbs correspond to their layers as described by the key at the top left of the image. It's clear that ahead of Isabel (to its west), winds above 500-mb were from the west and southwest, which disrupted the high-altitude circulation of the storm just as we noted from the water-vapor loop above. Note however, that color schemes for plotting various layers of cloud-drift winds can vary from Web site to Web site.
Cloud-drift winds aren't limited to just traditional infrared and water-vapor imagery, though. On the CIMSS Web site, there are products involving shortwave infrared and visible radiation(link is external) that become available when active tropical cyclones exist. The upside to cloud-drift winds from visible imagery is that the higher resolution of visible imagery allows for smaller cumulus clouds to aid in tracking low-altitude winds. Cloud-drift winds based on shortwave infrared and visible wavelengths can help forecasters get a glimpse of the low-level wind fields in and around tropical cyclones, and can be empirically adjusted to the surface to estimate the surface wind field of a tropical cyclone (recall the contribution from CDWs to the H*Wind analysis toward the beginning of the page?).
In the final analysis, assessing CDWs at a variety of wavelengths (corresponding to those that create water-vapor and infrared imagery, as well as shortwave infrared and visible imagery if available) gives forecasters a more complete picture of winds throughout the depth of the troposphere. Such a "multi-channel" approach was essential for assigning heights to potential cloud targets. But, the utility of the multi-channel approach in satellite remote sensing has broader applications, which we're about to investigate.
Explore Further...
Cloud-Drift Winds on the Web
The CIMSS site is a great source for accessing cloud-drift wind imagery, if you're interested in doing so. As an example, for the Atlantic Basin here are the latest middle- and upper-tropospheric winds(link is external) based on water-vapor imagery, and the latest lower- and middle-tropospheric winds(link is external) based on infrared imagery. Products based on visible and shortwave infrared radiation are often unavailable since they're posted only when tropical cyclones are active in a particular basin. Even if CDWs based on visible and shortwave infrared(link is external) are not available for the Atlantic Basin, you can navigate to the other basins using the menus provided to see what you can come up with (by the way, CDWs based on infrared and water-vapor imagery are also available from the menus on this page).