Prioritize...
By the end of this section, you should be able to discuss the benefits and drawbacks of using Mercator and Lambert conformal map projections to track tropical cyclones (particularly, where each type of projection has limited distortion). Using a series of images with Mercator projections, you should also be able to calculate an approximate speed of tropical cyclone movement over a fixed period of time.
Read...
The fact that Earth is a sphere presents some hurdles for map-makers (and weather forecasters). Trying to accurately depict our spherical Earth on flat maps brings some real challenges, and the resulting process is always imperfect. Because of these imperfections, many types of map projections exist. Depending on the type of map projection, it is possible to minimize (or, in some cases, eliminate altogether) distortions in shapes, areas, distances and directions (the "Big Four" that map-makers worry about). But, no single map projection accurately preserves them all. Indeed, minimizing or eliminating distortions in one or two of the "Big Four" often results in gross distortions in the others.
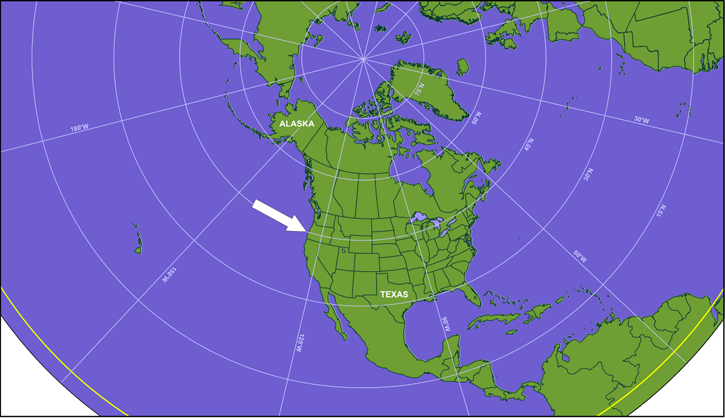
Because a number of different projections exist, weather forecasters must always be aware of the benefits and limitations of viewing data displayed on various map projections. From your previous studies, you should be familiar with the polar stereographic projection, which is commonly centered on the North Pole. The benefit of such polar stereographic projections is that it allows forecasters to track the movement of weather systems in the middle and high latitudes over long distances (for example, check out this enhanced infrared satellite loop of the entire Northern Hemisphere displayed on a polar stereographic projection). It is, however, important for forecasters to get their bearings when looking at polar stereographic projections because compass directions are not preserved. For example, in the polar stereographic map below, the arrow off the Pacific Coast of the United States represents a wind blowing from due west (270 degrees). An arrow representing a due west wind off the East Coast of the U.S. would be oriented quite differently, though, because it still would need to parallel the nearest latitude circle.

Polar stereographic map projections are commonly used by forecasters when tracking weather features in the middle and high latitudes, but not in the tropics. Why are polar stereographic projections not favored by tropical forecasters? For a clue, check out Texas and Alaska on the map above. They look to be nearly the same size, but in reality, Alaska is more than twice the size of Texas. Indeed, polar stereographic projections like this one suffer from gross size distortions farther away from the North Pole, and that's a problem when analyzing tropical weather patterns.
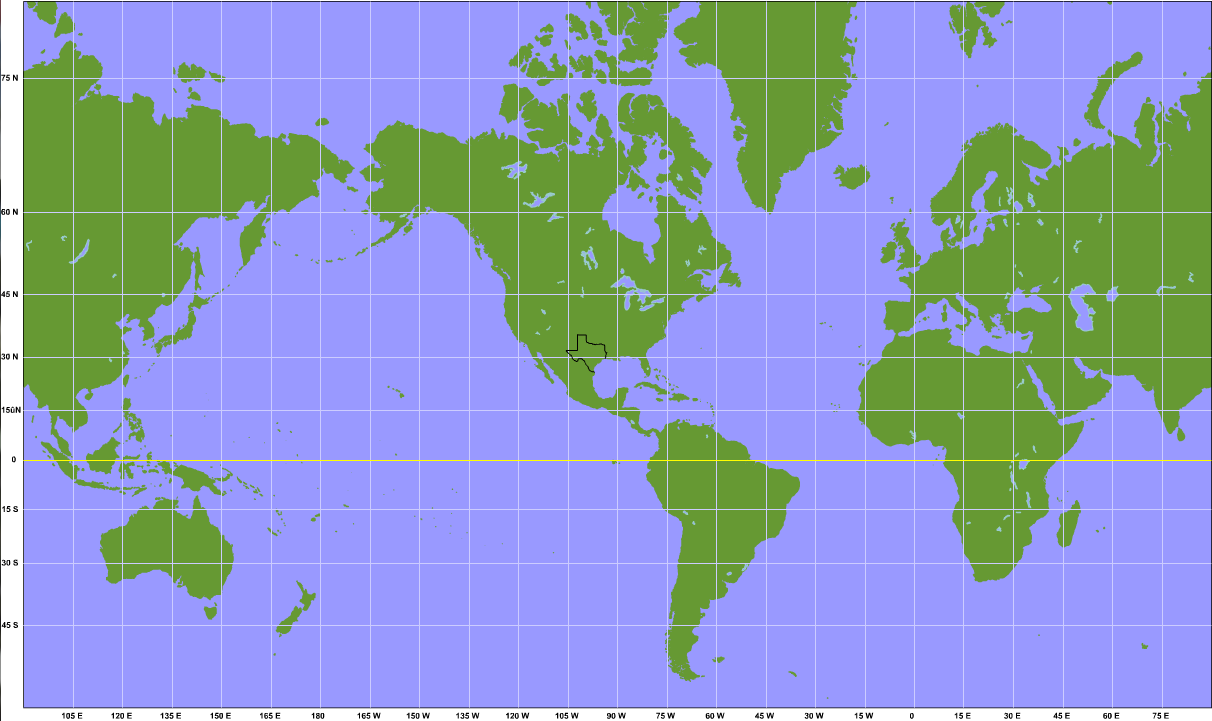
Tropical forecasters, therefore, turn to Mercator projections like the one below to track tropical weather systems. Distance distortions in the tropics are very limited on Mercator maps; however, they have major distance distortion problems at higher latitudes, as the image below indicates. As a result, Alaska completely dwarfs Texas (far more than in reality). At even higher latitudes, Greenland looks to be about the size of Africa, but in reality, Africa is more than 13 times larger than Greenland. At the extreme, the North and South Poles (single points, in reality) appear as straight lines at the top and bottom of Mercator maps. Now that's distortion!

The limited distortion in the low latitudes is one reason why the Mercator projection is the map of choice for tropical forecasters. Another reason for its favored-map status is the relative ease in plotting and interpreting the tracks of tropical cyclones. That's because any line drawn between two points on a Mercator map preserves compass direction (formally called a rhumb line). For this reason, tracking tropical storms and hurricanes on Mercator maps is standard practice at the National Hurricane Center. For example, check out this five-day forecast for Hurricane Katia, issued at 5 A.M. EDT on August 31, 2011. The fact that Katia was moving toward the west-northwest, and was predicted to take a turn toward the northwest in the next five days is easy to discern because of the use of a Mercator map. The cost of preserving compass directions, however, is the large distortions at higher latitudes.
To understand why distances are accurately represented in the tropics (and not at higher latitudes), you need to have a general understanding of the technique for creating Mercator projections. The common Mercator map is a cylindrical projection that accurately represents east-west distances along the equator (in other words, the distance scale is true). Nonetheless, distances are reasonably accurate within 15 degrees of the equator, making the Mercator projection ideal for the tropics. I should point out that Mercator projections can be constructed so that east-west distances are accurate along two standard latitudes equidistant from the equator.
Because horizontal distances in the tropics are depicted with reasonable accuracy, it is possible to look at satellite loops of hurricanes and do a quick rough calculation of the storm's westward speed across the Atlantic. The key to these calculations is realizing that at the equator, Earth's circumference is 24,901 statute miles, and we have 360 degrees longitude in total. Simple division tells us that one degree longitude at the equator is equivalent to 69 statute miles (or 60 nautical miles). As we move away from the equator, this distance changes, but in the tropics, it serves as a good approximation (especially within about 15 degrees of the equator). If you're wondering, one degree latitude is always equivalent to these values.

Yes, the method is pretty old-fashioned but it's fairly simple and can be quite useful. Perhaps the simplest way to make these estimates is to literally put one finger on the center of the hurricane in the first image of a satellite loop and then your thumb on the storm's center in the last image (as demonstrated by Lee Grenci on his "old school" computer monitor). Then, simply estimate the number of longitude degrees between your finger and thumb, multiply by 69 statute miles (or 60 nautical miles), and divide by the time (in hours) in order to calculate the forward speed in statute miles per hour (which most folks would just call "miles per hour.") or nautical miles per hour (which most folks would just call "knots").
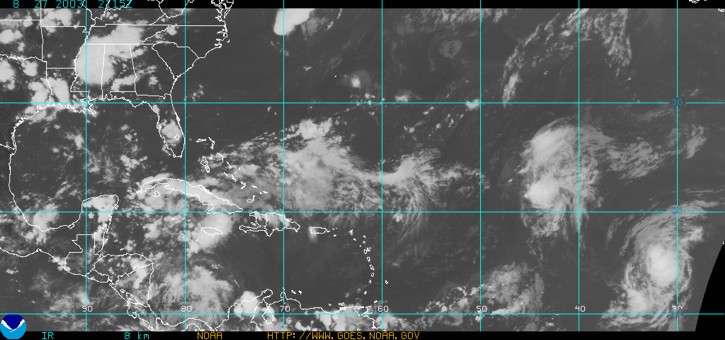
For example, check out this loop of infrared satellite images showing Hurricane Fabian from 21Z on August 27, 2003 through 21Z on August 29, 2003. Fabian was moving roughly westward near 15 degrees North latitude during this time, and by my estimate, moved from about 31 degrees West to about 45 degrees West (a total of 14 degrees longitude). If we wanted the forward speed in knots (nautical miles per hour), multiplying 14 degrees by 60 nautical miles per degree gives a total of 840 nautical miles in a 48-hour time period, for an average speed of about 17.5 knots (20 miles per hour). Of course, we now have sophisticated computer models that predict positions and movement of tropical cyclones, but for short-term forecasts (say, less than 12 hours), extrapolating the storm's current motion can sometimes be quite useful (possibly even yielding superior results to computer model guidance).
Extrapolating current tropical cyclone movement can be helpful when the storm's environment doesn't change much, but tropical cyclones often change directions as their steering environments change. Furthermore, tropical cyclones don't always move from east to west, nor do they always stay in the tropics! Many tropical cyclones eventually curve toward the poles (as Hurricane Fabian eventually did) As they do so, Mercator maps become less useful because of the increasingly large distortions at higher latitudes. For example, check out this three-day forecast for Hurricane Karl (2004) from the National Hurricane Center plotted on a Mercator projection. At the latitudes where Karl was predicted to travel, it's pretty difficult to get a feel for the storm's predicted forward speed because the distances on the map are so highly distorted.
So, what do forecasters do as storms enter the middle latitudes? They turn to the Lambert conformal projection, which is a conical map projection that preserves distances along two standard latitudes (typically 30 and 60 degrees north -- note that the standard latitudes lie on the same side of the equator). Moreover, distortion is minimized in a narrow band along the two standard latitudes, but it increases with distance from these standard parallels. As its name suggests, the map projection is conformal, meaning that it preserves the proper angles between intersecting lines and curves and thus tends to preserve the shapes of relatively small areas better than other kinds of projections. Even though Lambert conformal projections preserve the shapes of small areas, it distorts their sizes, particularly those areas that lie relatively far from the standard latitudes.

In most of the mid-latitudes, however, distortion is relatively low on Lambert conformal projections (it's not nearly as significant as it is in the deep tropics). For this reason, meteorologists frequently take advantage of the shape-preserving nature of the Lambert conformal projection as tropical cyclones move out of the tropics into the mid-latitudes. Preserving the shapes of tropical cyclones as they travel to higher latitudes (on satellite images, for example) is important to forecasters because they continually look for physical changes in these weather systems to help them get a better handle on their current and future states.
Now that we've covered the map projections most commonly used by tropical forecasters, I want to now talk briefly about the computer models used in tropical forecasting. If you pay close attention, you'll note the frequent use of Mercator maps to display model data in the tropics. You'll also note that some of the commonly-used forecast plots are a bit different than what you may already be familiar with. Keep reading!