Lesson 7: Mid-Latitude Weather Systems
Motivate...
At one point or another, you've probably heard a weather forecaster use the term "low-pressure system," but perhaps you've never heard it called by its formal name -- mid-latitude (or extratropical) cyclone. Indeed, as long as you live in the middle latitudes (where the United States, most of Canada, Europe, and Asia lie in the Northern Hemisphere), the phrase "low-pressure system" really refers to a mid-latitude cyclone. Mid-latitude cyclones are responsible for much of the "active" weather that you experience from day to day. If it's raining, snowing, very windy, etc., there's a good chance that a mid-latitude cyclone is involved somehow! In the winter, weather with mid-latitude cyclones can be especially dramatic. For example, check out the photo below, taken after the "Snowmageddon [1]" (not a technical term) storm that struck the mid-Atlantic states on February 5-6, 2010. When the storm finally moved out to sea, many of the affected residents emerged to find snow totals between 20 and 39 inches!

However, impacts from mid-latitude cyclones are not just limited to winter weather. In the springtime, another threat emerges. Strong mid-latitude cyclones moving through the central United States can provide ideal conditions for large outbreaks of severe weather, including tornadoes. Indeed, that was the case when a strong mid-latitude cyclone swept across the central and eastern U.S. from April 25-28, 2011 [5]. Over the three-day period, 358 tornadoes were spawned by thunderstorms associated with this strong low pressure system.
So, it's pretty easy to see why weather forecasters would be interested mid-latitude cyclones! Much of what we know about how mid-latitude cyclones work is based on a model (called the "Norwegian Cyclone Model") developed by Jacob Bjerknes and Halvor Solberg in 1922, and there's no doubt that this model has shaped the way that meteorologists understand the weather that occurs in the middle latitudes.
While we experience the weather that occurs with mid-latitude cyclones at the surface of the earth, in reality, mid-latitude cyclones are complex, three-dimensional systems. We'll talk a little bit about some of the mechanisms aloft that drive the formation and evolution of mid-latitude cyclones, but I'll spare you most of the gory details. Instead, we'll focus mostly on the aspects of mid-latitude cyclones that people experience on a regular basis. In particular, we'll talk more about air masses and fronts and focus on the types of weather that often occur with various types of fronts. We'll also explore how mid-latitude cyclones can cause a variety of hazardous winter weather and discuss some important winter weather safety tips.
This lesson will require you to put some "pieces together" from previous lessons, including convergence and divergence, air masses, fronts, gradients, and temperature advection, so we'll do a little reviewing along the way, too. Of course, if you feel rusty on any of these topics, don't hesitate to go back and review. Up first, I want to establish a framework about why mid-latitude cyclones exist in the first place. Let's get started!
Upper-Air Patterns
Prioritize...
At the end of this section, you should be able to define the jet stream, describe the movement of weather systems in the middle latitudes, and describe the differences between a meridional pattern and a zonal pattern (as well as their consequences for mid-latitude cyclone development).
Read...
Way back when you studied the global controllers of temperature, you learned that lower latitude locations (closer to the equator) receive more direct incoming solar radiation throughout the year (ignoring clouds) than higher latitude locations closer to the poles. The end result is that lower latitude locations tend to be warmer and experience less seasonal variability in temperature than higher latitude locations. Of course, that discussion was focusing on surface temperature, but the same holds true above the surface in the troposphere: Lower latitude air columns tend to be warmer than those at higher latitudes.
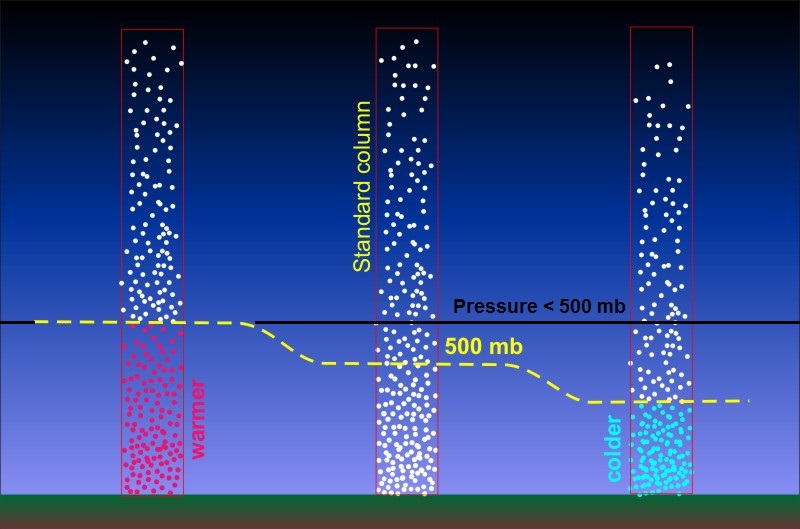
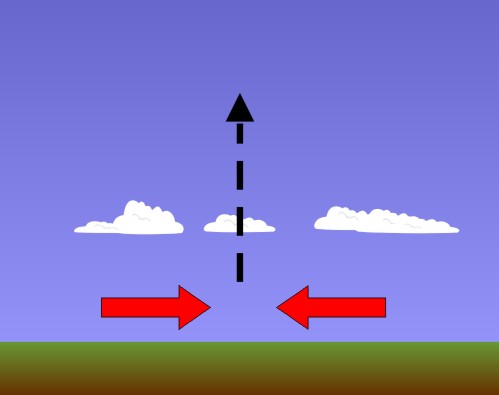
The resulting temperature gradient throughout the troposphere in each hemisphere (warmer at lower latitudes and cooler at higher latitudes) has consequences, namely in helping to create horizontal pressure gradients aloft. To see what I mean, examine the schematic below, which shows the air molecules in three idealized, sealed air columns. Imagine that the column on the left is a warm, low-latitude air column, the column in the middle represents an air column in the middle latitudes, and the column on the right represents a cold, high-latitude air column near the North Pole.

Now, recall that pressure always decreases with increasing height in the atmosphere (the higher you go up, the fewer air molecules are above you). So, pressure decreases with increasing height in each of these air columns, but notice how the pressure has decreased from the value at the surface (likely near 1000 millibars) to 500 millibars at a different altitude in each column. The altitude where the pressure is 500 millibars is highest in the warmest column and is lowest in the coldest column. Because colder air is denser, air molecules huddle closer together at lower altitudes in colder air columns, meaning more of the column's weight is distributed in the lower part of the column. Meanwhile, in warmer columns, air molecules are less tightly packed and more spread out vertically in the column. This observation is along the lines of the balloon experiment [6] we conducted earlier in the course, too. When the burner was turned on and the air warmed up, the number of air molecules in the bottle and balloon didn't change, but the balloon expanded as the air molecules occupied a larger space (the air became less dense as it warmed up).
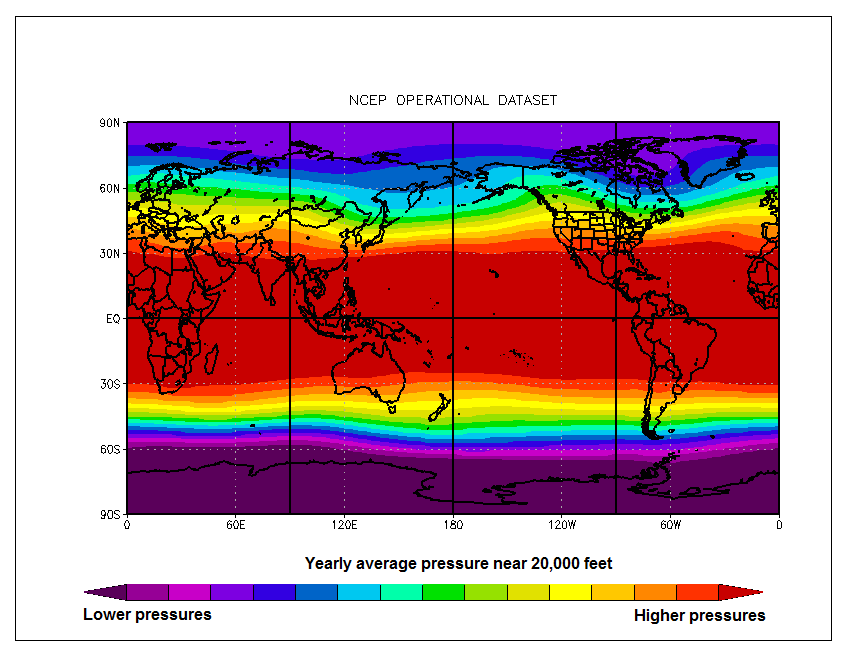
The end result is that pressure decreases more rapidly with increasing height in colder air columns than in warmer ones, which has consequences for horizontal pressure gradients aloft. In the schematic above, note the altitude where the pressure is 500 millibars (marked by the yellow dashed line) in the warm air column. In the colder air columns, the pressure at the same altitude [7] is some value less than 500 millibars (and would be lowest at that altitude on the coldest air column) because fewer air molecules exist above that altitude. So, at any given fixed altitude above the surface in the troposphere, on average, the pressure will be lower in the colder air columns closer to the poles than in the warmer columns closer to the equator, as suggested by this map of approximate yearly average pressure near 20,000 feet [8].
The map of approximate yearly average pressure near 20,000 feet also shows that horizontal pressure gradients exist over the middle latitudes, resulting in a pressure gradient force aloft that points from low latitudes toward the poles. But, of course, air doesn't flow directly from low latitudes toward the poles in line with the pressure-gradient force. The Coriolis force deflects the air toward the right in the Northern Hemisphere (toward the left in the Southern Hemisphere), which creates a predominant west-to-east flow aloft in the middle latitudes of the Northern Hemisphere. In fact, this flow culminates in something near the top of the troposphere that you may have heard of -- the jet stream, which is a relatively narrow channel of fast winds that blows generally from west to east in the upper troposphere.

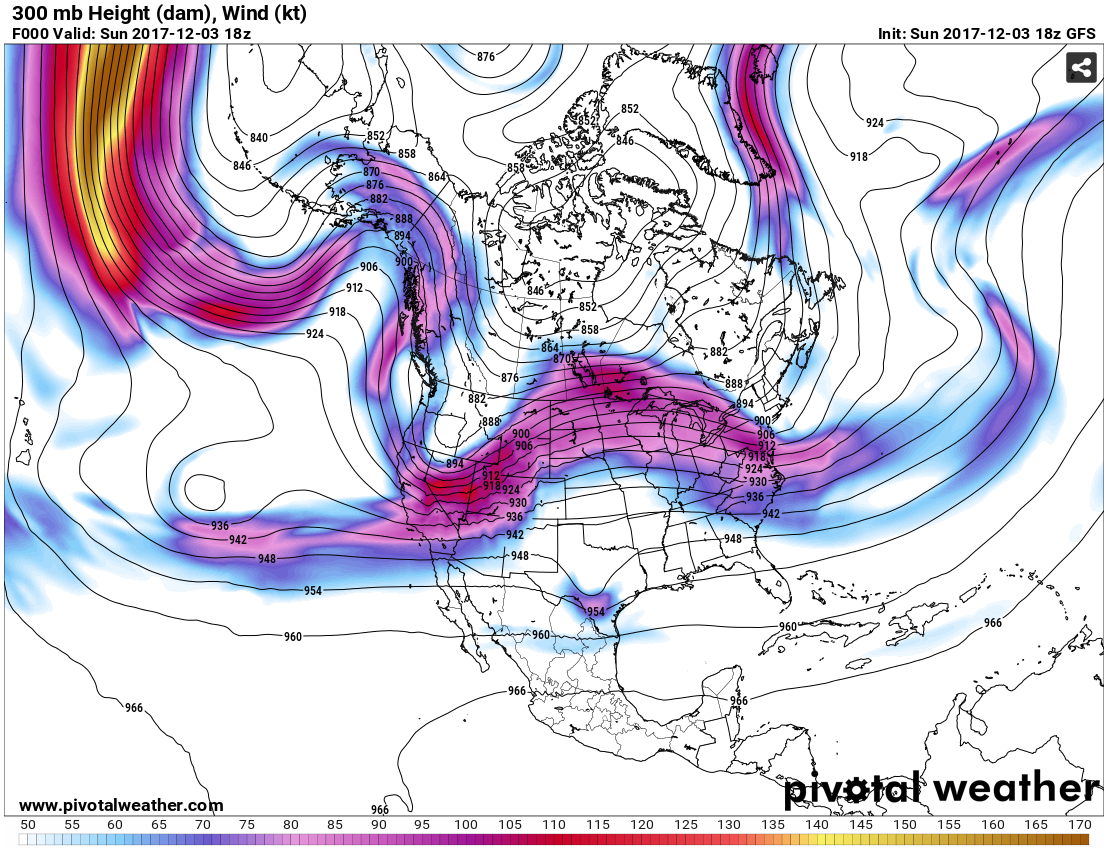
The image above shows a computer model's analysis of wind direction and speed near the top of the troposphere (near 30,000 feet) at 18Z on December 3, 2017. The channel of fastest winds (shaded) blowing generally west-to-east across the United States marks the jet stream. Note that wind speeds in the jet stream at this time were greater than 100 knots (115 miles per hour) in the areas with dark purple and red shading. This general west-to-east flow aloft is the reason why weather systems tend to move from west-to-east across the middle latitudes of the Northern Hemisphere.
But, the jet stream isn't just important for the movement of weather systems. Many commercial airplanes fly at the altitudes where the jet stream typically lies, and its west-to-east flow gives planes traveling from the West Coast toward the East Coast of the U.S. a strong tailwind, resulting in a faster trip and lower fuel consumption. Meanwhile, flights from the East Coast toward the West Coast often have a significant headwind (they're flying against the wind), which increases fuel consumption and results in longer flight times.
When looking at the image above, you may have noticed that the winds aloft don't blow perfectly west to east in the middle latitudes. In fact, the flow looks kind of "wavy," doesn't it? Indeed, we live at the bottom of a dynamic ocean of air, and like in oceans of water, waves of all sizes ripple mainly from west to east across the middle latitudes. If we look at a zoomed-out version of the model analysis of upper-level winds above [9] showing more of the Northern Hemisphere, you can see that the jet stream isn't some nice, tidy, steady current of winds. It has lots of waves and some interruptions. The waves and the changes in wind speed result in some localized accelerations and decelerations of winds aloft, which result in areas of upper-level divergence and convergence. As you've learned, divergence and convergence aloft are important to the formation of low- and high-pressure systems, respectively.

In particular, weather forecasters try to keep tabs on regions aloft where upper-level divergence is occurring because they tend to be regions of active weather, and they can help incite the development of surface low-pressure systems by removing weight from local air columns and reducing surface pressure. In fact, if you've heard a weather forecaster refer to an "upper-level disturbance," they were likely referring to a feature in middle or upper troposphere that was causing divergence aloft and leading to some kind of active weather.
When the jet stream gets particularly wavy, meteorologists call it a meridional pattern because air flow is mostly parallel to meridians (lines of longitude) in some areas. In meridional patterns, areas of divergence (and convergence) aloft become more pronounced, which favors the formation of more intense mid-latitude cyclones. On the other hand, when the jet stream is "flatter" (more west to east), meteorologists call it a zonal pattern. In zonal patterns, areas of divergence (and convergence) aloft tend to be weaker, which favors weaker mid-latitude cyclones.
I've skipped a lot of details here because they're beyond the scope of this course, but I at least wanted you to have a basic idea of why the upper-level pattern is important in understanding and forecasting mid-latitude cyclones. The bottom line is that divergence in the upper-level pattern is a critical part of the formation of mid-latitude cyclones because it works to reduce surface pressure. Although we've covered this idea before, we're going to explore it further in the next section. Read on!
Highs, Lows, and Weight Management
Prioritize...
At the completion of this section, you should be able to describe the general pattern of convergence and divergence within an air column located over steady-state, strengthening, and weakening high- and low-pressure systems. You should also be able to explain how (for example) a surface low pressure system deepens as a result of unequal magnitudes of convergence and divergence.
Read...
Previously, you learned that surface low-pressure systems are essentially "lightweights." Air columns at the center of the low weigh a bit less than surrounding air columns. On the other hand, surface high-pressure systems are "heavyweights." Air columns at the center of the high weigh a bit more than their surrounding air columns. You also learned that air swirls inward toward lower pressure near the surface, and that this convergence adds weight to local air columns (which is a problem for a developing low).
Imagine for a second that air converges into a column over a surface low all the way from the ground up to the tropopause. Using typically observed values for convergence, such a concentration of mass in this column from convergence would result in an increase in sea-level pressure on the order of 500 millibars over the course of 24 hours (I'm skipping the details of the calculations). Given what you know of the typical range for sea-level pressures, you should realize that such a huge pressure change is completely unrealistic. Indeed, typical sea-level pressure changes amount to only a few to several millibars in one day.
Meteorologists have coined a term for cases with "extreme" sea-level pressure changes with rapidly-developing low-pressure systems (such as occasionally happens along the Atlantic Coast during winter). When sea-level pressure in a rapidly-developing low-pressure system decreases by at least 24 millibars in 24 hours, meteorologists call it "bombogenesis" (pronounced "bomb-o-genesis") because of the "explosive" nature of the weather that occurs with such storms (typically very strong winds and heavy precipitation). Such meteorological "bombs," are extreme cases, however, and may only happen a few times a year, even in parts of the globe prone to such rapid development.
Ultimately, however, such huge sea-level pressure tendencies are so rare because low- and high-pressure systems have "checks and balances" that limit their ability to strengthen. For example, recall that divergence aloft removes weight from local air columns and reduces sea-level pressure (acting alone, creating a weak low at the surface). But, in order to avoid a significant depletion of air from local air columns, air spirals in toward low pressure at the surface. This convergence of air in the lower part of the air column works against the divergence aloft and limits its ability to reduce sea-level pressure.
Thus, a much more realistic profile of convergence and divergence in the column of air over the center of a developing low-pressure system has a more balanced look to it. In the figure below, examine the left panel which shows the pattern of convergence and divergence characteristic of a "steady-state" low-pressure system (neither strengthening or weakening). Surface low-pressure systems which are neither strengthening or weakening have convergence near the surface with an equal magnitude of divergence aloft. On the other hand, check out the right panel below which illustrates a realistic profile of the air column at the center of a steady-state high-pressure system. Surface highs have divergence in the lower half of the troposphere and convergence in the upper half of the troposphere.

For sea-level pressure to change, either convergence or divergence must get the upper hand within an air column. For a modestly developing low-pressure system (sea-level pressure decreases in time), the total amount of air diverging from the low's central air column at high levels (a weight loss) must exceed the total amount of air converging into the low's central air column at low levels (a weight gain). Thus, there must be a net divergence and a net loss of weight, allowing the sea-level pressure to decrease and the low to "deepen" (intensify). On the other hand, for a developing high-pressure system (sea-level pressure increases in time), the total amount of air converging into the high's central air column at high levels (causing weight gain) must exceed the total amount of air diverging from the column at low levels (a weight loss). There must be a net convergence into the column and a resulting weight gain.
Consider the following two graphs below. These graphs show a plot of convergence and divergence with height. Convergence is shaded in red while divergence is shaded in blue. To figure out the net convergence or divergence, compare the sizes of the shaded areas. If the blue area is greater than the red area, then there is more mass divergence out of the column than mass convergence into the column. If the red area is greater than the blue area, then there is more mass convergence into the column than divergence out of the column.

In the plot (above) on the left, notice first that the divergence and convergence profile is associated with a surface low pressure system. How do we know? We know that air swirls in and converges toward the center of low pressure in the lower atmosphere, and this profile shows low-level convergence. But, also notice that the total divergence aloft is much larger than the total convergence, so the column will lose weight over time. That weight loss means that sea-level pressure will decrease and the low-pressure system is deepening (becoming stronger).
We know that the graph on the right above is associated with a surface high-pressure system because there's divergence in the lower part of the atmosphere. But, also notice that the region of convergence aloft is larger than the region of divergence, so the column will gain weight over time. This means that the sea-level pressure will rise in time, further strengthening the high-pressure system.
On the other hand, what if there was a low-pressure system in which the convergence in the lower half of the troposphere was exceeding the divergence aloft? The low would weaken in time because the central air column would be gaining more weight from convergence than it was shedding via divergence aloft. A similar argument holds true for a high that is shedding more weight through divergence in the lower half of the troposphere than it is gaining from convergence aloft. Such a high would weaken in time because sea-level pressure would decrease.
The bottom line is that whenever you're thinking about changes in sea-level pressure, you need to think about weight management. Obviously, divergence and convergence in the upper-half of the troposphere play a pivotal role in the fate of surface low- and high-pressure systems, so weather forecasters are always looking at upper-air patterns to spot regions of convergence and divergence. To give you more of a three-dimensional view of how the vertical patterns of convergence and divergence with low- and high-pressure systems fit together, check out the schematic below.

In particular, forecasters are always on the lookout for waves and accelerations or decelerations in the winds aloft, often referred to as "upper-level disturbances" which cause divergence aloft (marked by the blue shaded area in the image above), which cause air columns to shed weight and sea-level pressures to decrease. The resulting low-level convergence and rising air frequently causes the clouds and precipitation typically associated with low-pressure systems. On the other hand, regions of convergence aloft cause sea-level pressures to increase. The resulting low-level divergence and sinking air typically leads to the calm and mostly clear conditions associated with surface high-pressure systems.
Key Concepts to Remember
- "Steady-state" highs and lows have equal amounts of divergence and convergence in their central air columns, resulting in no change in sea-level pressure.
- A strengthening low-pressure system (sea-level pressure decreasing with time) has upper-level divergence that exceeds low-level convergence, resulting in weight loss in the central air columns.
- A weakening low-pressure system (sea-level pressure increasing with time) has low-level convergence in the column that exceeds upper-level divergence, resulting in weight gain in the central air columns.
- A strengthening high-pressure system (sea-level pressure increasing with time) has upper-level convergence in the column that exceeds low-level divergence, resulting in weight gain in the central air columns.
- A weakening high-pressure system (sea-level pressure decreasing with time) has low-level divergence in the column that exceeds upper-level convergence, resulting in weight loss in the central air columns.
So, it's all about weight management, and ultimately low-pressure systems need a source of upper-level divergence to form and thrive, while high-pressure systems need a source of upper-level convergence to form and thrive. But, for these systems (particularly low-pressure systems) to really develop, they need other ingredients, too. Read on!
Cooking Up a Mid-Latitude Cyclone
Prioritize...
After completing this section, you should be able to discuss the ingredients needed for a mid-latitude cyclone to form and thrive. You should also be able to discuss the resulting temperature advections caused by a mid-latitude cyclone's circulation, define the warm sector, and discuss the conditions that bring about the demise of a mid-latitude cyclone.
Read...

Some low-pressure systems become legendary. When mid-latitude cyclones are particularly strong in winter, snowstorms can leave entire regions crippled for days or weeks. The fierce weather and resulting disruption (and perhaps damage and loss of life) leave such an impression that tales of their ferocity get passed on through generations. Have you ever heard of, or did you live through, any of these historic mid-latitude cyclones?
- The ”Children's Blizzard“ of 1888 [10]
- The ”Great Appalachian Storm“ of 1950 [11]
- The ”Great Blizzard“ of 1978 [12]
- The ”Storm of the Century“ (Blizzard of 1993) [13]
- The ”Blizzard of 2016“ [14]
If you read any of the descriptions of these historic storms, perhaps you noticed a couple of things. First, a few of them impacted the East Coast of the United States. Second, several of the descriptions reference "temperature gradients" or quick changes from warmth to cold. The description of the "Children's Blizzard" of 1888 is particularly poignant in this regard. Residents of Minnesota described a "beautiful mid-winter day" that was "warm enough to melt the snow." But, when frigid, Arctic air arrived rapidly in the afternoon, temperatures quickly plunged below 0 degrees Fahrenheit, with piercing winds and heavy snow. Hundreds of people died because they were caught unprepared out in the storm (it's called the "Children's Blizzard" because many of its victims were school children who were trying to make it home from school).
The mention of temperature changes and the frequent appearances of East Coast storms on the list above isn't a coincidence. The East Coast is an area that can be prime for explosive cyclone development in winter. But, just what ingredients are necessary for the formation and development of formidable mid-latitude cyclones?
- A source of upper-level divergence to reduce weight of local air columns (an "upper-level disturbance")
- A large surface temperature gradient (in other words, a front)
That's it! The basic ingredients for a mid-latitude cyclone are an upper-level disturbance that causes divergence aloft and a surface front (remember that fronts mark boundaries between contrasting air masses [15], so they naturally have large temperature gradients). More specifically, a mid-latitude cyclone is born when an upper-level disturbance passes over a surface stationary front, creating a weak area of low pressure along it as divergence aloft reduces the weight of local air columns.
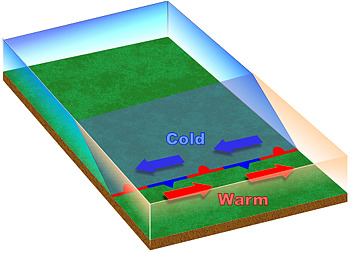
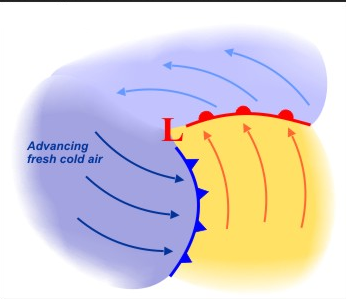
Imagine an idealized stationary front [16] with a colder air mass north of the front and a warmer air mass to the south. When divergence aloft from an upper-level disturbance creates a weak surface low, a circulation develops. How? Remember that the pressure-gradient force and Coriolis force combine to create a counterclockwise circulation around low pressure in the Northern Hemisphere, while friction near the surface causes winds to cross local isobars in toward lower pressure. The circulation begins to move the edges of the air masses as the southerly flow east of the low tends to cause cold air to retreat northward and warm air to begin advancing northward. Meanwhile, on the western side of the low, colder air starts to plunge southward.

So, the stationary front is no longer "stationary" as air begins to move around the low. East of the low, a warm front (which marks the retreat of colder air) develops as cold air retreats northward, allowing warm air to advance. Meanwhile, a cold front (which marks the leading edge of advancing cold air) forms west of the low as cold air begins to plunge southward. Gradually, the cold front moves counterclockwise around the low as colder air wraps around its southern side (depicted on the right above), helping to form a well-defined warm sector (the area ahead of the cold front and south of the warm front [17] for a cyclone in the Northern Hemisphere), where it's relatively warm and often humid, especially in the warmer months. When a cold front passes your location, the transition from the warm sector to the colder air behind the cold front can be really dramatic!

Ultimately, the low's circulation results in a pattern of temperature advection (recall that temperature advection is the movement of warm or cold air by the wind) similar to what's shown in the idealized schematic on the right. The strongest warm advection occurs north of the warm front, while the strongest cold advection occurs behind the cold front. These temperature advections help to modify the upper-air pattern (depicted by the thick, black contours on the schematic) and strengthen the upper-level disturbance that causes the upper-level divergence. With greater upper-level divergence, sea-level pressure decreases further and the low gets stronger, which strengthens pressure gradient, the low-level winds, and the temperature advections. Stronger temperature advections further strengthen the upper-level disturbance, and so on. Essentially, strong temperature gradients are required for mid-latitude cyclone development because the temperature advections play a key role in a positive feedback process that strengthens the cyclone (the cyclone strengthens itself).
But, as you know, the atmosphere has checks and balances that limit the strength of the cyclone. For example, as the surface low strengthens, the stronger winds in the lower troposphere create stronger convergence in toward the center of the surface low (which adds weight to local air columns), thereby slowing the low's intensification somewhat.
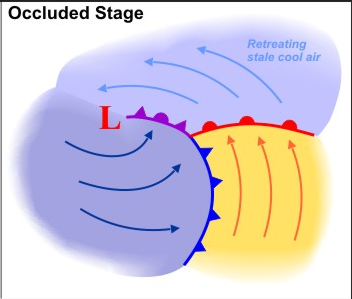
Of course, all good things must come to an end, and a low can't just strengthen forever. What brings an end to a mid-latitude cyclone's life? First of all, the main source of upper-level divergence eventually moves away. Once that happens, air columns near the center of the low are gradually overwhelmed by convergence and sea-level pressures increase. Secondly, the low ends up getting somewhat separated from the large temperature gradients associated with the fronts. This separation occurs late in the cyclone's life, called "occlusion" (or "the occluded stage"). During the occluded stage, you'll see a purple occluded front on surface weather maps, which marks the boundary between "stale" cool air north of the warm front, and the "fresher" cold air being ushered in behind the cold front. Note how in this schematic of the occluded stage [18], the low is no longer located in the zone of largest temperature contrasts as it was earlier in the low's life [19].
So, removed from strong surface temperature gradients and lacking upper-level divergence, the low weakens and dies, but it has done its job. You might be asking yourself, "A mid-latitude cyclone has a job?" Indeed, it does! By transporting warmer air poleward and colder air equatorward, the low has helped to reduce horizontal temperature contrasts between cooler high latitudes and warmer low latitudes. In other words, mid-latitude cyclones help the atmosphere strive for balance by reducing hemispheric temperature gradients.
The importance of large temperature gradients in the formation and development of mid-latitude cyclones explains why so many "big" storms end up forming along the East Coast of the United States. In the winter, there's often a naturally large temperature gradient near the coast. The water of the Atlantic, which has a high heat capacity as you may recall, tends to be warmer than the chilly land in the Mid-Atlantic and Northeast U.S. The resulting naturally large temperature gradient near the coast creates fertile breeding grounds for strong mid-latitude cyclones.
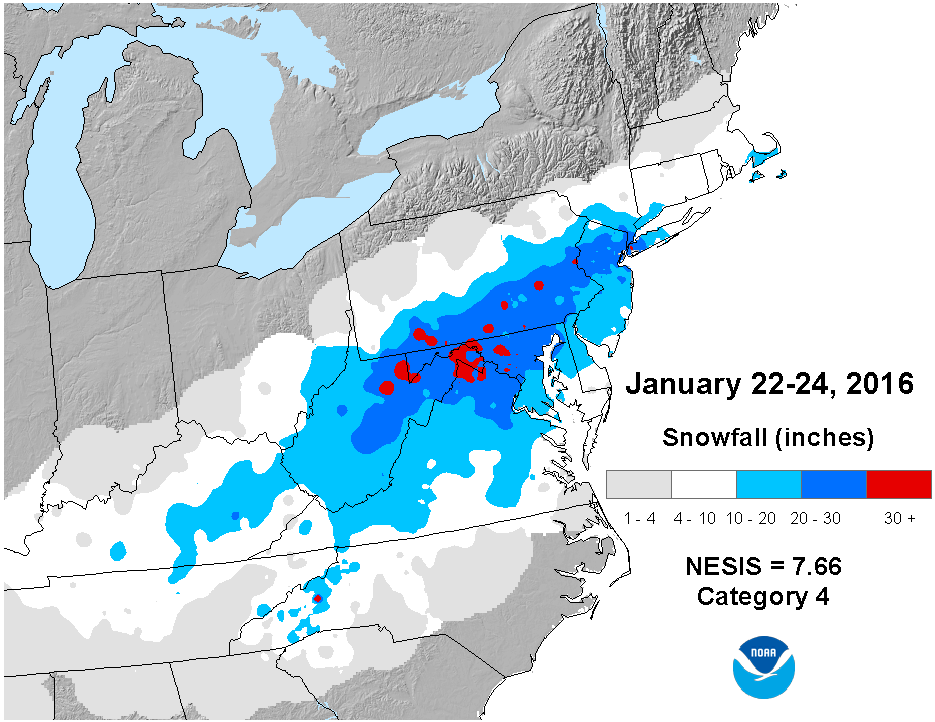
One such storm was the "Blizzard of 2016," which was actually "born" in Texas as a weak area of low pressure along a stationary front. As the low developed and strengthened on its path up the East Coast, it dumped more than 30 inches of snow [20] on parts of West Virginia, Virginia, Maryland, and Pennsylvania. To get a sense for the birth, life, and death of a mid-latitude cyclone, check out this animation of surface maps spanning the life of the Blizzard of 2016 [21]. Note the initial set up -- a "baby" 1009 millibar low along a stationary front in Texas, separating warm Gulf-of-Mexico air (temperatures in the 60s and 70s) from a much colder air mass anchored by the high pressure over Ohio. Over the course of a day, the low becomes much stronger, with a stronger pressure gradient and notable cold and warm advection. By the time the storm was off the Mid-Atlantic coast, it was a fierce 987-millibar occluding low. This storm went from a "baby" low over Texas to a dying low over the Atlantic in a little less than three days (most mid-latitude cyclones last for a few days to a little more than a week).
But, what causes the fierce weather with strong mid-latitude cyclones? The winds are largely explained by a strong pressure gradient. But, what about the heavy precipitation? It all comes down to rising air, and up next, we'll start looking at various sources of rising air associated with low-pressure systems. As it turns out, fronts play an important role in the pattern of rising air with mid-latitude cyclones, so we need to examine fronts further. Read on.
Cold Fronts
Prioritize...
After reading this section, you should be able to describe the structure of a cold front, explain what typically causes rising air near cold fronts, and describe the weather that often accompanies cold frontal passages (including temperature and dew point trends, clouds and precipitation, and winds). You should also be able to describe the difference between katafronts and anafronts.
Read...
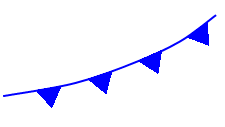
As you just learned, cold fronts form as a natural consequence of the circulation of mid-latitude cyclones the circulation causes a cold air mass to advance on the west (and eventually south) side of the low (in the Northern Hemisphere). You already studied the basics of cold fronts in a previous lesson, primarily the idea that a cold front is the leading edge of an advancing cold air mass. Cold fronts, marked by a chain of blue triangles [22] pointing in the direction of movement (toward the warmer air), often mark the boundary between a maritime-Tropical (mT) and an advancing continental-Polar (cP) air mass or perhaps the boundary between a cP air mass and an advancing continental-Arctic (cA) air mass (the coldest of the cold). As a result, temperatures and dew points often decrease after a cold front passes (as colder, drier air arrives at your location). But, now it's time to look more closely at cold fronts so that we can better understand their other weather impacts.
For starters, what determines whether cold air advances, retreats or just holds its ground? To answer this question, weather forecasters always look at the winds on the cold side of a front. As long as the surface wind on the cold side of a front is blowing at least somewhat toward the front, cold air advances and the forecasters classify the front as cold. However, if cold air advances at a speed less than 5 knots (about 5 miles an hour), forecasters classify the front as "stationary" by convention.
But, air masses aren't just two-dimensional. They are three-dimensional blobs of air, so when cold air advances at the surface, cold air at higher altitudes also advances on warm air. Therefore, the narrow frontal zone that separates the two contrasting air masses must extend upward from the surface. To see what I mean, focus your attention on the cross-sectional profile of an advancing continental-Polar air mass below. The cold front is steepest in the lowest several hundred meters of the atmosphere, with a slope of about 1/100, meaning that elevation increases about 1 kilometer for every 100 kilometers of horizontal distance from the surface front. Then the upward slant relaxes into a much more gentle slope (e.g. 1/300). All along the upward slant of the cold wedge, cold air abuts with warmer air, creating an upward-slanting boundary characterized by large temperature contrasts.
The depth of this frontal zone associated with a cP air mass typically extends to altitudes as high as five kilometers, so there can be fronts in middle troposphere (and on occasion, in the upper troposphere). Upper-air fronts are favored locations for turbulence that affects aircraft, so pilots are always on the lookout for these high-altitude frontal features.
After a surface cold front passes a given location, cold-air advection always follows in its wake (remember, cold air advances in concert with a cold front). During winter, temperatures usually tumble in response to strong cold-air advection associated with the arrival of a chilly continental-Polar air mass or a frigid continental-Arctic air mass. From late spring through early fall, however, daytime temperatures often rise after a morning passage of a cold front, provided, of course, that skies become sunny and strong solar heating can overwhelm the usually weak cold advection following summer cold fronts.
As pointed out previously, fronts lie in troughs of low pressure and are thus marked by a wind shift. Below is a typical pattern of isobars (black lines) forming the trough that houses a cold front. Note the wind shift from south-southwesterly winds (green arrows) on the warm side of the front to west-northwesterly winds on the cold side of the front.

Besides being housed in a pressure trough, a cold front also lies in a thermal ridge, which is a northward bulge in the surface isotherms (red lines on the graphic above). A thermal ridge marks an elongated area of maximum warmth, supporting the notion that temperatures typically increase along or just ahead of a cold front. That may seem puzzling to you, but it's generally true. As a cold front approaches a given location, winds start to blow from the south, allowing increasingly warm air to move northward. As the cold front bears down on the location, southerly winds intensify, enhancing the build-up of warm air. Thus, by the time the cold front reaches the given location, winds have blown from the south there for the longest time (compared to locations farther east), allowing temperatures to spike. Taking into account all locations along and just ahead of the cold front, the general spike in temperatures takes the form of a thermal ridge.
So, cold fronts typically bring a surge of warmth just ahead of them, and their passage brings a wind shift and cold advection. But, what are the other weather impacts of a cold frontal passage? First, consider that surface air converges at the cold front (remember, a cold front lies in a trough which always marks a wind shift and a zone of convergence). The relatively "steep" nature of the cold front near the surface can result in strong surface convergence, and surface convergence promotes rising currents of air [23]. Second, consider that warm, moist air along and ahead of the cold front can be favorable for the development of thunderstorms (you may recall that warm, moist air has greater positive buoyancy, which favors rising air parcels via convection). Thus, showers and / or thunderstorms often precede the passage of a cold front [24] (although not as often in the winter).
In the wake of the front, cold-air advection tends to promote currents of sinking air, which helps cause clouds to evaporate, promoting clearing or partially clearing skies. Cold fronts that promote currents of sinking air in their wakes are called katafronts. A katafront, by definition, is a front with sinking air currents on its cold side. Most cold fronts are katafronts.
However, not all cold fronts behave this way. For particularly slow-moving cold fronts, it is possible to have rising air behind the surface front (along the upper-level frontal zone). Weather forecasters refer to any kind of surface front characterized by upward motion on its cold side as an anafront. Anafrontal cold fronts often have steady rain or snow that develops within the cold air behind the front. For example, check out the 12Z surface analysis on January 13, 2007 [25]. The green blobs mark areas where precipitation was falling at the time (note the area of precipitation on the cold side of the cold front in the East).
Wind speeds also often increase near cold fronts, especially after a katafrontal cold front passes. These fast winds can help cause eddies to form [26], and these eddies mix momentum toward the surface from relatively fast winds several thousand feet above the ground, increasing the surface wind speed and often causing the wind to become quite gusty.
What to expect with a cold front...
- cold advection in its wake. Temperatures often fall after a cold front passes as a colder mass arrives (although this may not be the case in the warmer months, when solar heating during the day can overwhelm cold advection).
- a decrease in dew points behind the front. Arriving continental-Polar or continental-Arctic air masses are often drier than the air masses ahead of the cold front.
- rising currents of air caused by low-level convergence, which often leads to clouds, showers, and / or thunderstorms along and ahead of the front.
- sinking air and clearing skies behind the front, as long as it's a katafront (as most cold fronts are).
- a minimum in sea-level pressure as the front passes (remember that fronts lie in pressure troughs).
- A shift in wind direction, and often gusty winds near the front and behind it.
I should point out that most occluded fronts behave somewhat like cold fronts. They, too, bring a wind shift and low-level convergence that can lead to clouds and showers. Anafronts, however, are a different story, as they cause rising air in a different way. We'll explore the main types of anafronts (warm fronts and stationary fronts) in the next section. Read on.
Warm Fronts and Stationary Fronts
Prioritize...
By the end of this section, you should be able to define warm fronts and stationary fronts and properly characterize them as anafronts. You should also be able to describe the process of overrunning and the resulting clouds and weather associated with these types of fronts.
Read...
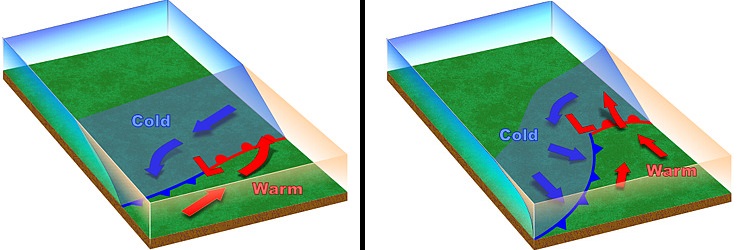
As with cold fronts, we've also studied the basics of warm and stationary fronts previously, but we mainly defined the difference between the two. Now it's time to look a bit closer at the structure of these fronts and the weather associated with them. To review, a warm front isn't simply the leading edge of advancing warm air (as a cold front is the leading edge of advancing colder air). To see what I mean, review the idealized weather maps below:
The image on the left shows a classic warm front, which is marked by a chain of red semicircles [27] directed toward the cold air. This boundary is a warm front because the cold air is retreating (winds on the cold side of the front are blowing away from the front). Why is the retreat of cold air important? Because cold air is more dense than warm air at the surface of the earth, cold air is "the boss" and can push its way around as it pleases. So, warm air can only advance if cold air retreats, and the presence of a warm front signals that cold air is retreating.
What about the boundary on the right? Is it a warm front? The winds in the warm air (south of the boundary) make it look like the warm air is advancing, but that's not the case because the cold air is not retreating: The winds on the cold side of the front are actually blowing slightly toward the front, meaning this is actually a cold front. Remember that determining the type of front is a matter of figuring out whether the cold air is retreating or advancing (and forecasters do so by examining the winds on the cold side of the front).
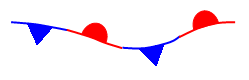
If cold air is neither advancing nor retreating, then we have a stationary front, which is marked by a chain of alternating blue triangles and red semicircles [28]. In such a scenario, winds on the cold side of the front blow mostly parallel to the front, resulting in a frontal movement of less than five knots (fronts moving at less than 5 knots are considered stationary). Again, the winds on the warm side of the front don't really matter: Cold air is the boss, and if the cold air isn't advancing or retreating, the front is stationary.
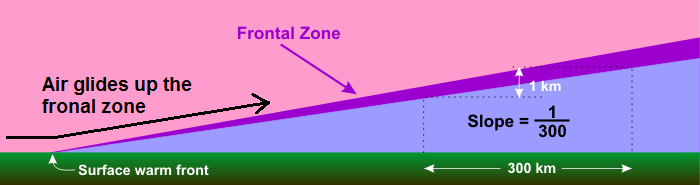
In the context of mid-latitude cyclones, stationary fronts east of the low's center typically become warm fronts [29] as the low's circulation causes cold air northeast of the low's center to retreat northward (allowing warm air to advance), but if stronger winds on the warm side of a front are of no consequence in pushing back the cold air, this would suggest that warm fronts are structurally different from cold fronts. Remember that near the surface, a cold front is quite steep, as the cold air wedges its way underneath the warmer air mass. Because cold air is retreating near the surface of a warm front, its profile looks different from that of a cold front. Notice that with a warm front (in the cross-section schematic below), the slope of the frontal zone is uniform throughout the lower atmosphere and is on average about 300 to 1 (1 kilometer vertical for every 300 kilometers in the horizontal). This gentle, consistent slope has a dramatic impact on the type of clouds and precipitation generated by a warm front.

Generally speaking, dense (heavy) cold air retreats more slowly than the wind speeds on the warm side of the front. As a result, warm air rapidly overtakes the cold air at the surface. However, because warm air is less dense than cold air (at equal pressures), it is forced up the incline created by the cold-air wedge [30]. Meteorologists often say that the warm air overruns the cold air -- the process is often called overrunning, which results in air gliding up the frontal zone.
Thus, all conventional warm fronts are anafronts because overrunning produces rising air on the cold side of the front (all stationary fronts are anafronts as well). Unlike the convective clouds along and ahead of a cold front, clouds that form north of a warm front are usually stratiform in nature (layered clouds). That's because parcels rising along the frontal zone of a warm front quickly find themselves cooler than their surroundings, which prevents them from rising via convection (they are negatively buoyant). But, with steady overrunning continuing below the now negatively buoyant parcels of cloudy air, rising parcels take a more lateral path, spreading out in large horizontal sheets. Thus, clouds that form as a consequence of overrunning tend to form in multiple, shallow layers (you may recall that such layered clouds fall into the "stratus" family).

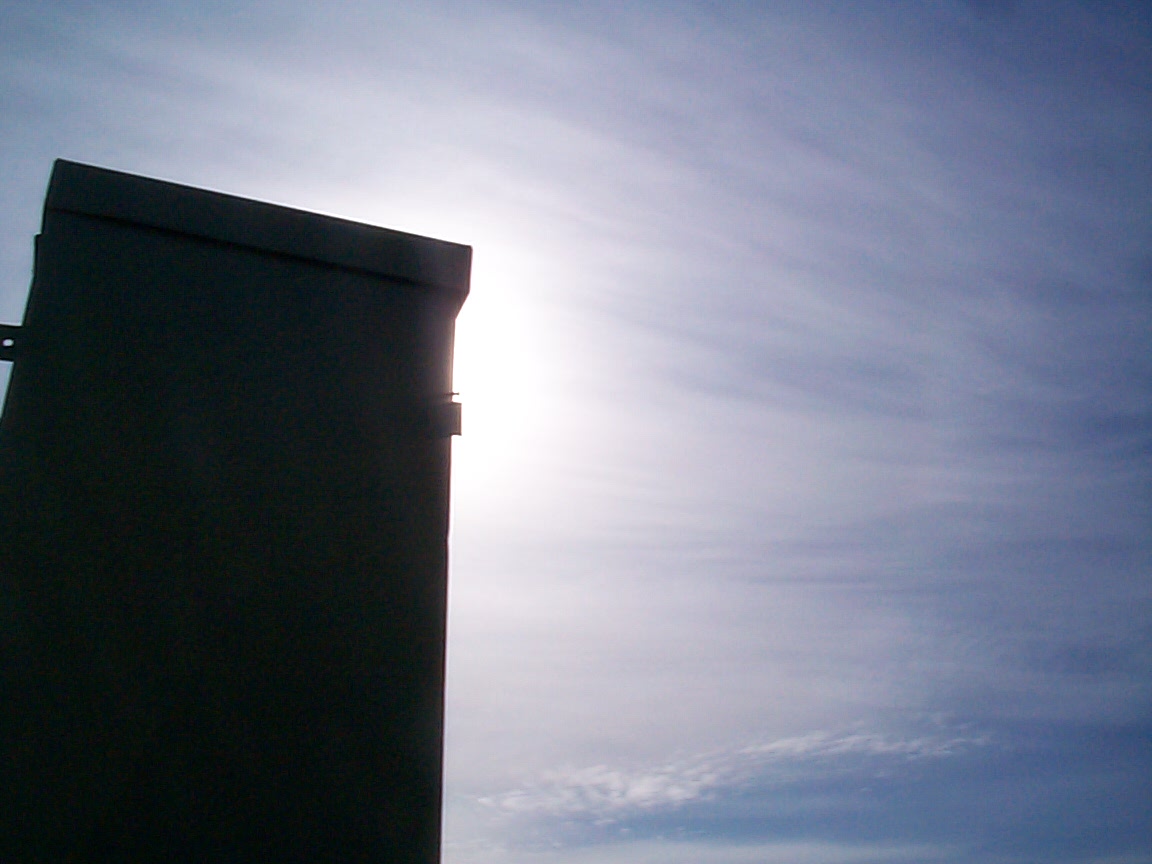
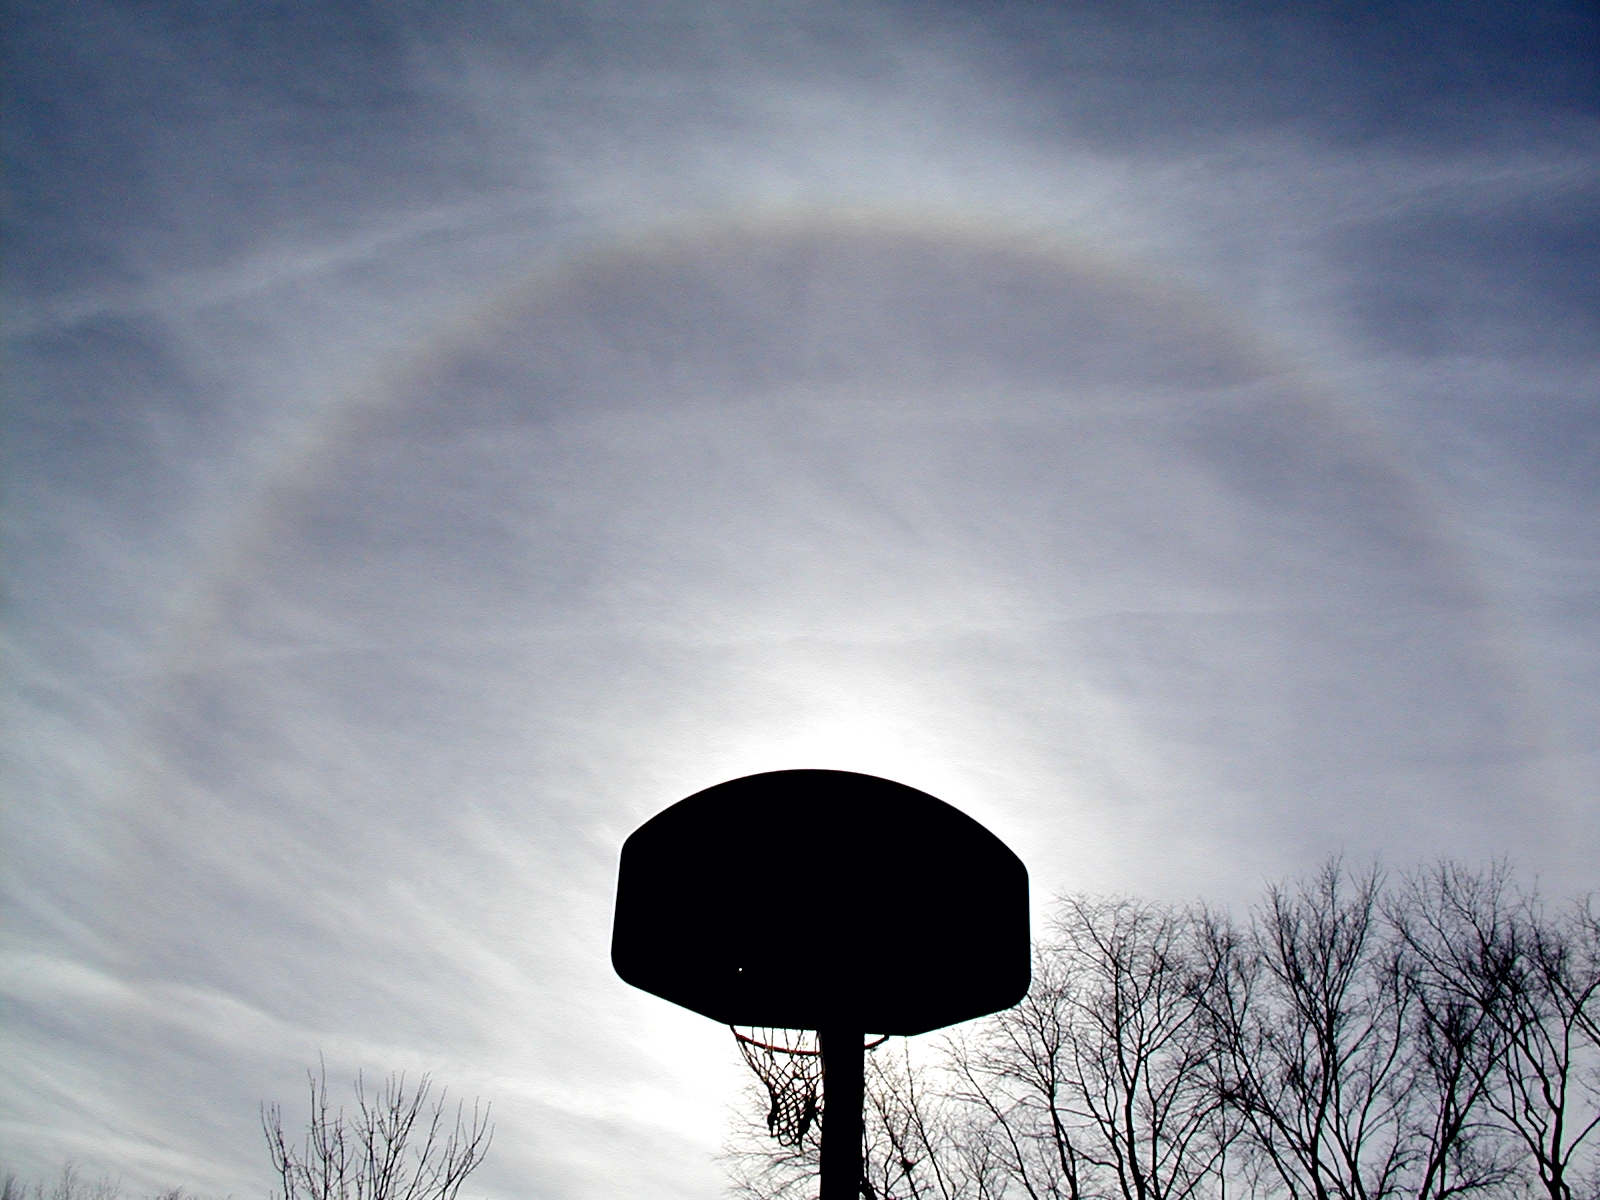
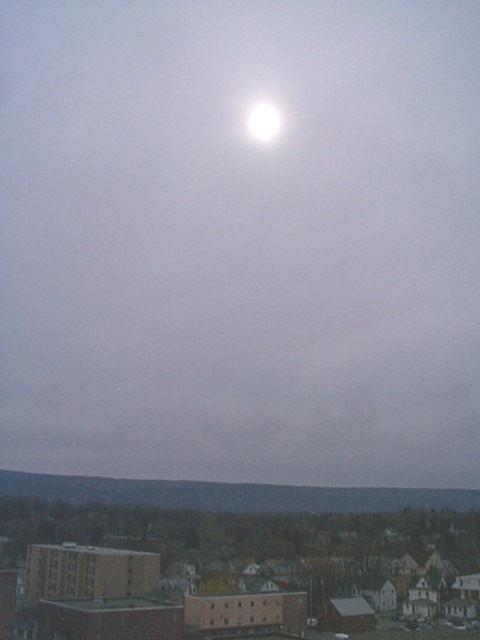
Typically, the further you are from an approaching warm front, the higher the stratiform clouds. As a warm front approaches a given location, a deck of cirrostratus [31] clouds dims sunshine or moonshine, and sometimes a 22-degree halo [32] or sundogs [33] appear as ice crystals in cirrostratus refract light like glass prisms. Then, a deck of altostratus [34] builds, with only a faint image of the sun now visible through this layer of middle clouds. Finally, the ceiling continues to lower toward the ground, with steady rain or snow falling from nimbostratus (see photo on the right). Cloud ceilings can be as low as a few hundred feet, sometimes resulting in heavy fog on hill tops or mountain tops.
There's an old saying in weather folklore that states "Halo around the sun or moon, snow or rain is coming soon." The progression of clouds ahead of a warm front I just described explains why that saying often has some merit. High cirrostratus clouds can create a halo, but as a warm front draws closer, cloud bases typically lower to altostratus, and eventually nimbostratus clouds which produce precipitation (the progression from cirrostratus to nimbostratus may take a day or a little more).
Not surprisingly, upward speeds associated with the relatively gentle ascent from overrunning are on the order of several centimeters per second. Compare this with the several to tens of meters per second ascent found in the line of strong thunderstorms along a fast-moving cold front. This benign lifting causes warm fronts contain light, but widespread stratiform precipitation. As an example, consider the 09Z surface analysis on April 25, 2010 [35], and note the warm front associated with a deep low-pressure system centered over western Illinois. The widespread overrunning associated with the warm front produced a wide swath of stratiform precipitation as seen in the 0910Z radar reflectivity map (below). You can easily identify stratiform precipitation on the radar image by noting the large, relatively uniform region of 15-35 dBZ reflectivity values (greens and pale yellows) from off the East Coast back to the eastern Great Lakes. Although typically benign in terms of severe weather, we will learn that warm fronts in winter can bring a mixed bag of snow, sleet, and freezing rain.

I should note that, once in awhile, convective showers can develop north of the warm front within a mostly stratiform area of precipitation. This can happen when a strong upper-level disturbance creates strong divergence aloft [36] that can force the layer of air above the overrunning warm air to also rise. Precipitation in these areas of convection can be briefly heavy (but typically not as heavy as the thunderstorms that sometimes develop along and ahead of a cold front). Nonetheless, convection on the cold side of a warm front can, during winter, for example, produce splotches of extremely heavy snow, or even "thunder snow" (which gets some meteorologists awfully excited [37] because it's relatively rare) within a large area of generally moderate snow.
When a warm front passes a given location, temperatures tend to increase (as colder air retreats and a warmer air mass arrives). Pressure also reaches a minimum with a warm frontal passage (remember that all fronts lie in pressure troughs). The steady rain typically comes to an end after a warm front passes as your location enters the warm sector, but the chances for showers and possibly thunderstorms increase again as the mid-latitude cyclone's cold front approaches.
What to expect with a warm front...
- increasing temperatures as the front approaches and passes (as colder air retreats and warmer air arrives).
- rising air on the cold side of the front via overrunning, which results in a gradually thickening deck of stratiform clouds (cirrostratus to altostratus, and eventually to nimbostratus typically) and a large area of light to moderate precipitation (typically).
- a minimum in sea-level pressure as the front passes (remember that fronts lie in pressure troughs).
- a shift in wind direction, with winds typically blowing increasingly from the south after the front passes.
As a reminder, stationary fronts are also anafronts and generate rising air on their cold sides via overrunning as well. Therefore, layered stratiform clouds and precipitation are often found on the cold side of stationary fronts, too. Furthermore, since the cold air mass isn't moving, precipitation can occasionally be long-lasting, which can increase the risk for flooding (especially in the warmer months).
Now that we've looked at the types of fronts associated with mid-latitude cyclones and the types of weather that they bring, let's look at mid-latitude cyclone features on satellite and radar imagery. I think this look will help you reinforce some of the concepts from the last few sections. Read on.
Conveyor Belts
Prioritize...
At the completion of this section, you should be able to name the three conveyor belts associated with a mature mid-latitude cyclone. You should also be able to describe each conveyor belt and discuss its impacts on the mid-latitude cyclone (precipitation, appearance, etc.).
Read...
One of the common characteristics of mid-latitude cyclones is their distinctive appearance on radar and satellite imagery. In fact, visual cues from radar or satellite imagery can give weather forecasters clues about what's "going on" with a cyclone. For example, as a cyclone is being born (a weak low forms along a stationary front), the cloud structure of an infant low often resembles a leaf on a tree [38] on geostationary satellite imagery. Forecasters call this a "baroclinic leaf" (baroclinic is just a technical term that refers to large temperature gradients).
As a mid-latitude cyclone reaches maturity (the occluded stage), most typically develop a network of three distinct, coiling air streams. Meteorologists call these streams conveyor belts. Conveyor belts associated with a maturing low are a bit complicated to visualize because they transport air in both horizontally and vertically, but this short video (2:59) [39] should help you visualize these air streams (video transcript [40]). The video shows a three-dimensional model, which will give you a better perspective on how all three conveyor belts contribute to the circulation of a mid-latitude cyclone and help explain why mature mid-latitude cyclones often resemble the shape of a comma on satellite [41] and (sometimes) radar imagery [42]. Let's break down each conveyor belt and the role it plays in the cyclone in more detail (as we've been doing, we'll assume we're talking about mid-latitude cyclones in the Northern Hemisphere).
Warm Conveyor Belt
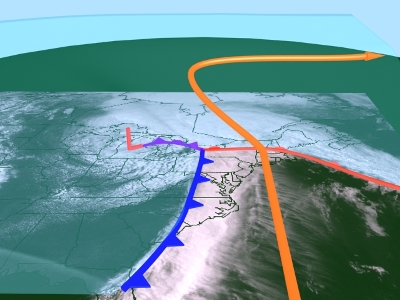
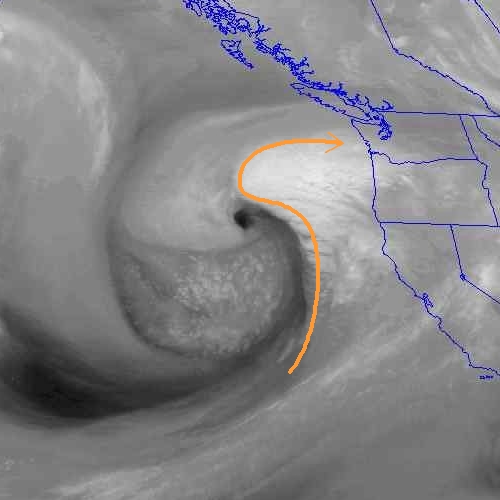
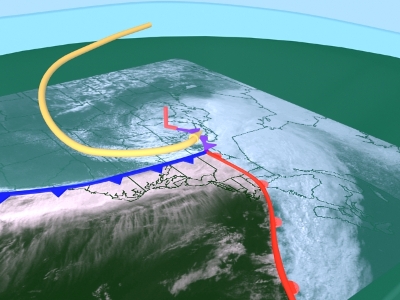
The warm conveyor belt [43] transports warm and moist air northward from lower latitudes, steadily and gradually rising during its northward trek and eventually overrunning cold air north of the system's warm front, which helps to create stratiform clouds and precipitation. As it overruns the cold-air wedge on the northern side of the warm front, the warm conveyor belt can reach altitudes near 30,000 feet. Here, the warm conveyor usually encounters high-altitude winds from the west, and, in response, turns eastward. Meanwhile, the western edge of the warm conveyor belt gets drawn westward by the upper-level disturbance that is helping to spur the low-pressure system. As a result, a classic S-shape [44] develops in the band of high clouds that mark the warm conveyor belt. Weather forecasters recognize this classic S-shape as a sign that the cyclone is mature.
Focus your attention on the water-vapor images below. The left image shows the developing Blizzard of 1993 at 12Z on March 13, 1993. In this case, the low's warm conveyor belt transported moist air from the Caribbean and Central America northward over much of the eastern U.S. The water-vapor image on the right shows a less spectacular (but still classic) warm conveyor belt of a mature low-pressure system in March, 1996.

Dry Conveyor Belt
On each of the images above, notice the dark swath on the water vapor image west of the back edge of the warm conveyor belt. As you recall, dark shading on water vapor imagery represents areas where the effective layer is warm and relatively low (likely in the middle troposphere), which implies that the upper troposphere is dry. This drying of the mid and upper troposphere is indicative of air sinking from great altitudes where water vapor is scarce. In the case of a maturing low-pressure system, dry air near the tropopause sinks west of the low's center (keep in mind that upward motion characterizes the region around the center of the low so that there is a natural tendency for the air to sink further west). Upon descent, this dry air starts to wrap counterclockwise around the low's periphery, helping to scour out clouds and thus creating what weather forecasters call the dry slot [45] west of the cold front.
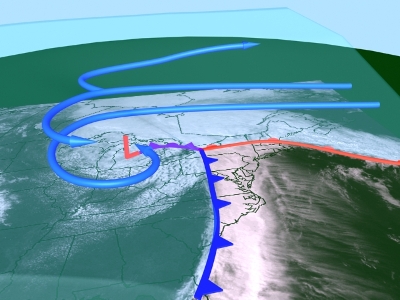
This stream of dry air that sinks from lofty altitudes near the tropopause and then wraps counterclockwise around a mature low-pressure system is called the dry conveyor belt [46]. The dry conveyor belt helps to give a classic "comma" shape to the mass of clouds generated by a mature low-pressure system. However, for the full effect, we need to discuss how the clouds that compose the comma head west of the surface low's center are formed.
Cold Conveyor Belt
The cold conveyor belt [47] helps create the clouds that compose the comma head. The cold conveyor belt is so named because it is responsible for westward transport of cool, moist air north of the warm front and back into the cold air west of the low. While the warm conveyor belt takes the high road north of a low's warm front, this cold conveyor takes a lower road. Like traffic moving under an overpass, a stream of cold air starts to move westward near the earth's surface on the northern side of the maturing low's warm front.
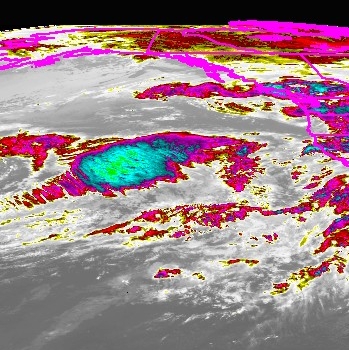
To see what I mean, check out this infrared satellite image [48] on October 9, 2007, which shows a mature cyclone off the Pacific Northwest Coast. Note the lower, warmer cloud tops associated with the cold conveyor belt (compared to the warm conveyor belt). As the cold conveyor belt passes under the higher-flying warm conveyor, it gains moisture as some overrunning precipitation [49] evaporates into its westward-moving stream of cold air (evaporation from underlying bodies of water can also moisten the cold conveyor).

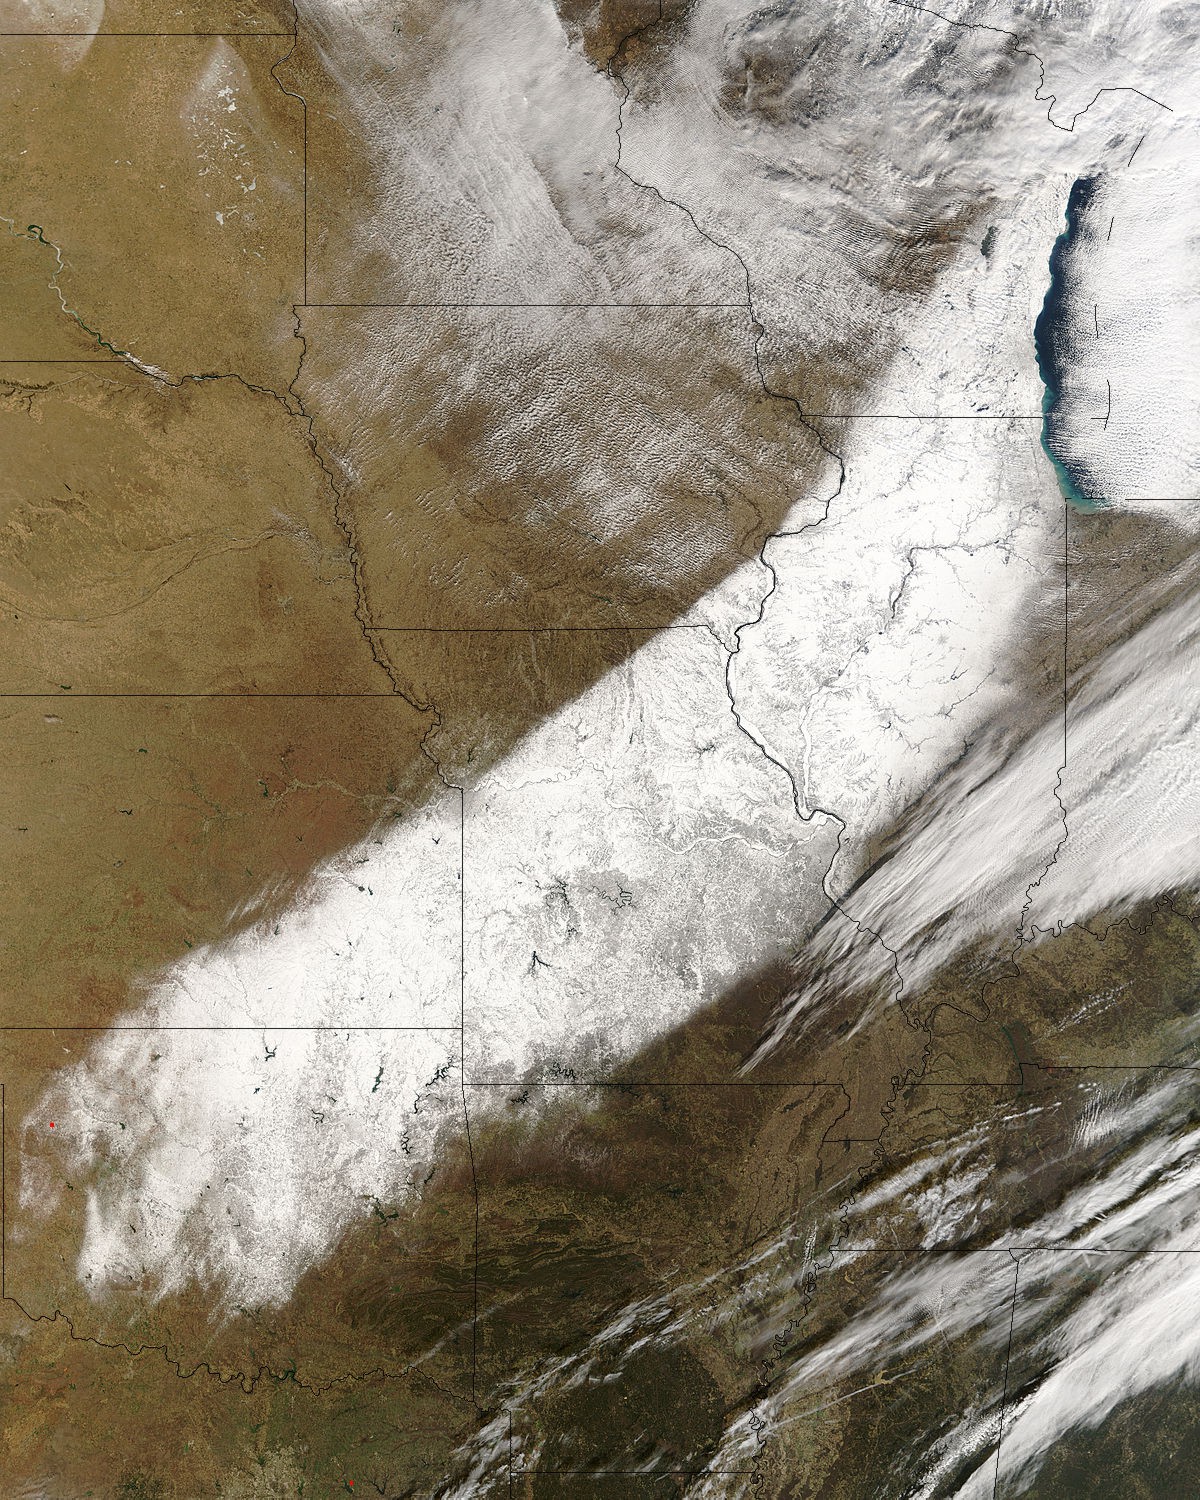
As the moistening cold conveyor heads westward, it starts to rise as it enters the general pattern of strong upward motion around the periphery of the low-pressure system's center (thanks to the pattern of low-level convergence and upper-level divergence that occurs near the center of the low). Strong ascent continues until the cold conveyor belt reaches the northwest flank of the low (approximately 75 to 150 miles northwest of the low's center). Here, the ascending conveyor of cold, moist air often contributes to a swath of heavy precipitation. In winter, the northwest flank of a maturing cyclone often marks a maximum in snowfall, owing largely to the influence of the cold conveyor belt. Powerful lows often leave a relatively narrow swath of heavy snow that you can sometimes observe on satellite imagery, like this swath of snow created by a powerful mid-latitude cyclone [50] that moved up through the Midwest on December 1, 2006 (courtesy of VisibleEarth [51], NASA). These swaths of heavy snow typically coincide with the track of the favored northwest flank of the storm system.
After reaching the northwest flank of a mature low-pressure system, the cold conveyor splits into two tributaries. One branch turns (clockwise) and then heads eastward. The other branch of the cold conveyor belt turns cyclonically as it heads southward, generating clouds that help to sculpt the comma head of a mature low-pressure system's cloud structure. These clouds often precipitate, inspiring some weather forecasters to refer to rain or snow falling from the coiling cold conveyor belt as "wrap-around precipitation." In this radar image of a Midwestern blizzard [52], the wrap-around precipitation is quite extensive and contributed to the blizzard conditions in Nebraska, South Dakota, and Minnesota. Farther south in a mature low's comma head, surface convergence produced by air swirling in toward the low's center helps to create rain or snow showers.
To conclude and summarize this section, watch the development of a classic cyclone and its cloud structure in this fantastic animation of satellite images from October 26-27, 2010 [53]. During the daytime, visible images document the low's development, while at night, infrared images appear, so don't be startled by the abrupt change. Do you see how the cyclone ends up resembling a comma? As you watch the video, try to identify the three conveyor belts that we have discussed in this section. To further help you identify the conveyor belts and connect back with the concepts you recently learned about fronts, check out the short video below (4:59), in which I take a "tour" of a classic mid-latitude low-pressure system.
I want to take a tour of a surface low-pressure system and take a look at some of the different features so you can see how they fit together with a real weather system on real weather maps. We'll start at the surface. This is a surface analysis from 12Z on February 13, 2014. There was a 997 millibar low-pressure system along the East Coast, right along the North Carolina-Virginia border. This was a fairly significant storm, which dropped over two feet of snow in parts of the mid-Atlantic region. Heavy snow extended up into New England with localized blizzard conditions.
To the south of the surface low, we have this blue line with blue triangles. That's the cold front signaling the leading edge of advancing colder air. Out ahead of it, in the warm sector, we often have a maritime-Tropical air mass, which is warm and humid. Behind it, we have an advancing colder air mass, commonly continental polar, or even continental Arctic. And we can see some huge temperature contrasts here. To the east of Florida, temperatures are in the 70s on these station models. Behind the front in northern Florida, we have temperatures in the 30s, so much colder air is arriving behind that cold front.
To the east of the low, the red line with red semicircles marks the warm front. That signals the boundary between retreating colder air to the north and advancing warmer air in the warm sector. It's the retreat of that cold air that actually allows the warm air to advance. So we have a maritime tropical air mass advancing northward while the colder, denser air north of the warm front, slowly retreats.
Now let's fast forward six hours to 18Z, and the low is even stronger now, around 991 millibars. The center of the low has moved northward off the Delaware Coast, and we just see the very beginning of an occluded front forming. It's hard to see, but the beginning of the occluded front signals that the low is starting to reach maturity. The cold front is trailing southward offshore, while the warm front extends toward the east.
So, let's look at this mature low-pressure system on the corresponding enhanced infrared satellite image. To get your bearings, the greens, blues, and purples represent cold, high cloud tops. This cyclone has a classic comma signature to it, signaling that it's a mature mid-latitude cyclone. To the north of the warm front, we generally have upward motion from overrunning as the warm air glides over the dense cool air near the surface, which often results in a large area of layered clouds, which is what we see north of the warm front. These clouds near the northern edge of the cloud shield are quite high and cold.
But, a look at the corresponding visible image shows that they seem to be relatively thin, which fits what we would expect. We often have thin, high cirrus and cirrostratus clouds well north of the warm front, thicker altostratus clouds as we get a little closer to the warm front, followed by thick stratus and nimbostratus clouds close to the warm front.
Switching back to the enhanced infrared, we can see that along and just ahead of the cold front, we have a thinner band of clouds, which is indicative of the showery weather that typically accompanies cold frontal passages. Satellite imagery also lets us get a handle on this low's conveyor belts, and for that, we'll turn to water vapor imagery.
To get your bearings, here's the East Coast of the United States, and here's our cyclone. This stream of water vapor and clouds ushering moist air northward, which eventually overruns the colder air mass north of the warm front, is the warm conveyor belt. Meanwhile, the cold conveyor belt travels under the warm conveyor belt north of the warm front and rises as it wraps around the cyclone, to create the clouds in the comma head. Finally, we can see evidence of the dry conveyor belt, too. It helps define the western edge of the comma head as dry air aloft, marked by the dark ribbon here, sinks from aloft around the western edge of the storm, and wraps around the storm to form the dry slot.
Finally, here's the corresponding radar image. Unfortunately, we can't see much of the precipitation with this mid-latitude cyclone because the showers and storms along the cold front, along with much of the stratiform overrunning precipitation north of the warm front was outside of the range of land-based radars, although you can see a bit of the overrunning precipitation off the New England Coast. But, we can get a good look at the wrap-around precipitation associated with the cold conveyor belt, which was bringing snow from New England down through Pennsylvania, and even into Virginia and North Carolina, even though remember the surface low was off the Delaware Coast.
I hope you have the picture by now that mid-latitude cyclones are complex, three-dimensional features, which can cause a wide variety of weather (from various precipitation types to abrupt temperature changes to strong winds). In the colder months, mid-latitude cyclones can be responsible for a variety of precipitation types, from rain to freezing rain, to sleet, to snow. Each of these brings its own hazards, and I think it's important that you understand how each type forms and where each type tends to fall within a winter mid-latitude cyclone. Read on.
Types of Winter Precipitation
Prioritize...
At the completion of this section, you should be able to define freezing rain and sleet. You should also be able to describe the temperature profile in the lower atmosphere that causes the formation of each (in addition to the temperature profiles that cause snow and rain), as well as generally where each type of precipitation is common within the context of a winter mid-latitude cyclone.
Read...
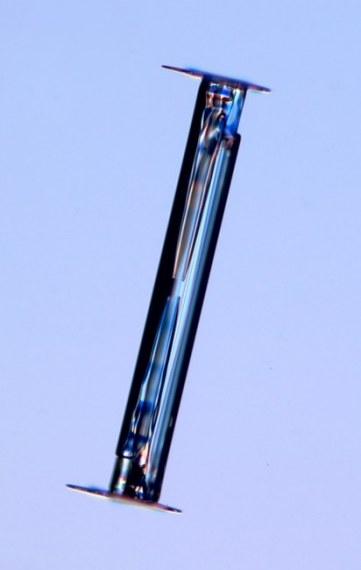
I'll start this section with something that may shock you. Imagine it's a hot, humid summer day and you get stuck outside in an afternoon downpour of rain. While you're getting soaked, it's probably snowing within five miles of your location. It's true! It's probably snowing five miles above you! Actually, most rain originates from snow, even in the summertime! Most precipitation begins as ice crystals (also called snow crystals), which are often shaped like columns [54] or hexagonal plates [55]. Ice crystals grow high up within the clouds where it's very cold, so even when it's raining at the surface, it's usually snowing somewhere up in the clouds.
That background helps us understand how many winter storms have more than snow in their arsenal of weather weapons, including freezing rain, sleet, steady rain, and thunderstorms. While most everyone knows what snow and rain are, have you ever thought about the conditions that cause each to fall? It's not all about conditions at the surface of the Earth! For starters, when temperatures throughout the entire troposphere are less than than the melting point of ice and when clouds are sufficiently cold enough for ice crystals to grow, only snow can reach the ground.
But, what about when temperatures aren't lower than the melting point of ice throughout the entire troposphere? Well, when snowflakes fall through a layer of air that is warmer than the melting point of ice (temperatures greater than 0 degrees Celsius, or 32 degrees Fahrenheit), snowflakes start to melt. Assuming that temperatures in the "warm" layer are a few degrees above the melting point of ice, snowflakes will melt completely into raindrops, and rain will be the observed precipitation type at the surface if the "warm" layer extends down to the ground.
Simple enough, right? But, what about other precipitation types like sleet and freezing rain (the two most frequently confused types of wintry precipitation)? Sometimes in the atmosphere, a "warm-air sandwich" of sorts develops. In other words, there can be a layer of very cold air near the ground, a slab of "warm air" a few thousand feet aloft, and cold air above the warm slab. When a "warm-air sandwich" develops, that's when sleet and freezing rain enter the picture. Check out the short video below (2:51) to see the vertical temperature profiles associated with sleet and freezing rain (and rain and snow, too).
Let’s look at how different vertical temperature variations can result in different types of precipitation at the surface of the earth. I’ll start with a straightforward case, depicted on the left: When temperatures throughout the entire troposphere are less than the melting point of ice and clouds are sufficiently cold enough for ice crystals to grow, only snow can reach the ground.
But, for scenarios in which temperatures aren’t cold enough to sustain snowflakes all the way to the ground, the pink layer represents air with temperatures greater than the melting point of ice – that’s 0 degrees Celsius, or 32 degrees Fahrenheit. So, over here on the right, when snowflakes fall through a layer of air that is warmer than the melting point of ice, snowflakes start to melt. Assuming that temperatures in the "warm" layer are a few degrees above the melting point of ice, snowflakes will melt completely into raindrops, and rain will be the observed precipitation type at the surface if the "warm" layer extends down to the ground.
That seems simple enough, but sometimes in the atmosphere, a "warm-air sandwich" of sorts develops. In other words, there can be a layer of very cold air near the ground, a slab of "warm air" a few thousand feet aloft, and cold air above the warm slab. When a "warm-air sandwich" develops, that's when sleet and freezing rain enter the picture.
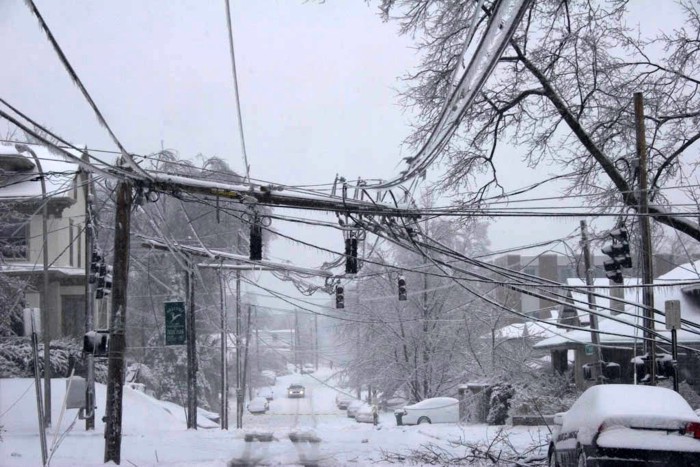
Now, when the layer of cold air near the ground with a temperature less than 0 degrees Celsius isn't thick enough to refreeze the rain drops, freezing rain is the result. When freezing rain is observed, liquid rain drops don't have time to freeze in the layer of cold air near the ground, so they become "supercooled," which means that they're liquid that exists at temperatures less than the melting point. These supercooled raindrops freeze on contact with cold objects such as untreated roads and sidewalks, power lines, and trees. Freezing rain creates a slippery glaze, and when heavy, it can produce devastating ice storms as the weight of ice accumulating on tree branches and power lines brings them down.

Ultimately, when the slice of cold air next to the ground is relatively thick, the rain or partially melted snowflakes can refreeze into ice pellets, called sleet (assuming that snowflakes completely or partially melt when they fall through a warm layer above the relatively thick slice of cold air). Sleet (shown in the image on the right) tends to make a tapping noise and bounce when it hits objects. The formation of sleet requires that the slice of air next to the ground is thick and cold enough to refreeze raindrops while still in the air because raindrops don't refreeze immediately when entering the bottom slice of cold air (it takes time).
When the layer of cold air near the ground (temperature less than 0 degrees Celsius) isn't thick enough to refreeze the rain drops, freezing rain is the result. When freezing rain is observed, liquid rain drops don't have time to freeze in the layer of cold air near the ground, so they become "supercooled," which means that they're liquid that exists at temperatures less than the melting point. These supercooled raindrops freeze on contact with cold objects such as untreated roads and sidewalks, power lines, and trees.
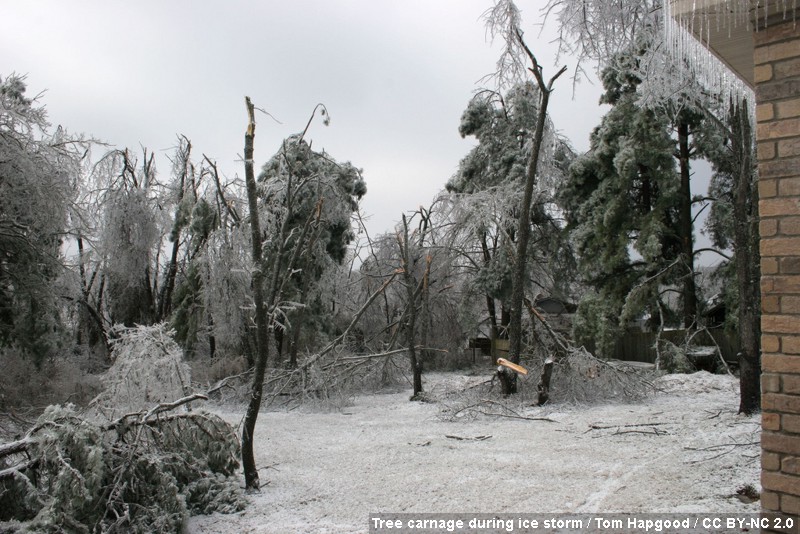
Freezing rain creates a slippery glaze, and when heavy, it can produce devastating ice storms as the weight of ice accumulating on tree branches and power lines brings them down. Indeed, after a devastating ice storm, it can take days (or longer) for power to be restored, which leaves many without heat for their homes during very cold weather. The photograph above, which was taken in the aftermath of an ice storm on January 28, 2009, gives a good example of the carnage that an ice storm can bring (more photos are linked in the caption).
So, ultimately, the surface temperature only partly determines the type of precipitation that is observed at the ground, and sometimes even with very cold air near the surface, the precipitation type may not be snow. Freezing rain, for example, has been observed at surface temperatures less than 10 degrees Fahrenheit. If you are wondering why it just wouldn't snow at such low temperatures, keep two things in mind. Near the leading edge of an Arctic air mass, the depth of the cold air is very shallow. That means there's much warmer air above the thin slice of Arctic air next to the ground (producing the "warm air sandwich"). Second, given the slab of "warm" air above the thin slice of Arctic air, the destiny of snowflakes is a foregone conclusion -- they melt. Once snowflakes melt into raindrops, they can't turn into snowflakes again. Snowflakes are not frozen rain drops! Because the cold air layer is thin, rain drops do not have a chance to freeze while in the air, so they freeze on contact with the very cold surface.
How do "warm-air sandwiches" develop in the context of mid-latitude cyclones? Overrunning is a common culprit, as warmer air overruns cold air near the surface north of the warm front. In the colder months, the overrunning north of the warm front often brings a mixed bag of wintry precipitation types, and this general template for the distribution of wintry precipitation [64] around a mid-latitude cyclone will help you to get a rough idea for the locations of the various types of wintry precipitation relative to the low's warm front. Generally, the "line" that separates snow from other forms of wintry precipitation lies north of a mid-latitude low's warm front, but I caution you that this template is highly generalized. The details vary from storm to storm. Some storms produce only snow, while others produce only rain. Others can produce all precipitation types. Determining exactly where the lines between snow, sleet, freezing rain, and rain will occur can be one of the toughest forecasts a meteorologist has to make.
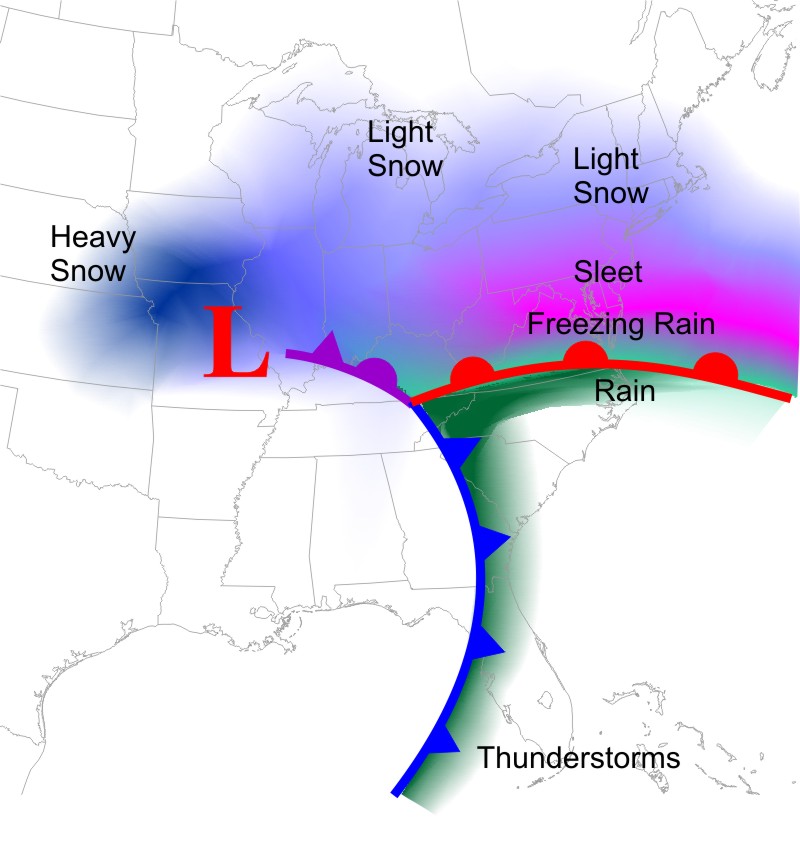

The cross section above shows how overrunning can create a variety of precipitation types north of the warm front. Warm air cools as it glides upward along the frontal zone, and areas farthest north have the best chance of having temperatures low enough to support snow surviving all the way to the surface. A bit farther south (closer to the warm front), the overrunning can create a thin melting layer above the cold wedge, but the cold wedge near the surface is thick enough for raindrops to freeze into sleet before reaching the surface. Even closer to the warm front, the melting layer is deeper, and the cold wedge near the surface isn't thick enough for raindrops to refreeze before hitting the ground, so freezing rain results as supercooled raindrops freeze on contact with the surface. Finally, south of the warm front in the warm sector is the most likely region for warm air to extend all the way to the ground (commonly resulting in rain). Again, however, I remind you that this template is very general, and every storm is a little bit different.
Know your precipitation types!
- Snow: Ice crystals that fall to the surface when the entire atmospheric column is sufficiently cold
- Sleet: Ice pellets that form as raindrops refreeze before reaching the surface. Sleet tends to bounce on contact.
- Freezing Rain: Supercooled raindrops that freeze on contact with cold surfaces (untreated pavement, trees, power lines, etc.). Freezing rain creates a dangerous, slippery, icy glaze.
- Rain: Liquid water drops that fall to the surface (which typically form from melted snowflakes)
Forecasting exactly where and when precipitation types will change in a winter storm can be extremely challenging. Sometimes, small distances (maybe as little as several miles) separate an area that gets buried with heavy snow from an area that gets less snow, but instead gets periods of freezing rain and sleet. The exact details of where and when those changes will occur are not always obvious!
With the potentially dangerous winter weather that mid-latitude cyclones can bring, from snow, sleet, and freezing rain, to bitter cold and strong winds, I think it's important that we cover some winter weather safety basics before we wrap up this lesson. Read on.
Winter Weather Safety
Prioritize...
When you've completed this section, you should be able to discuss the criteria needed for a true blizzard and be able to identify the recommended components for an emergency supply kit for a car. You should also be able to describe wind chill and identify the signs of hypothermia.
Read...
How do you feel about winter weather? Do you like big snow storms? Do you hate shoveling snow? Do you love cold weather, or have you tried to avoid it by moving to an area where it rarely gets cold? Regardless of your feelings on these questions, winter weather can be downright dangerous. Wintry precipitation can create hazardous driving conditions. Ice storms and / or strong winds can knock out power for days, perhaps leaving you without heat for your home. Bitterly cold air can cause frostbite and / or hypothermia for those overexposed to the cold. Perhaps you've experienced such conditions yourself or know someone who has.
Given that winter weather can literally bring "life and death" situations, I want to briefly discuss winter weather safety. Knowing how to prepare for the hazards of winter weather could save your life! The National Weather Service maintains an extensive site on winter weather safety [65], covering big snow storms, ice storms, blizzards, avalanches, and extreme cold, and I encourage you to check it out and follow the tips provided. Here, we're going to focus on some general things you can do to prepare an emergency supply kit for your car and identify the signs of hypothermia, which is caused when your body temperature becomes dangerously low, typically because of prolonged exposure to cold.
Before we get into those topics, however, did you notice that I separated "big snow storms" and "blizzards" in the list above? There's a reason I kept them separate. You see, the term "blizzard" tends to be overused. In order to qualify as a "blizzard," a very specific set of criteria must be met. Specifically, a blizzard requires at least three consecutive hours of:
- sustained winds, or frequent gusts, of 35 miles per hour or more
- visibility of 1/4 mile or less due to falling or blowing snow
So, a blizzard can actually occur when snow is not falling if strong winds (at least 35 miles per hour) can blow snow already on the ground around enough to reduce visibility to 1/4 mile or less for three consecutive hours. Many snow storms that dump heavy snow get referred to as "blizzards" but may not be blizzards at all (or may only be blizzards over a small fraction of the affected area). For example, the storm commonly known as the "Blizzard of 2016" dropped more than 10 inches of snow from Kentucky all the way to southern New England (check out the snowfall analysis below).

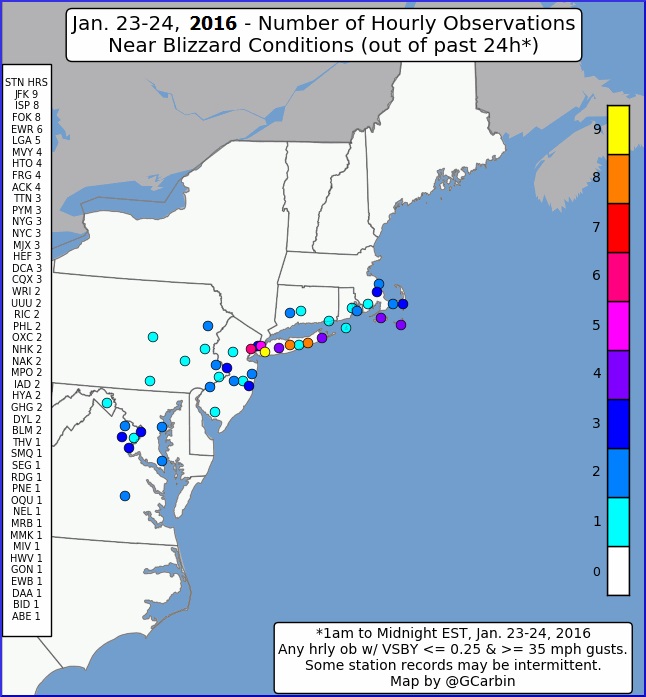
But, was it really a blizzard? Yes, but in a much smaller area than you might think. This plot shows the number of hours of "near blizzard" conditions [66] recorded during the storm. Blizzard conditions occurred from Nantucket and Martha's Vineyard in Massachusetts, to areas of Long Island, New York, to isolated areas of New Jersey and Virginia. Outside of those areas, it was a disruptive, heavy snow storm, but not really a blizzard. The fact is, most heavy snow storms are not actually blizzards because it's really difficult to sustain winds (or to experience frequent gusts) to 35 miles per hour or more AND maintain visibility of 1/4 mile or less simultaneously for three consecutive hours. Meanwhile, blizzards can actually occur when snow is not falling at all (often called "ground blizzards"). Back in 2013, Dr. Jon Nese of Penn State's Department of Meteorology and Atmospheric Sciences created a short video (3:31) on the overuse of the term "blizzard" [67] for the department's Weather World [68] television program, which shows some great examples of how some "blizzards" are really only true blizzards over small area.
Even in areas where the "Blizzard of 2016" wasn't actually a blizzard, it was still a dangerous storm. In fact, hundreds of vehicles became stranded in the heavy snow on the Pennsylvania Turnpike [69] for more than 12 hours with little or no food and no access to restrooms. When traveling during winter storms, the reality is that even if you are taking it slow and being careful, you can still get stranded because of accidents caused by others and / or by unexpected road closures. Ultimately, in some cases it's best not to travel at all, but when traveling during the winter, it's always a good idea to start any long trip with a full tank of gas or full electric charge (and make sure your tank or charge levels don't get too low along the way), and prepare an emergency supply kit in your car, just in case.

The ability to keep your car running (at least occasionally for heat) is important, which is why you shouldn't let your gas tank or charge levels get too low during your trip. You should also carry battery jumper cables with you, so that you can jump start a dead battery, if needed. What other items should you include in your emergency supply kit? Items to help you keep warm are essential, such as mittens, hats, boots, and blankets. Also, be sure to pack water and high-calorie, non-perishable snacks, which could be a life-saver should you become stranded for an extended period of time. Should your car become stuck in snow and / or ice, a tow rope, sand or kitty litter (for traction), and a snow shovel and brush will be helpful. Meanwhile, a flashlight and flares can help others see you, and can help you see in the dark.
If you have a cell phone, make sure to bring its charger, too. You don't want a badly-timed dead cell-phone battery if you need to call for help! Finally, make sure to include a first-aid kit, which can be a life-saver if anyone in your party (or nearby) becomes injured. For more tips for preparing for travel during winter weather, I encourage you to check out the National Weather Service Winter Weather Safety site [70]. It also includes important tips for preparing for (and surviving) winter storms when you're at home or at work.
Regardless of any wintry precipitation that causes disruption, winter cold can be a danger all by itself. Not only can continental-Arctic air masses bring dangerously cold air, but the biting chill is worse when it's windy. Why is that? Well, as you may recall, warm air travels away from the body via convection, but when the air is still, that process leaves a layer of relatively warm air near our skin. When it's windy, however, the moving air transports warm air away from our bodies faster [71], making us feel colder.
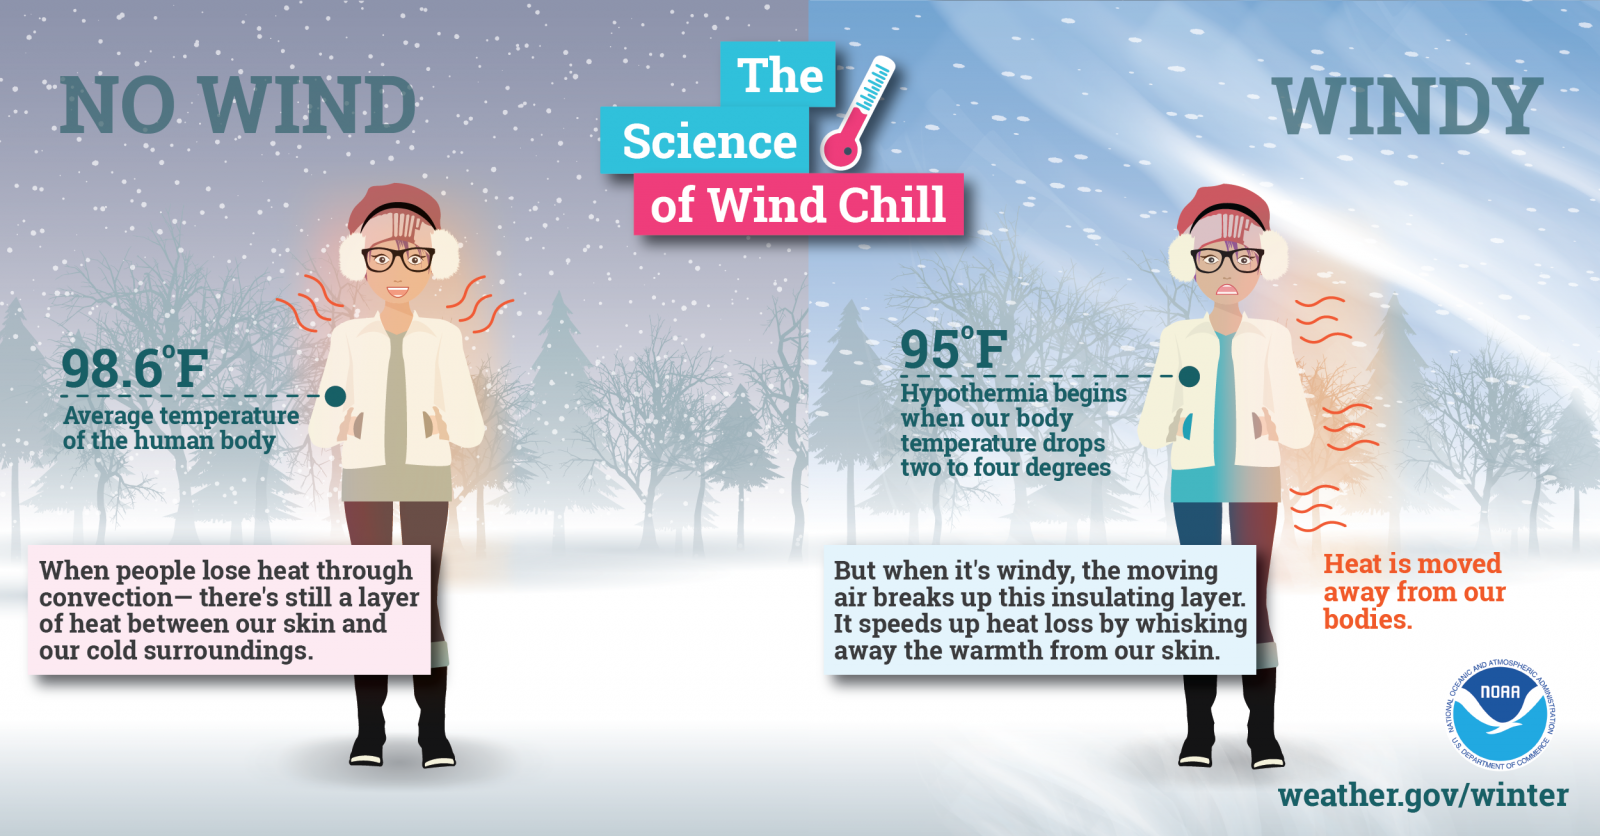
So, to help people gauge the chilling effects of the wind, scientists developed the wind-chill temperature (commonly called "wind-chill factor" or just "wind chill"), which attempts to estimate the wind's cooling effect on exposed skin. The wind chill depends on air temperature and wind speed and is based on models of energy transfer away from the body. Lower temperatures and faster wind speeds result in lower (and potentially dangerous) wind-chill values. For example, using the official National Weather Serivice wind chill chart [72], an air temperature of 0 degrees Fahrenheit and a wind speed of 25 miles per hour results in a wind chill of -24 degrees Fahrenheit. In such conditions, frostbite (a potentially serious injury occurring when the skin and possibly underlying tissues freeze) can occur in as little as 30 minutes. In extreme cold, staying dry, dressing warmly, and covering as much of your skin as possible (preferably in in layers [73] with waterproof shoes or boots) is ideal.
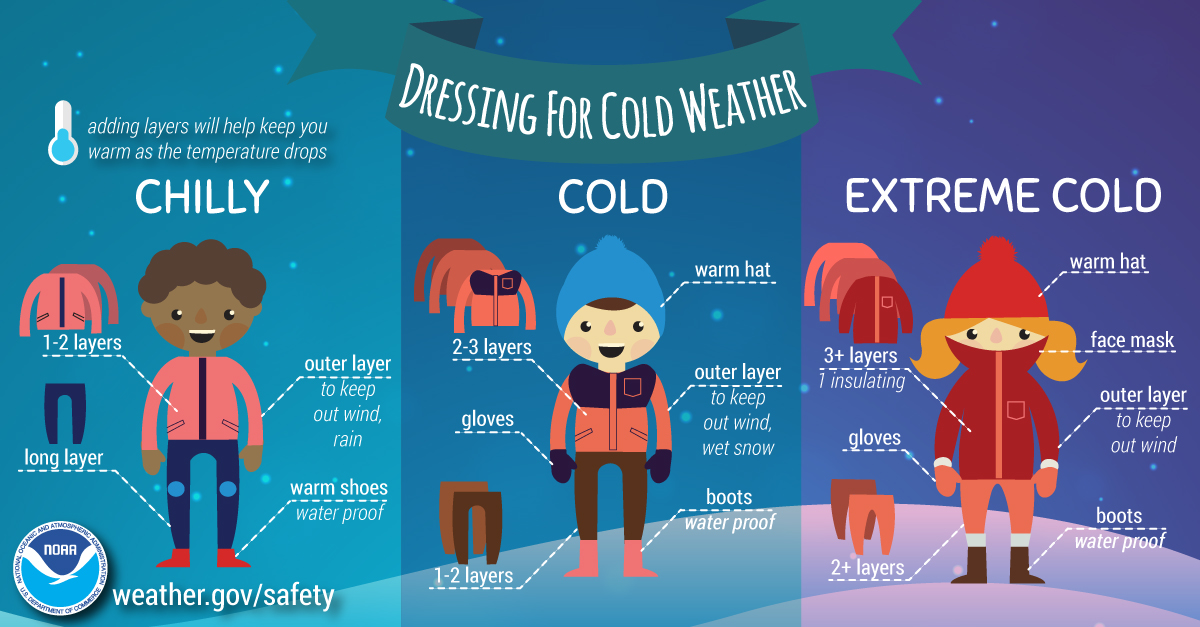
Besides frostbite, another potential danger in cold weather is hypothermia, a condition in which the body can't keep itself sufficiently warm due to prolonged exposure to cold. Hypothermia sets in when the human body's core temperature drops below 95 degrees Fahrenheit (that's just a few degrees below "normal" body temperature), and severe cases can cause death. In fact, severe cases of hypothermia cause more than 1,000 deaths, on average, each year in the United States.

When hypothermia occurs, a person may display confusion, shivering, difficulty speaking, sleepiness, and sore / stiff muscles. Keep in mind that the weather need not be bitterly cold for hypothermia to occur. Indeed, even when it's merely cool (temperatures above 40 degrees Fahrenheit), hypothermia can occur when the human body becomes chilled by rain, sweat, or submersion in cold water. So, it's extremely important to stay dry in cool or cold weather. People with hypothermia should be moved to a warm shelter, if at all possible, and warmed with dry clothes, blankets (an electric blanket is ideal), and hot, non-alcoholic beverages. Of course, you should seek medical attention as soon as possible.
My discussion here really only scratches the surface when it comes to winter weather safety. Again, I encourage you to check out the National Weather Service Winter Weather Safety site [70] to learn more. The tips discussed on this page and on the National Weather Service site could save your life, or the life of a loved one. At the very least, they could make a future encounter with winter weather go much more smoothly and comfortably. During the winter, make sure that you keep up with the latest weather forecast for your area (or any area where you may be traveling), so that you're aware of the risks posed by mid-latitude cyclones and wintry precipitation or extreme cold. Of course, keeping up with the latest weather forecast is advisable any time of year, as the other seasons carry their own risks, which we'll be exploring in future lessons!