Lesson 8: The Role of Stability in Thunderstorm Formation
Motivate...

Have you ever been affected by a thunderstorm? Most folks probably have been. Perhaps a thunderstorm has altered your outdoor plans before. Or, perhaps a thunderstorm has had a more dramatic impact on you, by perhaps threatening your life and / or damaging property. Thunderstorms often evoke feelings of curiosity and perhaps fear, and it's clear that humans have long been captivated by lightning, thunder, and dark, swirling clouds. Even ancient cultures had a great respect and admiration for the power of thunderstorms. For example, the "king of the gods" in ancient Roman and Greek cultures was the god of thunder. The Romans called this god "Jupiter" (the Greeks called him "Zeus"), and his symbol was a lightning bolt.
While much of the myth and mysticism surrounding thunderstorms has faded away thanks to the scientific discoveries of the past few centuries, even today, thunderstorms still manage to inspire us. In fact, I'd venture to say that the dramatic weather brought about by thunderstorms makes them one of the top recruiting tools for new meteorologists. The next time that you find yourself talking to a meteorologist (or a self-professed "weather geek") ask them what inspired their passion for weather. There's a good chance you'll get an answer that involves thunderstorms (if not thunderstorms, often snow storms or hurricanes).
In this lesson, you're going to learn about what causes thunderstorms, and to do so, we have to talk about the vertical movement of air. By now, you should have an inkling that rising and sinking air really impact the type of "weather" a location experiences, but the types of rising and sinking air that we've talked about previously (resulting from patterns of convergence and divergence, or overrunning) are pretty gentle in the scheme of things. In other words, they create vertical motions that are fairly slow. But, in this lesson, you'll learn that small regions can have air that rises much faster (perhaps violently) even while the weather over a larger surrounding area is fairly quiet! We already discussed some of the principles behind such rapidly rising air when we discussed convection and buoyancy earlier in the course, but we'll take a closer look in this lesson.
We will also look at the climatology (that is, the "where" and "when") of thunderstorms, explore the life-cycle of a typical thunderstorm, and also learn about lightning and lightning safety. In the end, I hope that the next time you watch a thunderstorm, this lesson will enhance your appreciation and keep you safe, too! Let's get started!
The Ups and Downs of Air Parcels
Prioritize...
After finishing this section, you should be able to define the term hydrostatic equilibrium (hydrostatic balance) and discuss the implications of hydrostatic equilibrium on vertical motions in the atmosphere. You should also be able to define buoyancy and the buoyancy force, as well as discuss under what conditions an object (like a parcel of air) is positively or negatively buoyant.
Read...
As you may recall, cooling is the most common way to make a cloud, and because air cools as it rises, upward motion in the atmosphere (rising air) is required for clouds and precipitation. When we studied mid-latitude cyclones, you saw a number of mechanisms that cause air to rise, such as overrunning and low-level convergence along a cold front. But, these mechanisms that cause rising air result in fairly slow upward motions, often roughly a few or several centimeters per second (at most maybe 10 to 20 centimeters per second). For reference, 10 centimeters per second is about 0.22 miles per hour.
To understand why vertical motions in the atmosphere tend to be quite gentle (even those that cause large areas of clouds and precipitation), we have to take a closer look at the vertical structure of the atmosphere. First, recall that pressure always decreases with increasing height. The vertical decrease in pressure naturally means that an upward pointing pressure-gradient force exists. In fact, the upward pointing pressure-gradient force is much stronger than the horizontal pressure-gradient force that drives the wind that we experience at the surface. Remember that even a large horizontal gradient in sea-level pressure amounts to a tiny fraction of a millibar per mile. But, the vertical pressure gradient is much, much larger. The pressure drops by more than 100 millibars just in the first mile above sea level!

Given such a huge upward directed pressure-gradient force, why isn't there constantly a ferocious wind sucking everything upward off the face of the earth? The answer is that, on average, the downward force of gravity roughly balances the large vertical pressure-gradient force. This approximate balance between the vertical pressure-gradient force and gravity is called hydrostatic equilibrium (or hydrostatic balance).
Over large areas, the atmosphere exists approximately in hydrostatic equilibrium, which means that vertical accelerations tend to be small. With small vertical accelerations, upward and downward air motions also tend to be gentle (again, a few centimeters per second is common). But, not all vertical motions in the atmosphere are slow, especially those that occur over small areas. For example, the speed of rising air of cumulus clouds like the ones in this time-lapse movie over Mount Washington, New Hampshire [1] are closer to 1 meter per second (a little over 2 miles per hour). That's still not super speedy, but it's much faster than a few centimeters per second!
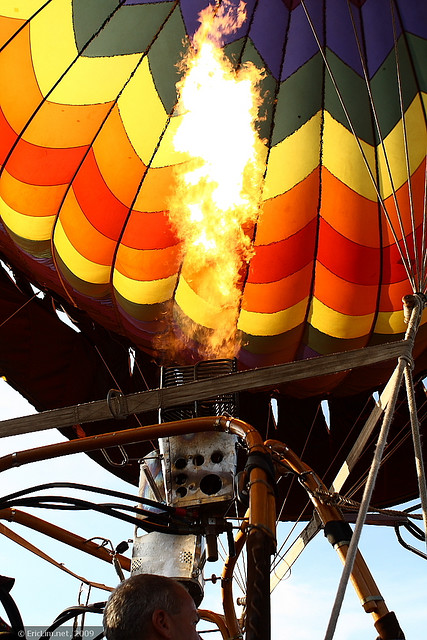
Furthermore, updrafts in powerful thunderstorms can approach a whopping 50 meters per second (a little over 100 miles per hour). So, what's the mechanism for generating such fast speeds? Obviously, the atmosphere must deviate from hydrostatic equilibrium in order for air to accelerate upward to such impressive speeds, and we've already touched on the basic mechanism for generating such fast upward motions -- convection driven by buoyancy.
Recall that convection is the transfer of heat energy via the vertical movement of air, and to understand why air rises freely via convection, we have to review buoyancy. When an object is submerged in a fluid, the buoyancy force on the object is equal to the weight of the fluid displaced by the object. To put this in practical terms, suppose that, while taking a swim, you submerge your favorite beach ball and then let it go. What happens? Very quickly, the beach ball will bob to the surface of the water. In scientific terms, the beach ball is positively buoyant. Now submerge a rock and then release it. It falls to the bottom of the pool because the rock lacks sufficient positive buoyancy to keep it afloat. Formally, we say that the rock has negative buoyancy.
What makes the difference in the buoyancy between a rock and a beach ball? The answer is density. Formally, the density of an object is its mass (akin to weight) divided by its volume. The beach ball has a relatively large volume and small mass, making its density rather small and far less than the density of water. A rock, on the other hand, has a greater density than water, so it sinks. The magnitude of the buoyancy force depends on the difference in densities between the submersed object and the fluid - the greater the difference, the greater the buoyancy force.

How then does buoyancy apply to the air? Well, when determining the buoyancy of the air, meteorologists often refer to "air parcels." I've used this term before, but as a reminder, a parcel is basically a small chunk of air (you could think of it as a bubble or a balloon filled with air). The air in the parcel initially has the same properties as the surrounding air; however, we'll assume that a parcel remains isolated from the surrounding atmosphere (except for pressure changes) when it moves vertically. That's not a perfectly realistic assumption, but it's very useful for meteorologists to draw conclusions about how the air will behave.
It turns out that the difference in temperature between an air parcel and its immediate environment governs the buoyancy of the parcel because the temperature and density of air parcels are related. A relatively warm parcel of air has a lower density than the cooler air surrounding it; therefore, it will be positively buoyant and have a tendency to rise. As the temperature (density) difference between an air parcel and its immediate environment increases, so does the buoyancy. So, relatively warm or hot air parcels are like beach balls that you drag to the bottom of a swimming pool. An inflated beach ball would be much less dense than the water at the bottom of a swimming pool, and therefore, positively buoyant. When you let go of the ball, it will race to the top of the pool.
By the same token, a relatively cool air parcel has a higher density than warmer air immediately surrounding it; therefore, it is negatively buoyant. In other words, it has a tendency to sink if it was initially at rest somewhere above the ground. So, cool air parcels are kind of like rocks that you might hold at the surface of a swimming pool. If you let go of the rock, the very dense rock (compared to the water in the pool) will sink to the bottom.
How high a positively buoyant parcel will rise (or how low a negatively buoyant parcel will sink from higher altitudes) depends, of course, on the density (temperature) of the parcel compared to the density (temperature) of its immediate, surrounding environment. Ultimately, a positively buoyant parcel will continue accelerating upward as long as it remains warmer than its immediate surroundings. But, you may recall that as air parcels rise, they expand and cool. So, parcels that accelerate upward to great heights and attain great upward speeds must end up cooling more slowly than their surrounding environments (so that the parcels remain warmer, by comparison).
Another way to think about this is that an environment in which temperatures decrease rapidly with increasing height helps air parcels remain positively buoyant longer because it becomes easier for a parcel to remain warmer than its surroundings as it rises. Such environments are often referred to by meteorologists as very "unstable." But, what does it really mean when a meteorologist says that the environment is "stable" or "unstable?" We'll explore that in the next section. Read on!
Testing the Stability of the Atmosphere
Prioritize...
At the end of this page, you should be able to explain the meaning of the terms unstable equilibrium, stable equilibrium, and neutrally stable with respect to parcels of air. You should also be able to compare the cooling rates of rising "dry" and "moist" air parcels to describe why "moist" air parcels have a better chance to remain positively buoyant.
Read...
So far, we've established the idea that the atmosphere is usually close to hydrostatic equilibrium over large areas, which results in vertical accelerations and vertical velocities that are quite small. But, that's not always the case over smaller areas. The strongest thunderstorm updrafts can be near 100 miles per hour, and air parcels need positive buoyancy to achieve such impressive speeds.
If you've listened to meteorologists when thunderstorms were in the forecast, you may have heard them make reference to the stability of the atmosphere. They may have described it as "stable" or "unstable," but what do those terms really mean? Well, in short, they help weather forecasters describe the behavior of air parcels that get slightly displaced from their initial positions. Whether an air parcel will continue in the direction it was displaced or return to its initial position depends on stability.
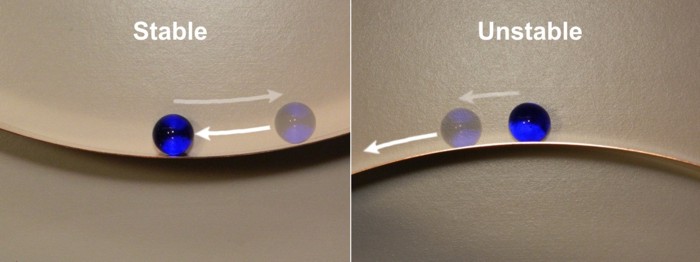
Stability is always discussed in the context of a system in equilibrium (remember that the term equilibrium means that everything is in balance). To help you visualize these concepts, think about a marble sitting in the bottom of a bowl. This marble is in equilibrium: It will sit in the bottom of the bowl forever if nothing disturbs it. Now let's say that you drag the marble up the side of the bowl with your finger. This is not an equilibrium state because as soon as you remove your finger, the marble will begin to move. Although it may roll around a bit, it will settle again at the bottom of the bowl. This is an example of a stable system. In a stable system, small disturbances to the equilibrium always result in a return to that initial state.
Now consider turning the bowl upside down and balancing the marble exactly at its apex. This is also an equilibrium state (the marble will stay there forever if not disturbed). If you displace the marble slightly and let go, what happens now? In this case, the marble does not return to its initial position. It rolls down the side of the bowl onto the table (and perhaps onto the floor and under the refrigerator). It eventually finds a new equilibrium position, often far different from its original state. This is the definition of an unstable system. In an unstable system, small disturbances of the initial equilibrium always result in a new (and perhaps very different) equilibrium state.
We can apply a similar stability test to air parcels that are initially in equilibrium with their environment. By equilibrium, I mean that the temperature (density) of the air inside a stationary parcel is the same as its environment. What happens if our parcel gets a little push upward? Technically, parcels above the ground could get an initial push upward or downward, but we'll focus on upward pushes because they're more relevant to thunderstorm formation. Essentially, one of three scenarios could occur after the parcel is nudged upward:
- the parcel could find itself colder (more dense) than its surroundings, and sink back to its initial position because of negative buoyancy. The layer of the atmosphere where the test occurred is stable in this case.
- the parcel could find itself warmer (less dense) than its surroundings, and accelerate upward away from its initial position because of positive buoyancy. The layer of the atmosphere where the test occurred is unstable in this case.
- the parcel's temperature could be equal to its surroundings (meaning equal density), and the parcel could simply remain in its new position. The layer of the atmosphere where the test occurred is neutrally stable in this case.
In order for thunderstorms to form, meteorologists are looking for scenarios in which air parcels could continue accelerating upward because of positive buoyancy after being given a nudge. So, the question becomes, how do meteorologists assess stability to see whether parcels could accelerate upward because of positive buoyancy? In order to make these judgments, meteorologists study vertical profiles of temperature and dew point in the atmosphere on rather complex diagrams that help forecasters determine how parcels will behave after being nudged. I'll skip the gory details because they're beyond the scope of this course.
The bottom line is that assessing stability requires meteorologists to pay attention to lapse rates. Recall that a lapse rate is the rate of decrease in temperature with increasing height, and while atmospheric lapse rates vary from time to time and place to place, the average environmental lapse rate is about 6.5 degrees Celsius per kilometer (3.6 degrees Fahrenheit per 1000 feet). In other words, for every kilometer of ascent, on average, the temperature decreases by 6.5 degrees Celsius (this applies to roughly the lowest 10 kilometers of the atmosphere). But, rising air parcels also cool as they expand, and meteorologists have to compare the existing environmental lapse rates (which may be different than the average of 6.5 degrees Celsius per kilometer) to the rates of cooling experienced by rising air parcels.
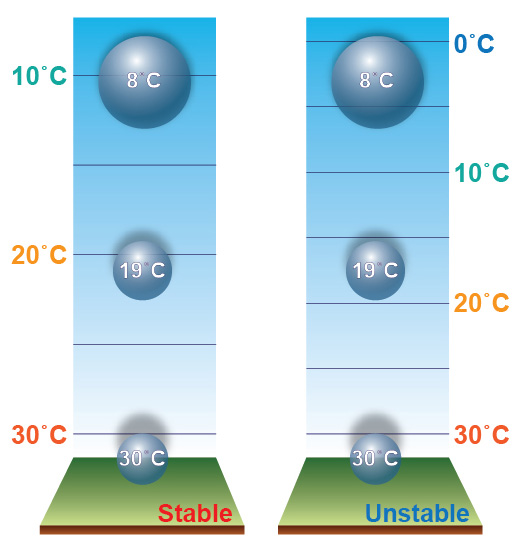
To see what I mean, check out the schematic below, which shows identical air parcels in a stable environment (left) and an unstable environment (right). Both parcels start with the same temperature and cool at the same rate as they rise and expand. The big difference is in the environmental lapse rate. Temperatures decrease more rapidly with increasing height in the unstable environment on the right, which allows the parcel to remain warmer (less dense) than its surroundings as it rises. Such a parcel would accelerate upward because of positive buoyancy if nudged from its initial position. Meanwhile, in the stable environment on the left, environmental temperatures decrease more slowly with increasing height, and the air parcel would be cooler (more dense) than its surroundings if nudged upward. In the stable environment, the parcel would sink back to its initial position because of negative buoyancy.
So, if the environmental lapse rate is relatively large (temperatures are decreasing fairly rapidly with increasing height), it's more likely that a rising parcel can remain warmer than its surroundings, and keep accelerating upward because of positive buoyancy (an unstable environment). But you might asking yourself what determines the rate that the parcel itself cools as it rises. As it turns out, parcels can cool at different rates as they rise:
- "Dry" air parcels, in which liquid water droplets are not forming (the parcel hasn't cooled to the point of net condensation) cool at a rate of about 10 degrees Celsius per kilometer (5.5 degrees Fahrenheit per 1000 feet) as they rise.
- "Moist" air parcels in which liquid water droplets are forming (because the parcel has cooled to the point of net condensation, causing clouds to form) cool more slowly as they rise, at an average rate of about 6 degrees Celsius per kilometer (about 3.3 degrees Fahrenheit per 1000 feet).
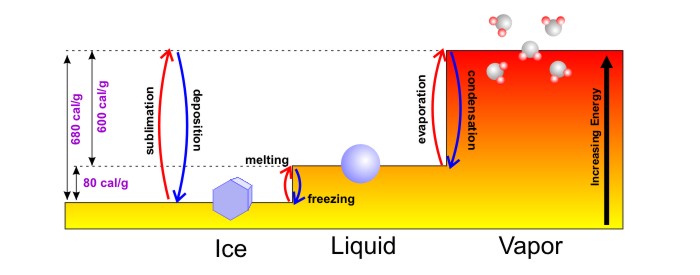
If you're wondering why air parcels in which net condensation is occurring cool more slowly than "dry" air parcels, recall that condensation is a warming process [8]. The release of energy during condensation (formally called the "latent heat of condensation") to the surrounding air offsets some of the cooling that occurs as air parcels rise, resulting in a slower cooling rate overall. The rate of cooling in "moist" air parcels is not constant because it depends on just how much condensation is occurring, but you can think of 6 degrees Celsius per kilometer as an average.
The formation of liquid water drops in a rising air parcel, therefore, tends to extend positive buoyancy for a longer time on ascent because of the slower cooling rate in a "moist" parcel ("moist" parcels have a better chance to remain positively buoyant). But, ultimately, layers in the atmosphere are stable or unstable based on the environmental lapse rate within the layer. Layers in which temperatures decrease more rapidly than 10 degrees Celsius per kilometer (the rate at which "dry" parcels cool) are wildly unstable because all rising parcels are easily warmer than their surroundings. Fortunately, such layers are fairly rare and don't last very long in the atmosphere. On the other hand, layers in which temperatures decrease by less than the rate experienced by "moist" parcels are very stable because all rising parcels quickly find themselves cooler than their surroundings. Often times, the stability is "in between" because environmental lapse rates are between those experienced by "dry" and "moist" parcels. Such conditions are called "conditionally" unstable, because the fate of a rising parcel depends on the "condition" of whether it cools to the point of net condensation or not.
Forecasters also have to keep tabs on any process that causes temperatures to decrease more rapidly with increasing height in a layer of the atmosphere because that tends to decrease the stability in the layer. Layers can become less stable by either warming the bottom of the layer (perhaps you've heard a weather forecaster say something like, "The heat of the afternoon sun will destabilize the atmosphere"), or by cooling the top of the layer. That's right, cooling the air aloft can also be a destabilizing mechanism that can lead to positively buoyant air parcels and thunderstorms!
Now that you know what "stability" means and how meteorologists assess it, let's explore the types of clouds and precipitation that form in stable and unstable environments. Read on!
Stability, Clouds, and Precipitation
Prioritize...
At the completion of this section, you should be able to name and describe the clouds that form in an unstable atmosphere and the clouds that form in a stable atmosphere, including their observed characteristics. You should also be able to discern stratiform from convective precipitation on radar.
Read...
Now that we've covered the difference between stable and unstable environments, we can tackle the question of what kinds of clouds and precipitation form in each type of environment. As you're about to see, the stability of the atmosphere plays a big role in the types of clouds and precipitation that can form!
Let's start with clouds in an unstable environment. When the environment is unstable, air parcels are able to rise via positive buoyancy if nudged upward from their initial position (say, near the surface). To get a visual on this process, let's perform a little experiment. We'll start with a small Plexiglas cylinder into which we'll blow some smoke (to help us trace the movement of the air). Next, we'll put the cylinder on a hot plate and turn it on. What happens? As air parcels near the bottom of the cylinder warm up and become positively buoyant, convective eddies form and plumes of smoky air rise. In turn, cooler air that's higher up in the cylinder sinks, resulting in "convective overturning," the results of which you can see in the image below on the right.

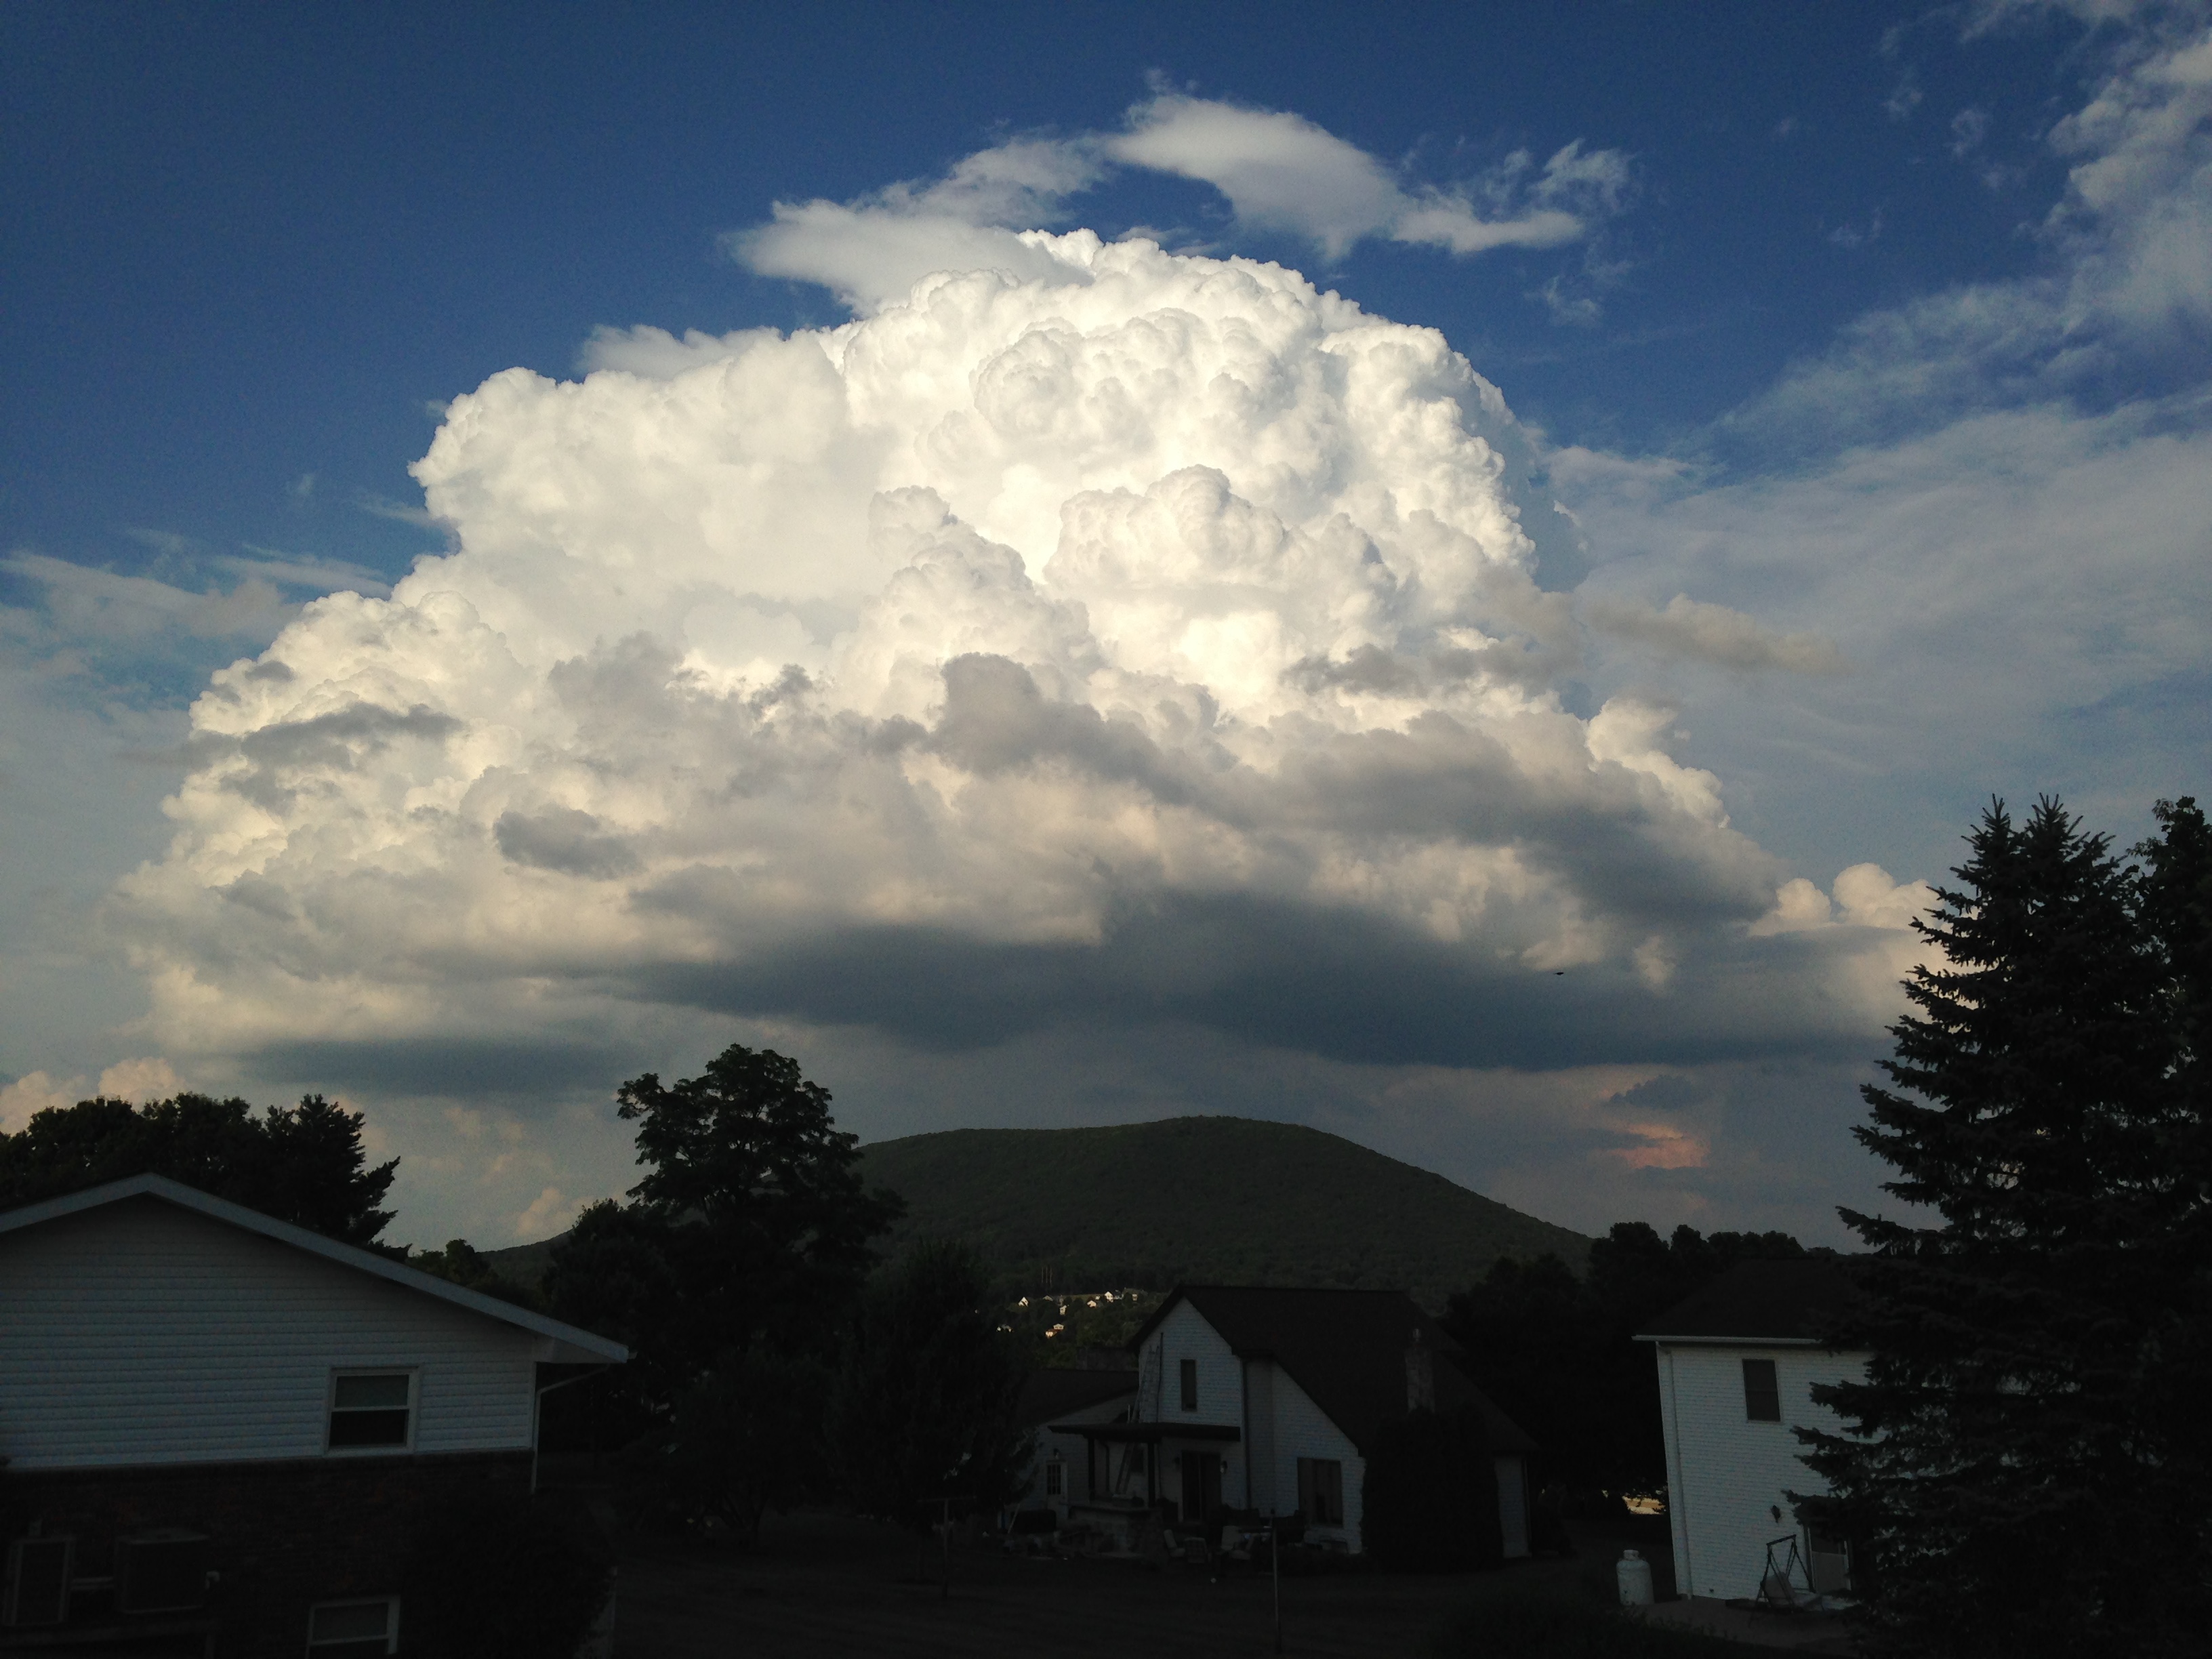
Our experiment in the smoky cylinder mimics what happens when the sun-baked ground heats the atmosphere from below causing air to become positively buoyant and rise via convection. If the air rises far enough that it cools to the point of net condensation, clouds will form, as shown in the image above on the left. Note the "bubbly" or "billowy" appearance to the convective cloud shown above on the left, which develops as eddies rise via positive buoyancy. Clouds forming in such unstable environments are of the cumulus variety, which as you may recall, means "heap cloud."

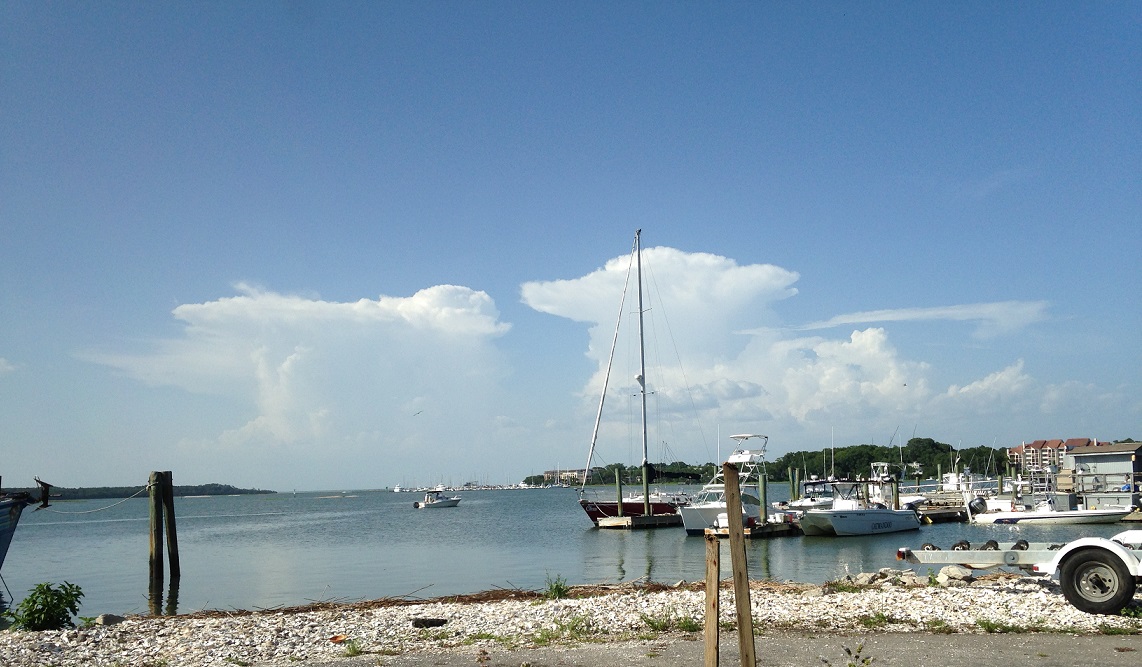
When the layer of instability in the atmosphere is fairly shallow, clouds are often "fair-weather cumulus [9]" (credit: David Babb) which aren't very tall because the layer in which air parcels are positively buoyant is fairly thin. Air parcels rising within fair-weather cumulus clouds typically rise at speeds less than 1 meter per second (often much less). If the layer in which air parcels are positively buoyant is thicker, clouds can become "cumulus congestus [10]" (credit: Steve Seman), also called "towering cumulus" clouds, which are taller and have faster upward velocities (owing to the deeper layer where upward accelerations occur). When the layer in which air parcels are positively buoyant is quite deep, clouds grow into "cumulonimbus clouds [11]" (credit: Steve Seman), which produce precipitation, and can soar to the top of the troposphere (or even a little higher). At the extreme, upward velocities in cumulonimbus clouds can reach near 50 meters per second (more than 100 miles per hour), owing largely to strong positive buoyancy and upward accelerations through a deep layer of the troposphere.
I should also point out that the transition from a fair-weather cumulus to cumulus congestus to a precipitating cumulonimbus cloud isn't as simple as cloud drops growing via net condensation until they're large enough and heavy enough to fall. Cloud drops are typically much smaller than raindrops and can't grow large enough from net condensation alone. Indeed, other processes are at work to make raindrops. Cloud drops can collide and "stick together" within the turbulent air motions in the cloud, which helps the drops grow larger, and more importantly, ice crystals grow high up in the colder parts of the cloud (remember that most precipitation actually starts as snow in the cold upper troposphere).
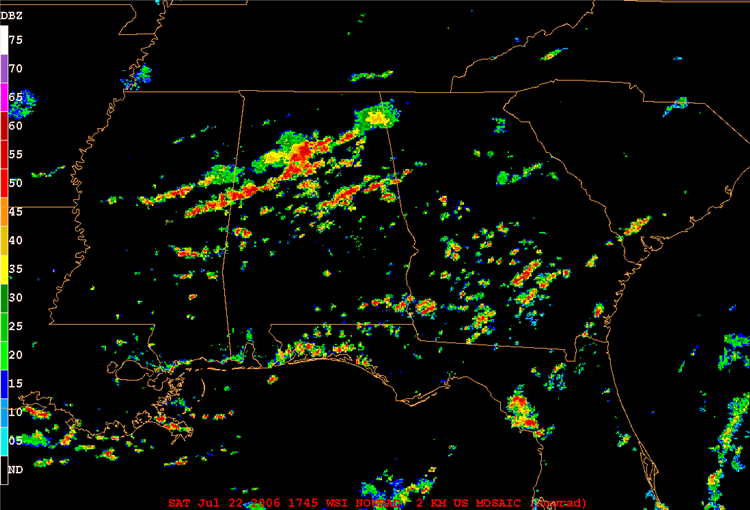
Precipitation that forms in unstable environments from cumulonimbus clouds comes in the form of showers and thunderstorms, which can be somewhat brief, dumping rain on some places while leaving surrounding areas totally dry. Even when cumulonimbus clouds organize into a line or cluster of thunderstorms (ahead of a cold front, for example), the area that gets precipitation can be larger but convective rains still tend to be relatively brief. Check out the 1745Z mosaic of composite radar reflectivity [12], showing thunderstorms over the Deep South on the afternoon of July 22, 2006, for example. Some thunderstorms are discrete (completely separated from other areas of precipitation), while other thunderstorms organized into lines and clusters of storms. Either way, the "splotchy" nature of the radar reflectivity is the hallmark of convective precipitation that formed in an unstable environment.
Now, what about clouds and precipitation in stable environments? At first, it might be tempting to think that clouds and precipitation don't form in stable environments at all, because air parcels are negatively buoyant (and don't accelerate upward). But, that's not true! Stable environments can certainly be favorable for stratus (layered) clouds to form. To see what I mean, let's return to our demonstration with the Plexiglas cylinder into which we've blown some smoke to trace the movement of the air. In this case, however, we'll place the bottom of a Plexiglas cylinder in a tub of ice to let the lower portion chill down for a while. Putting the cylinder on ice simulates the cooling of the ground (and a layer of air in contact with the ground) on a clear, calm night and actually makes the air in the bottom of the cylinder colder than air above it. Such an environment is quite stable since temperatures actually increase with increasing height.
Given the stable environment, it's not surprising that the cold, dense air simply stays at the bottom of the cylinder, as shown in the photograph below on the right. This is much like what happens during the formation of ground fog -- fog forms when stable air near the ground is cooled by the surface. This cooling can occur overnight when the ground loses more energy than it receives (this type of fog is called "radiation fog"). Or, the cooling of the air near the ground can occur as the relatively warm air passes over cold water or snow (which can result in "advection fog").

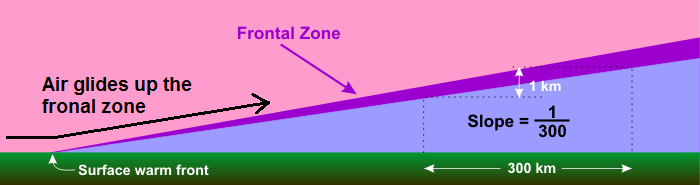
So, fog (a stratus cloud at the ground) forms in a nocturnally cooled layer of air next to the ground (which is extremely stable), but what about stratiform (layered) clouds above the ground? Stratiform clouds that form aloft don't have the luxury of the ground's nocturnal chill. Instead, the lifting of a layer of stable air by a low-pressure system is the most common way to achieve sufficient cooling for stratiform clouds to develop away from the ground. Such lifting by lows is often persistent and slow compared to fast, abrupt uplift in powerful thunderstorms. Indeed, upward speeds associated with stratiform clouds are typically gentle, averaging on the order of several centimeters per second or less.
Keep in mind that stable layers of air, if left undisturbed, resist upward displacement, so some external factor, such as overrunning, must do the heavy lifting. As an entire layer of air glides upward [13], it cools to the point of net condensation and clouds form. But, air parcels within this layer are negatively buoyant, so they don't accelerate upward. In fact, they would tend to sink if the process of overrunning wasn't forcing the entire layer to glide upward. Once air parcels' negative buoyancy becomes too great to be overcome by overrunning, parcels simply spread out horizontally, resulting in widespread, layered clouds. The clouds that form as a result of lifting a stable layer are typically rather shallow, meaning that stratiform clouds are much wider than they are tall (in stark contrast to cumulus congestus or cumulonimbus clouds). So, stratiform clouds naturally come by their name "stratus," (which, derived from Latin, means "to spread out").
Moreover, stratiform clouds have fairly smooth bottoms and tops (think of the smooth top of a layer of fog) compared to cumuliform clouds, which look like uneven heaps of cotton. You can see the visual "smoothness" of stratiform clouds in the images below, which show cirrostratus (left), altostratus (middle), and stratus (right). The visual cues that characterize these clouds (in terms of their height and thickness) provide key clues to weather forecasters and savvy weather watchers about impending weather, as you may recall from our study of the progression of clouds associated with warm fronts.

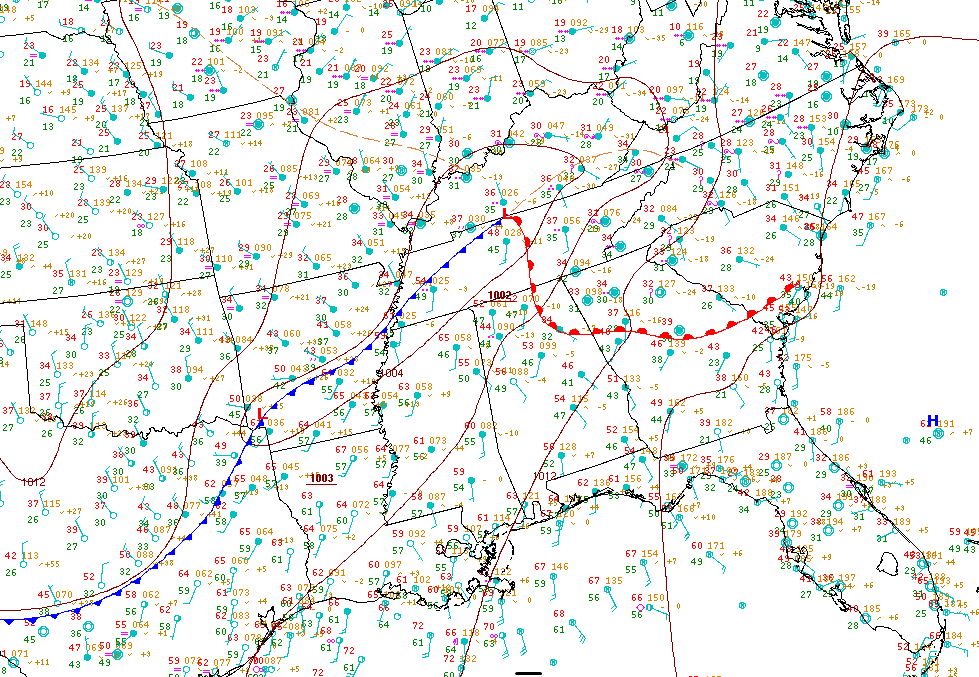
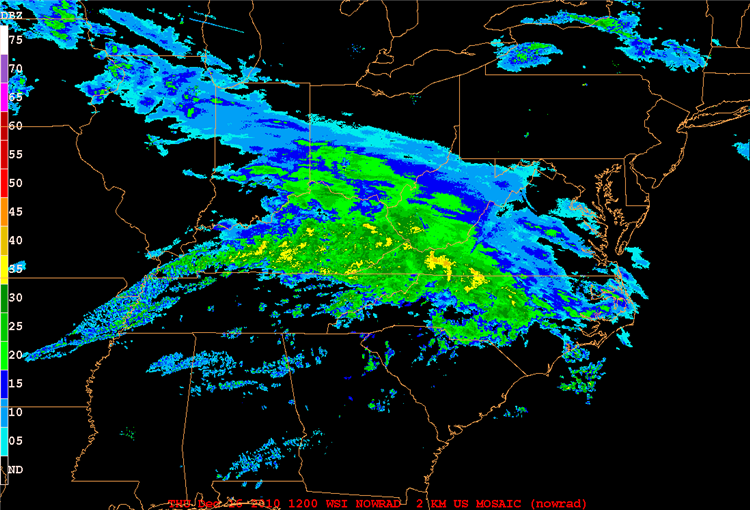
When stratiform clouds precipitate (nimbostratus), rain, snow, sleet, or freezing rain tends to be steady, relatively long-lived (a few to several hours), and spread out over a fairly large region. To see what I mean, check out the 12Z surface analysis on December 16, 2010 [14]. At the time, there was a low-pressure system centered over the Tennessee-Kentucky border with a warm front extending southeastward to eastern South Carolina. If you closely examine the station models, you will note a blob of stratiform precipitation over parts of the Carolinas, Ohio Valley and the Middle Atlantic States (primarily freezing rain and light snow). The mosaic of composite reflectivity at 12Z on December 16, 2010 [15] confirms the breadth of the stratiform precipitation north of the low's warm front.
So, the gentle, broad upward motion that occurs in stable environments results in layered, stratiform clouds and large areas of steady precipitation (if nimbostratus clouds form). That's in stark contrast to the potentially vigorous upward motions caused by positively buoyant air parcels in unstable environments. Convective updrafts can lead to heavy (although often brief) showers and thunderstorms that may only affect limited areas. The vigorous upward motion can also ultimately put the "thunder" in thunderstorms through the creation of lightning. We'll tackle the basics of lightning and lightning safety up next!
Lightning
Prioritize...
When you've finished this page, you should be able to discuss why fast convective updrafts are required for lightning formation. You should also be able to discuss the myth of "heat lightning," trends in lightning fatalities (who is most often struck and when the greatest risk for fatalities occurs with respect to a passing thunderstorm), and key safety tips for avoiding lightning strikes.
Read...
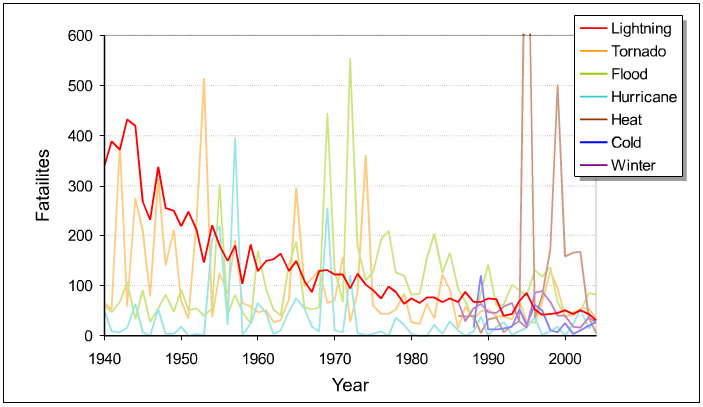
The annual list of fatalities from severe weather in the United States is compelling (see chart below). Most of the lines show lots of year-to-year variability, and major individual events easily stick out, like the spike of heat-related deaths in 1995, when a great heat wave overtook the Midwest in July, and several hundred people died in Chicago [16]. But, of all the lines on the graph, one really sticks out to me -- the red one representing deaths from lightning. It shows a clear downward trend from 1940, and lightning deaths have settled below 50 per year, on average.
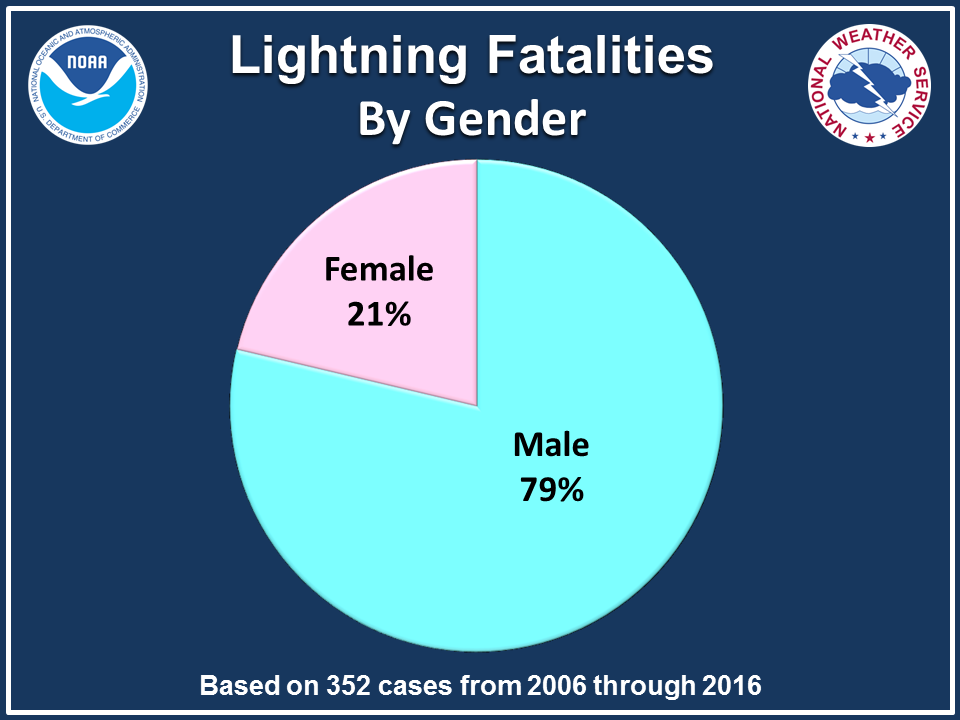
Despite the decrease in lightning fatalities (even while a large increase in population occurred), each year in the United States a few hundred people are struck by lightning and a few dozen die (on average), so there's still work to be done. Of those killed each year by lightning, on average, nearly 80 percent are male [17]. Research suggests that more men may be struck by lightning because they're more likely to be in vulnerable outdoor situations where finding shelter may be difficult (boating, fishing, camping, doing construction work, etc.), and they're too slow (or reluctant) to be convinced of the imminent threat of lightning.
You might think of lightning as a "bolt" from a cloud to the ground, but such "cloud-to-ground" (CG) lightning only accounts for about a fourth to a third of all lightning. Intra-cloud (IC) and cloud-to-cloud (CC) lightning are much more common and account for two-thirds to three-fourths of all lightning flashes. Other, much less common forms of lightning also exist, such as cloud-to-air lightning, and sprites [18]. By the way, you may have noticed that I didn't mention "heat lightning" as a type of lightning. That's because there's no such thing as "heat lightning" (as in, lightning caused by heat). What most people refer to as "heat lightning" is just lightning that's created in a distant thunderstorm (too far away to hear the thunder). I'd imagine that people started using the term "heat lightning" because they noticed lightning without thunder on very warm, humid summer nights as thunderstorms roamed in the distance.

Regardless of the type of lightning, there's much more to lightning than meets the eye. A lightning bolt is not a single "flash in the pan." Lightning is actually quite complex, as the spectacular slow-motion lightning video on the right shows. Here's another slow-motion video of a lightning strike [19] (credit: NOAA) which confirms that there seem to be multiple "parts" to a lightning strike (here's the same video slowed down even more [20]). If you want to read more about the "parts" that make up a lightning strike (namely "stepped leaders," "return strokes," and "dart leaders") check out this series of pages on the anatomy of lightning [21] from the National Weather Service.
Complexities aside, lightning is the difference between a convective rain shower and a thunderstorm. In the most basic sense, lightning is like a spark from a light switch to your finger after you walked across a carpet during the wintertime. Lightning is simply an electrical discharge from a cumulonimbus cloud that occurs when an imbalance in electric charge exceeds the electrical resistance of the air (the electrical resistance is substantial because air near sea level has a low electrical conductivity). As a result of air's high resistance, lightning rapidly heats a narrow channel to temperatures near 50,000 degrees Fahrenheit (resistors warm when electricity passes through them). That's hotter than the surface of the sun! Such intense heating prompts the emission of visible light. Moreover, super-heated air expands rapidly, producing shock waves that are heard as sharp claps or bangs near the strike. Farther away, shock waves give way to sound waves, and peals of thunder reverberate for several miles. So, you can't have a thunderstorm without lightning.
And, if you can't have a thunderstorm without lightning, you can't have a thunderstorm without speedy, convective updrafts. Why is that? Well, for lightning to occur, we need an electric field that results from electrically charged particles, and air rising rapidly thanks to positive buoyancy within cumulonimbus clouds can create a separation of charges as large as several hundred million volts (a million times greater than the voltage in a typical home). Let's first look at the typical distribution of electrical charges in a typical thunderstorm (see image below).

In a nutshell, an area of positive charge develops in the upper reaches of the cloud, while the lower and middle parts of the cloud take on a negative charge as positive charge develops on the ground. How does this distribution arise? Well, truth be told, more than 250 years after Ben Franklin's initial work in 1752, we still do not fully understand the processes by which cumulonimbus clouds become electrified. There are several theories that aim to describe the electrification of cumulonimbus clouds, but I'll only quickly summarize one leading theory, which is based on the idea that the electrification of cumulonimbus clouds hinges on fast convective updrafts above the melting level, which results in collisions between ice particles, causing charge separation.
High up in cumulonimbus clouds, supercooled liquid cloud drops, ice crystals, hail (frozen raindrops), and graupel [22] (also called "snow pellets," which are snowflakes coated with ice that formed as supercooled cloud drops froze on contact) all coexist. The fast convective upward motions cause ice particles to collide and exchange ions (charged particles), and in doing so, they become electrically charged [23], with graupel taking on a net negative charge and smaller ice crystals a net positive charge. I'm skipping the details, but the bottom line is that heavier graupel, with its net negative charge ends up distributed in the lower and middle parts of the cloud, while smaller, lighter ice crystals with their positive charge, get swept toward the top of the cloud in the storm's speedy updraft. As all this occurs, positive charge develops at the earth's surface, which follows the storm like a shadow, and after the seperation of charges becomes great enough, lightning occurs. So, ultimately, lightning requires speedy, convective updrafts to cause collisions between ice particles and charge separation in the cloud.
Lightning Safety
As visually spectacular and fascinating (at least in my opinion!) as lightning can be, it is extremely dangerous. While about 90 percent of lightning-strike victims live to tell the tale, many survivors suffer permanent disabilities, often from injuries to the nervous system. So, how can you keep yourself safe? Well, make no mistake about it: you are NOT safe outside when a thunderstorm is nearby. The National Weather Service has adopted the phrase, "When thunder roars, go indoors," and those are good words to live by. If you can hear thunder, lightning is close enough to potentially strike you. And, lightning need not directly strike you to injure or kill you. People can be injured or killed by "side flashes," which occur when lightning strikes another object near a person (usually within a few feet) and a portion of the current jumps to the victim. Another danger stems from the fact that when lightning strikes any object, much of the energy travels outward along the ground, and can enter the body where it contacts the ground (most lightning injuries and deaths actually occur from such "ground current"). Lightning can also travel long distances in wires or other metal surfaces (like the plumbing in your home, electrical wires, corded phones, etc.), which provide a path for the lightning to follow. Such "strikes by conduction" through metal objects are the leading cause of indoor lightning injuries and deaths.
When it comes to outdoor lightning fatalities, the greatest risk actually doesn't occur when the storm is right overhead (when most of the lightning is occurring). That might seem odd, but there's a fairly simple reason -- most people have taken shelter by the time the worst part of the storm occurs. As this animation about lightning casualties [24] from NOAA shows, the greatest risk for lightning deaths actually occurs as a storm approaches because people don't take shelter quickly enough (they mistakenly think they still have time before the lightning arrives). A lightning strike to a golf course tree at the 2019 U.S. Women's Open [25] just after the course had been cleared provides a good example. A lightning strike split the trunk of a tree, even though the heart of the storm hadn't arrived yet. Fortunately, the vast majority of people had taken shelter and nobody was injured (those who remained outside were lucky), but it was a close call! There's another spike in casualty risk after a storm passes because people go outside too soon as the storm departs. Keep in mind that some lightning bolts seemingly come "out of the blue," from parts of the cumulonimbus cloud where it's not raining, so even though you think a storm might be over, the risk posed by lightning isn't.

So, if you can hear thunder, you really should head to a safe shelter (a sturdy building or at least a metal-topped automobile with the windows up), and you should remain inside for at least 30 minutes after you hear the last rumble of thunder. Whenever you're involved in an outdoor activity, you should always plan ahead and have a reliable source of weather information. If thunderstorms are in the forecast, keep in mind that you may need to seek shelter at some point. If you absolutely cannot get inside ahead of a thunderstorm, the National Weather Service lists some things you can do to slightly decrease your chances of getting struck:
- Avoid open fields and hilltops.
- Stay away from isolated tall trees (or other tall objects). If you're in a forest, stay near some shorter trees, if possible.
- If you are in a group of people, spread out to avoid the current traveling in between members of the group.
- If you are camping in an open area, set up camp in a low area (valley or ravine, if possible). Your tent will not protect you.
- Avoid water, wet items, and metal objects (like fences or poles).
Certainly being indoors is much safer during a thunderstorm, but lightning can still pose dangers when you're inside. The National Weather Service recommends the following in order to stay safe indoors during a thunderstorm:
- Stay off corded phones (cordless or cell phones are okay).
- Don't touch electrical equipment (computers, televisions, other appliances, etc.) or electrical cords.
- Avoid plumbing (don't take a bath or shower, wash your hands, or wash dishes).
- Stay away from windows and doors, and stay off of porches.
- Do not lie on concrete floors or lean against concrete walls.
If by chance you are with someone who has been struck by lightning, they may need immediate medical attention. Call 911 immediately, and start CPR if needed. Keep in mind that lightning-strike victims are safe to touch (they do not carry electrical charge). I should also note that lightning poses a risk to property, as well, as it can ignite fires and damage household electronics (even miles away from the strike point).
If you're interested in learning more about lightning and lightning safety, I encourage you to check out the National Weather Service Lightning Safety site [26]. The information there could save your life! Now we must tackle the issue of what regions are most susceptible to thunderstorms (and why). We'll explore the climatology of thunderstorms next! Read on.
Thunderstorm Climatology
Prioritize...
When you've completed this section, you should be able to identify favorable geographical locations for thunderstorms in the United States and worldwide, and discuss why coastlines and mountain ranges can be favorable regions for thunderstorms.
Read...
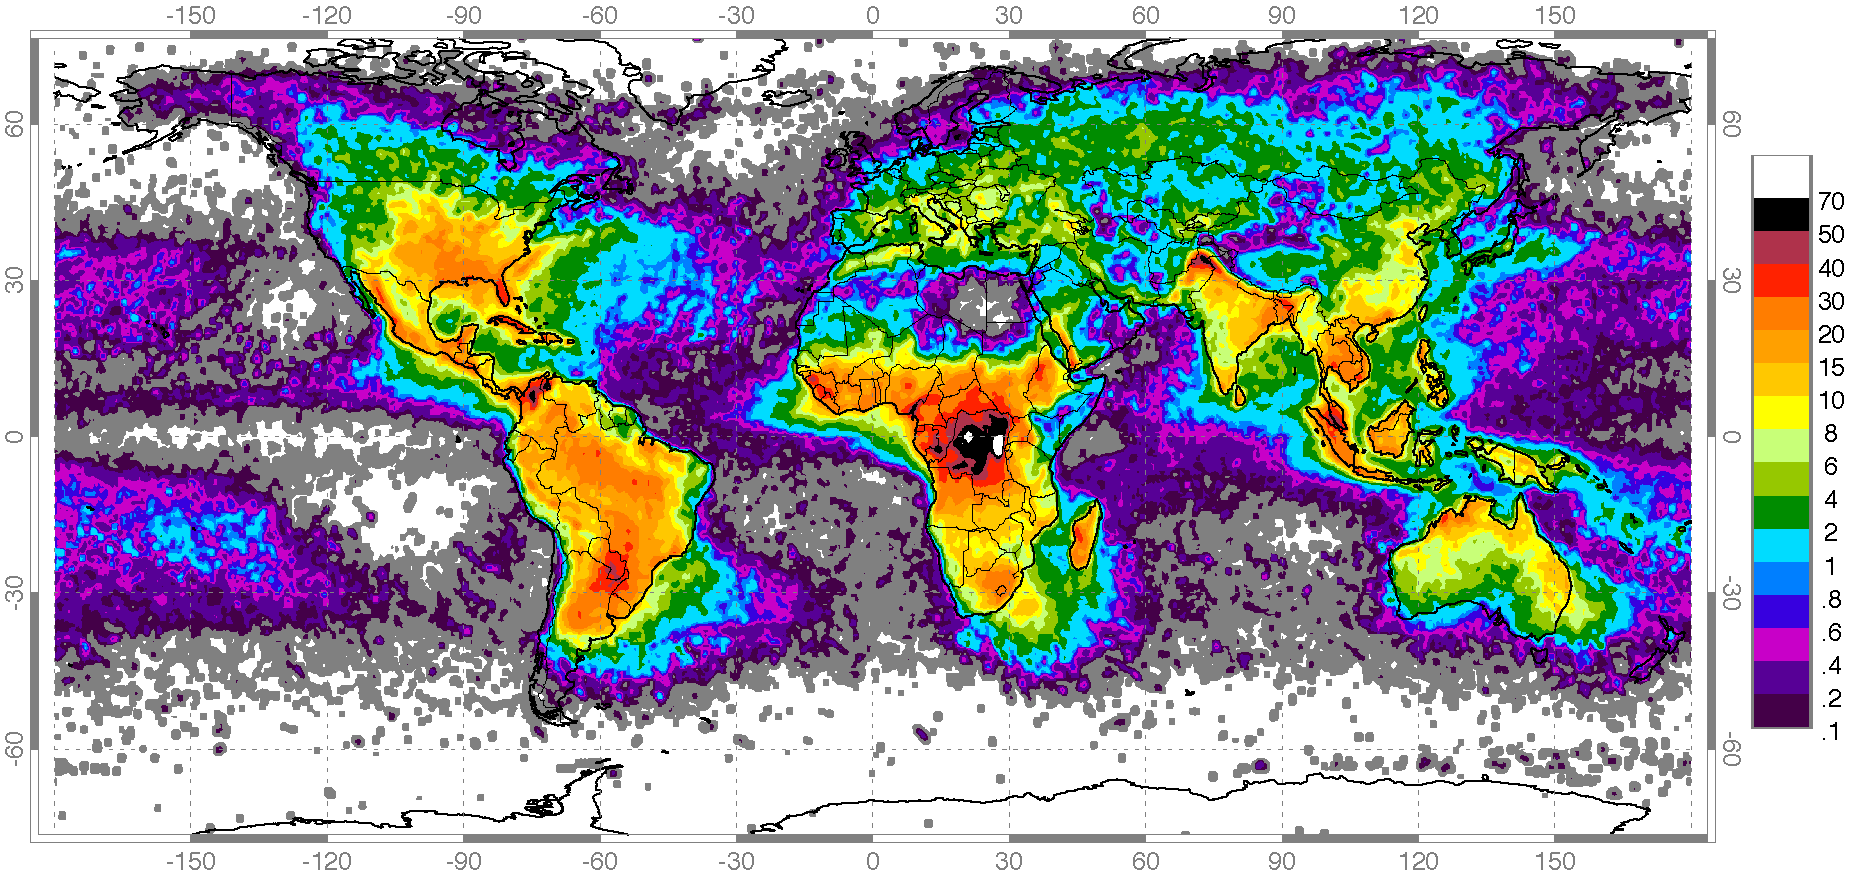
Given the potential dangers posed by lightning, are there any parts of the globe that are immune from thunderstorms? Not entirely, although some areas only rarely experience them. This map from NASA showing worldwide lightning strikes [27] from April 1995 to February 2003 (values are strikes per square kilometer per year) shows that lightning strikes (and therefore, thunderstorms) are common on six of the seven continents. Antarctica has very few lightning strikes (although they do occur on rare occasion), and areas over cooler oceans also experience lightning strikes relatively infrequently.
Thunderstorms tend to be most frequent over continents in areas where strong solar heating favors positively buoyant air parcels and convection. The greatest frequency of lightning occurs over equatorial Africa, and other low-latitude land areas also have relatively high frequencies of lightning. In fact, some equatorial locations experience thunderstorms on about half the days each year, on average.
In the United States, thunderstorms occur in all 50 states as shown by the map of the average number of "thunderstorm days" each year (below). Thunderstorms are most frequent in the Southeast U.S., especially along the Gulf Coast from Louisiana to Florida. Thunderstorms are also fairly frequent in the rest of the Southeast U.S. into the Great Plains of the U.S. (more than 50 days per year, on average, with thunderstorms).
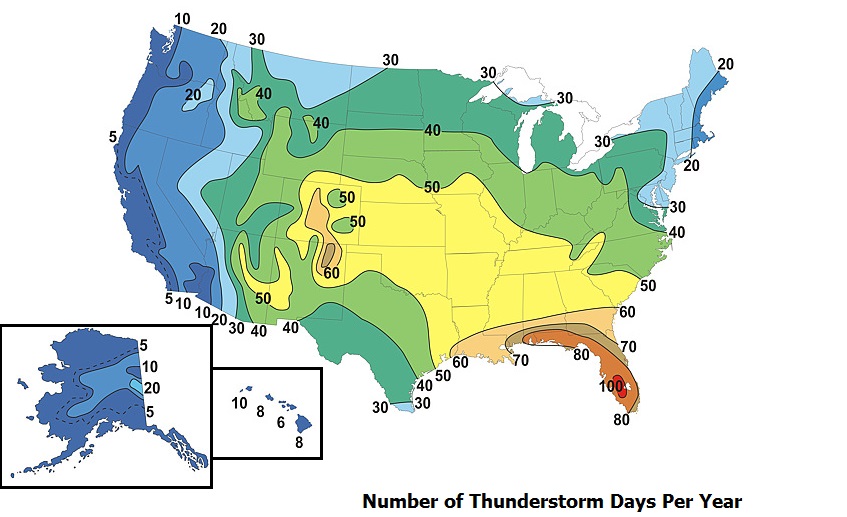
The frequent occurrence of thunderstorms in the Southeast U.S. over toward the Great Plains results from the regular presence of warm, moist maritime-Tropical air from the Gulf of Mexico. Especially in the warmer months, this warm, humid air often favors positively buoyant air parcels that can blossom into cumulonimbus clouds and thunderstorms. But, this map has a couple of interesting features that I want to explore further. In particular, Florida takes the trophy for most thunderstorms in the U.S., on average, with parts of Florida experiencing thunderstorms more than 100 days per year, on average. Furthermore, there's a curious maximum in thunderstorm frequency over the central Rocky Mountains in Colorado and New Mexico (60+ days per year with thunderstorms, on average). You might not think of the Rockies as a "hotbed" for thunderstorms, but indeed, they are! Let's explore the reasons why thunderstorms are so frequent in Florida and the Rockies. Up first -- Florida.
Sea Breezes and Thunderstorms
The main reason for many of the thunderstorms in the warmer months along the Gulf Coast and over Florida is a small-scale wind circulation called the "sea breeze." If you've ever noticed a strong, cooling onshore breeze that often develops in the afternoon at the beach, you've noticed the sea breeze! The sea breeze develops because of uneven heating between land and water. On a sunny day, the land warms more quickly than adjacent ocean waters, which causes the mean density of air columns over land to decrease slightly, which reduces the weight of local air columns and reduces surface pressure. Meanwhile, the air over water remains cooler (and more dense) and an area of high pressure develops offshore. These pressure differences cause low-level air to flow from the water to the land, generating an onshore wind called the sea breeze. In order for a sea breeze to form, the temperature difference between land and water must be large enough to generate a sufficient pressure difference between land and water, and the day otherwise cannot be too windy. If the day is windy before the sea breeze even develops, the winds will overwhelm the sea breeze.
The sea breeze is actually a three-dimensional circulation [28], in which low-level air flows onshore, rises over land, and then flows offshore aloft (about one kilometer above the surface). But, the boundary between the cooler maritime air flowing onshore and the hotter air over land (called the sea-breeze front), is a source of great interest to weather forecasters because it acts like a miniature cold front, meaning that low-level convergence occurs along it as cooler air pushes onshore. Low-level convergence along the sea-breeze front gives hot, humid air parcels on land an upward nudge, and sometimes that's all they need. Their positive buoyancy takes over and off to the races they go, growing into cumulonimbus clouds and thunderstorms.
The regular occurrence of sea breezes is a big reason behind the high frequency of thunderstorms along the Gulf Coast and Southeast Coast of the U.S. But, why is Florida, in particular, such a prime area for thunderstorms? Of course, an abundance of warm, moist maritime-Tropical air is a helpful ingredient because it favors positively buoyant air parcels. But, the schematic below tells the rest of the story. On sunny days with fairly weak winds overall, there's often not just one sea-breeze front in Florida; sea-breeze fronts press inland from both the Atlantic Ocean from the east and the Gulf of Mexico from the west.

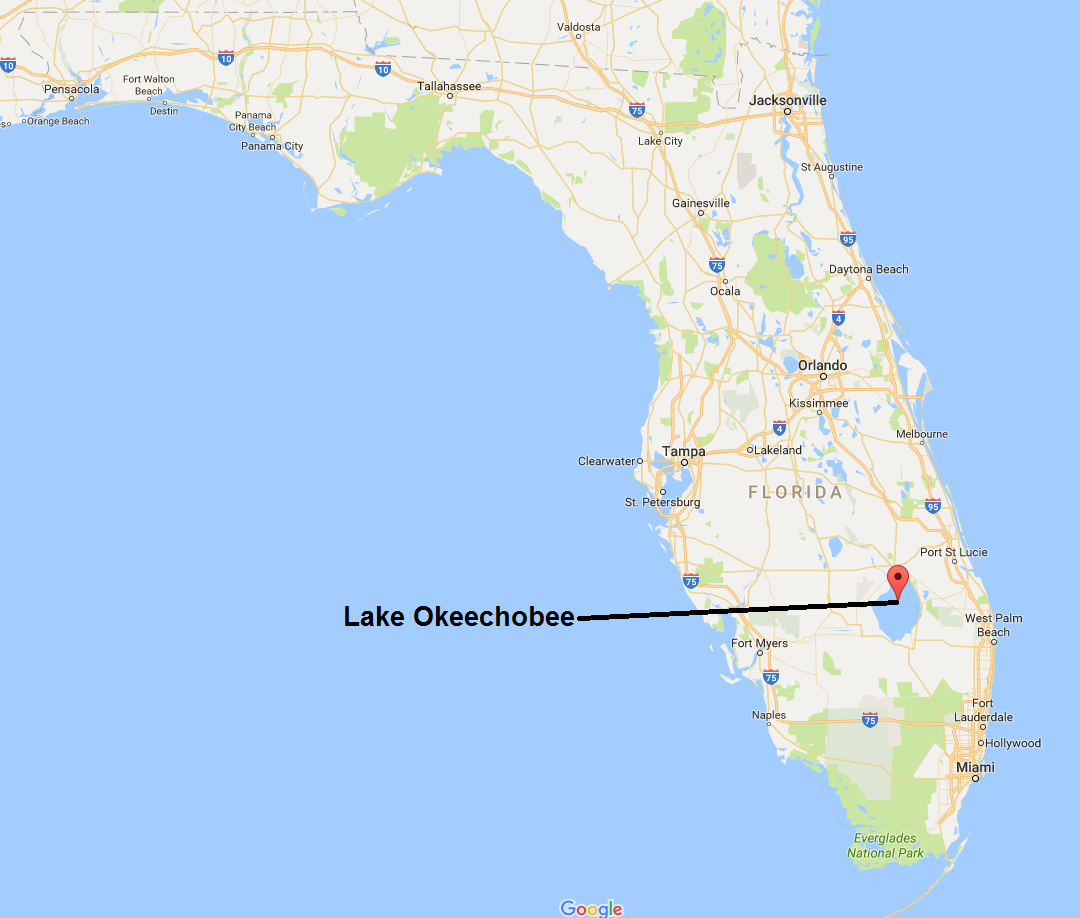
In addition, lakes and other smaller bodies of water can also create circulations similar to the sea breeze. In Florida, "lake-breeze" fronts can push onshore from Lake Okeechobee [29], for example. So, the combination of sea-breeze fronts and a lake-breeze front from Lake Okeechobee means that there are boundaries galore in Florida, as this annotated visible satellite image from May 5, 2007 [30] shows. Each boundary has low-level convergence along it, and when these boundaries collide, the low-level convergence can get even stronger, which gives air parcels a stronger push upward, initiating thunderstorms if the air parcels happen to be positively buoyant. To see a real example, watch numerous thunderstorms blossom over Florida on this loop of visible satellite images from May 30, 2002 [31]. The corresponding radar loop [32] shows the numerous storms that developed, which brought heavy rain and hail. So, the regular presence of air parcels that can become positively buoyant and a plethora of boundaries and low-level convergence to give parcels a push upward makes Florida the thunderstorm (and lightning) capital of the U.S.!
High-Level Heat Source Thunderstorms
What about the maximum in thunderstorm frequency over the Rocky Mountains in Colorado and New Mexico? How could a mountainous region favor thunderstorm development? In a nutshell, it comes down to uneven heating again. On a sunny day with weak winds overall, as the sun heats the mountain, surface air in contact with the mountain warms, causing air density and, thus, air pressure to decrease (relative to the surrounding "free atmosphere" not in contact with the mountain). In this way, mountains serve as "high-level heat sources," and the resulting pressure gradient causes air to move toward and up the mountain as shown in the schematic below.

With air rising up the slopes of the mountain during the day, the mountain peak becomes a zone ripe for convergence and further uplift (as suggested by the schematic above). The convergence near the mountain peak, then, gives air parcels a nudge upward, and if they're positively buoyant, thunderstorms can develop. Thunderstorms forming over the mountaintops of the Rockies are more common in the summer if the air flowing up the eastern sides of the mountains is warm, moist air from the Gulf of Mexico. Once thunderstorms blossom near the mountain peaks, they often drift off the mountains (typically toward the east) depending on the winds aloft.
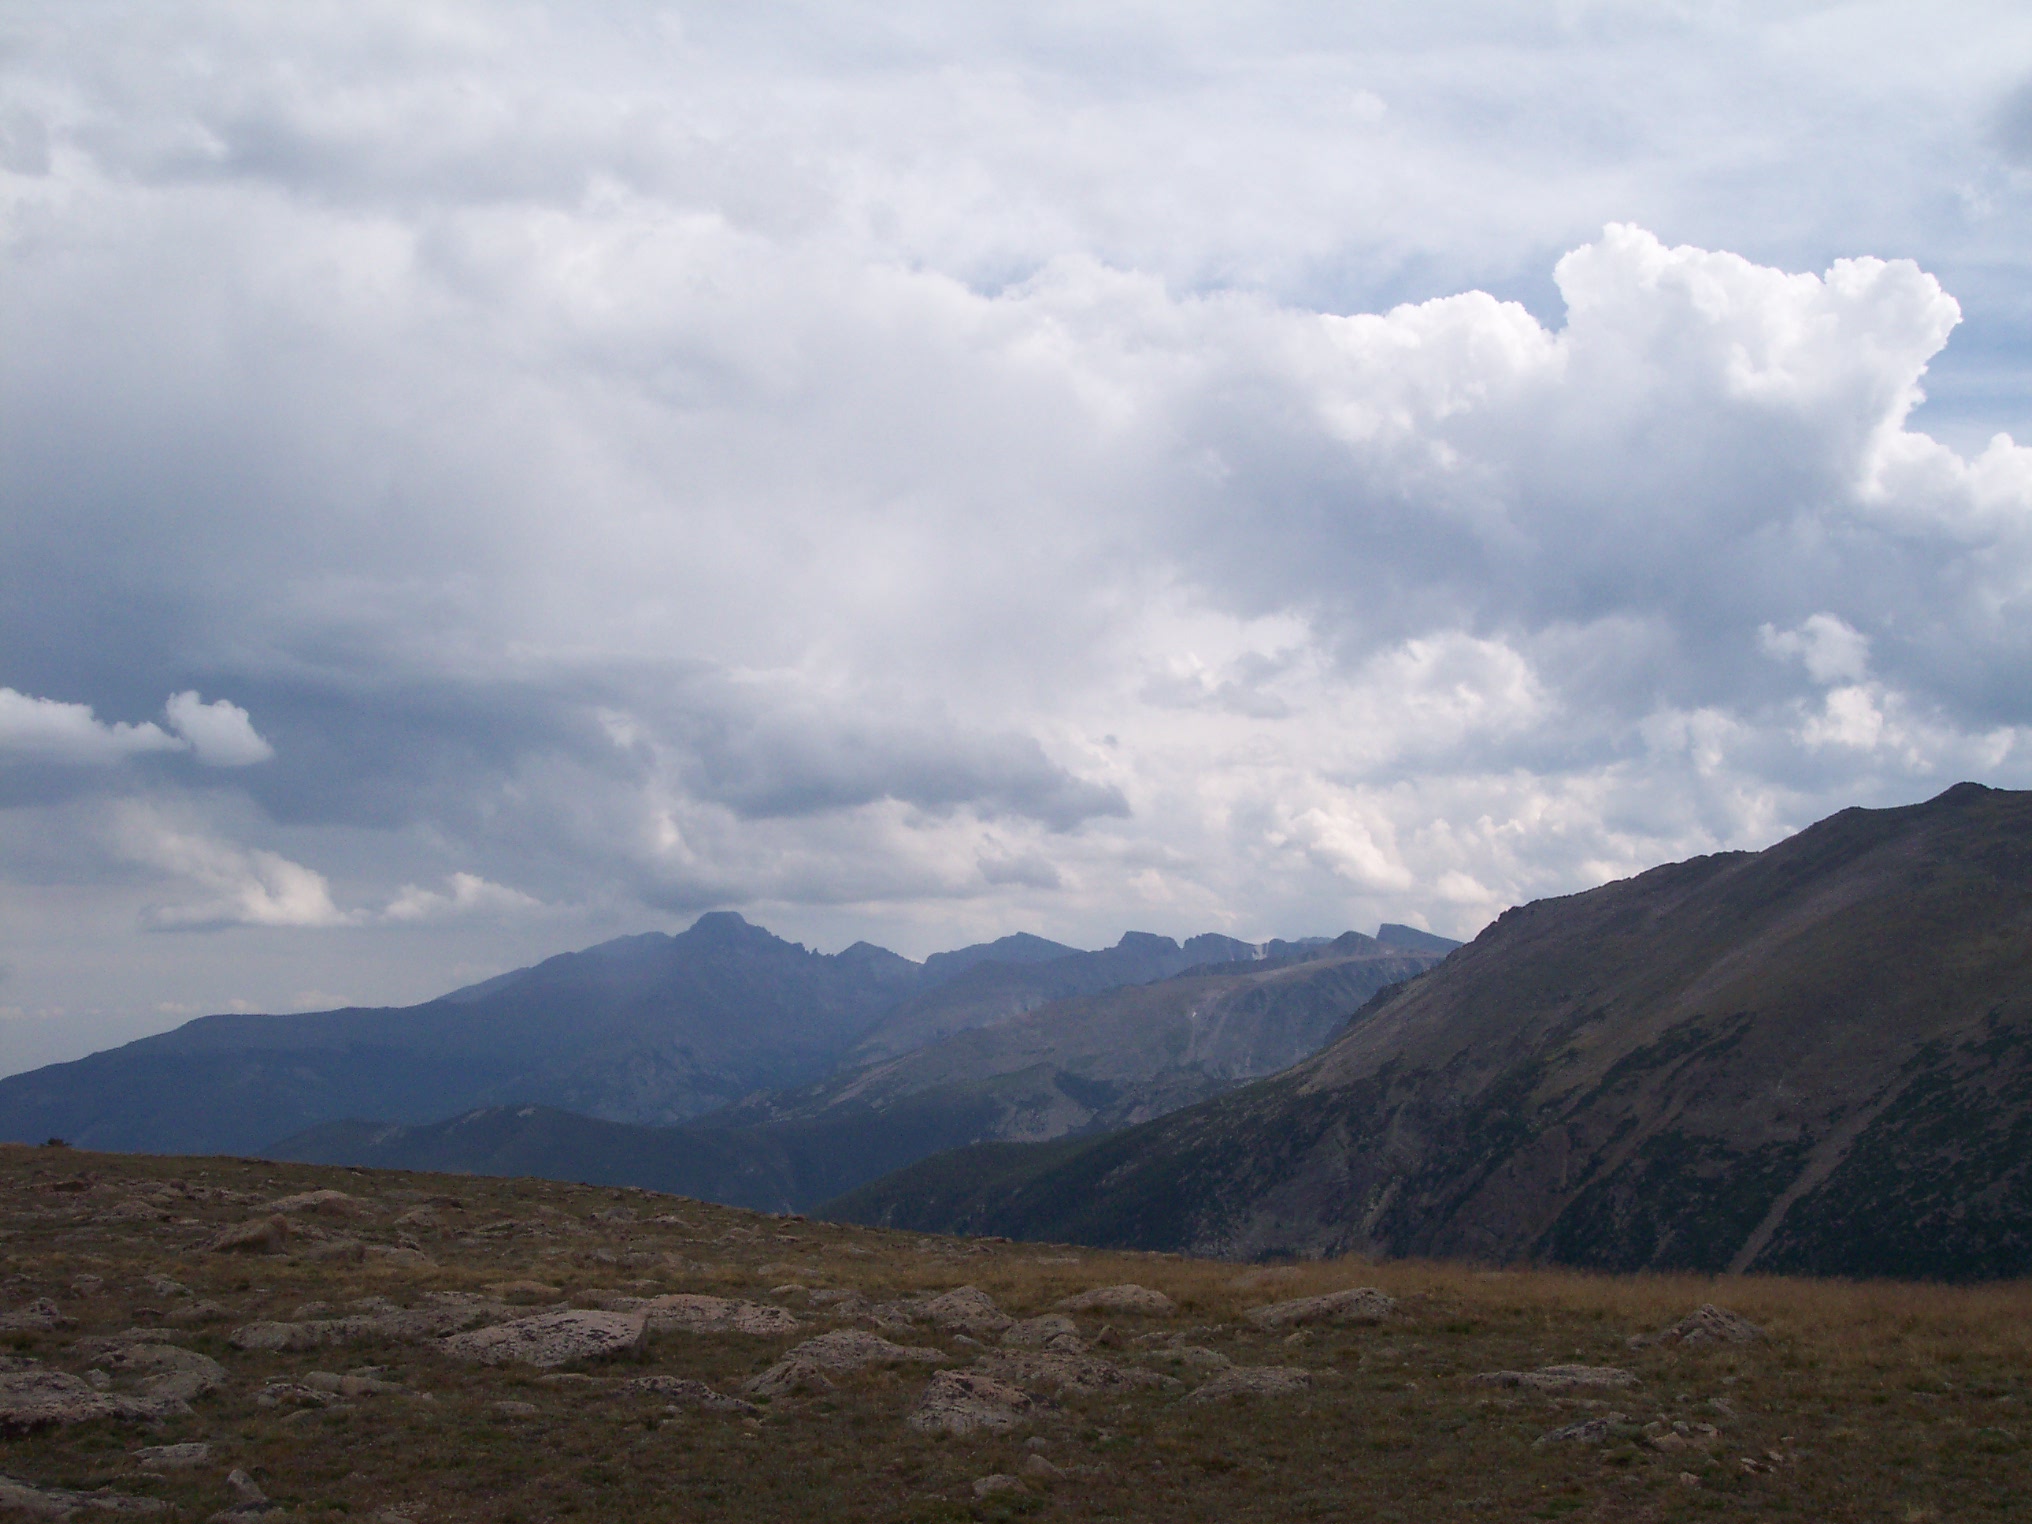
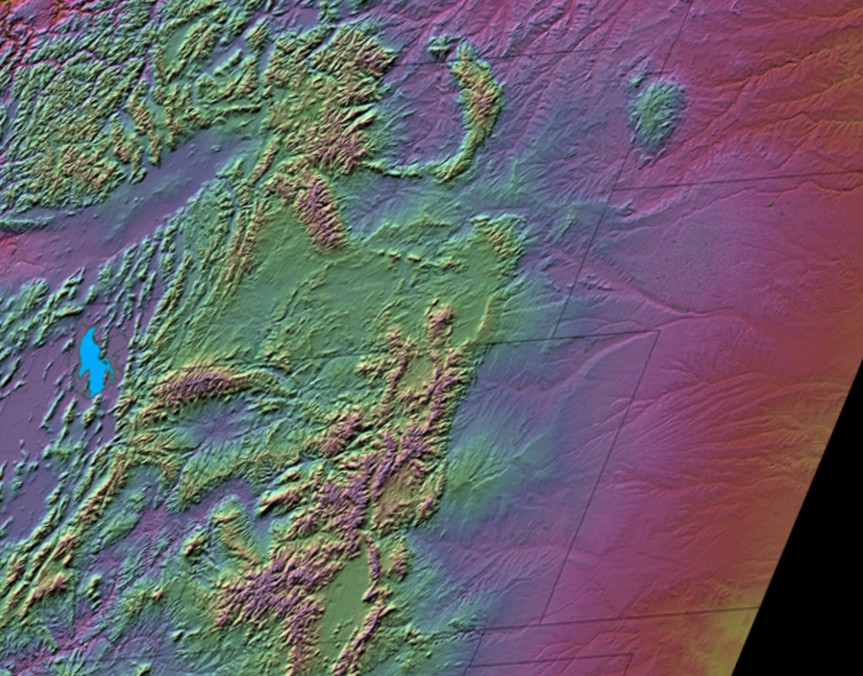
When mountains act as high-level heat sources, initially sunny days with weak winds in the Rockies often aren't very sunny by afternoon. For example, I took this photo in Rocky Mountain National Park [33] in Colorado on an initially sunny day in August, 2006. As commonly happens in the summer, numerous cumulus clouds built throughout the afternoon, which eventually became thunderstorms. To see an example on satellite, check out this sequence of visible satellite images [34] (from 12Z, 17Z, and 21Z on July 7, 2001), and watch the cumulonimbus clouds develop. If you compare the sequence of images with this relief map cropped to the same view [35], you'll see that the thunderstorms developed over the mountaintops.
So, there's no doubt that topography can play a crucial role in initiating thunderstorms, and that's why thunderstorms are more frequent over parts of the Rockies compared to their surroundings. You may also be wondering why relatively few thunderstorms occur west of the Rockies [36]. The simple answer is that the region lacks a source of warm, moist air needed for positively buoyant air parcels. The Pacific Ocean along the West Coast is actually fairly chilly, and as that cool air flows onshore, it tends to stabilize the atmosphere (favoring negatively buoyant parcels). So, the instability needed for thunderstorms is less common in the western U.S., leading to less frequent thunderstorms there (the same can be said for parts of the northern U.S., too).
But, even though some areas experience less frequent thunderstorms, they can happen anywhere in the United States and most land areas of the world. Chances are just about everyone has been affected by a thunderstorm at one time or another (if not many times!). If we want to learn more about thunderstorms, we need to examine their anatomy and life cycle. We'll start exploring those topics in the next section.
Single-Cell Thunderstorms
Prioritize...
When you're finished with this section, you should be able to describe the life cycle of a single-cell thunderstorm (including characteristics of the cumulus, mature, and dissipating stages). You should also be able to define the following terms -- updraft, entrainment, downdraft, gust front / outflow boundary, and anvil.
Read...
Have you ever heard a weather forecaster predict "random" afternoon "pop-up" thunderstorms on a summer day? In hot, humid summer air masses, it may seem that thunderstorms erupt rather randomly. But, thunderstorms never really erupt randomly, even if it appears that way. Think about it: "Random" thunderstorm development would mean that they develop on a whim, for no reason at all. As you've learned, thunderstorms tend to form when air parcels can become positively buoyant after being given a nudge upward (perhaps from low-level convergence along a cold front or sea-breeze front). Still, sometimes thunderstorms seem awfully disorganized. Take, for example, this image of radar reflectivity from 2055Z on June 14, 2015 [37] and note the widely scattered thunderstorm cells across the Southeast U.S.
These disorganized, individual thunderstorm cells that are sometimes referred to as "random pop-up" thunderstorms are single-cell thunderstorms. The reason they often appear random is because we don't have the capability of predicting exactly where and when local conditions are just right for storm initiation. Typically, very subtle regions of uneven heating (which we can't measure directly with our network of weather observations) create very small areas of low-level convergence that give parcels an upward nudge, setting the stage for thunderstorms. We're still a long way from being able to regularly make such observations and predictions skillfully, so keep that in mind when you hear forecasters make bold claims about their ability to give hyper-local weather forecasts and predict storms "in your backyard." With that said, let's take a closer look at the development and life of single-cell thunderstorms.
The Life-Cycle of Single-Cell Thunderstorms

Essentially, single-cell thunderstorms go through three distinct stages during their lives, but the process gets started when positively buoyant air parcels rise to the point of net condensation, forming cumulus and perhaps cumulus congestus clouds (like the one in the image on the right) typically in the late morning or early afternoon hours. Eventually, a single rising column of positively buoyant air emerges, which is called the updraft, as the warming that occurs in the cloud because of net condensation increases the positive buoyancy of the air parcels.
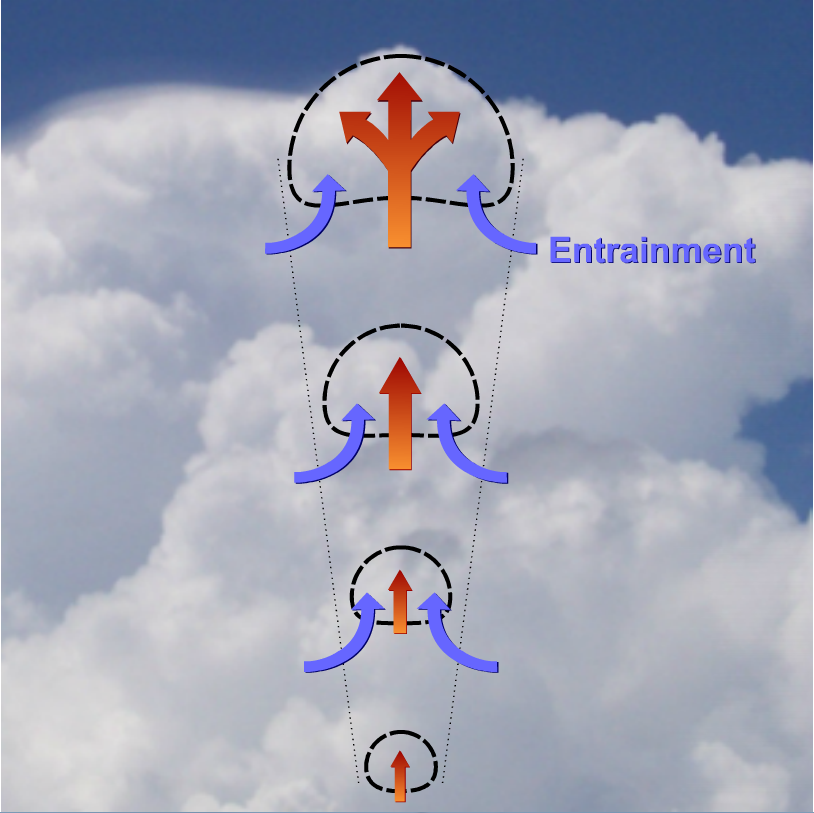
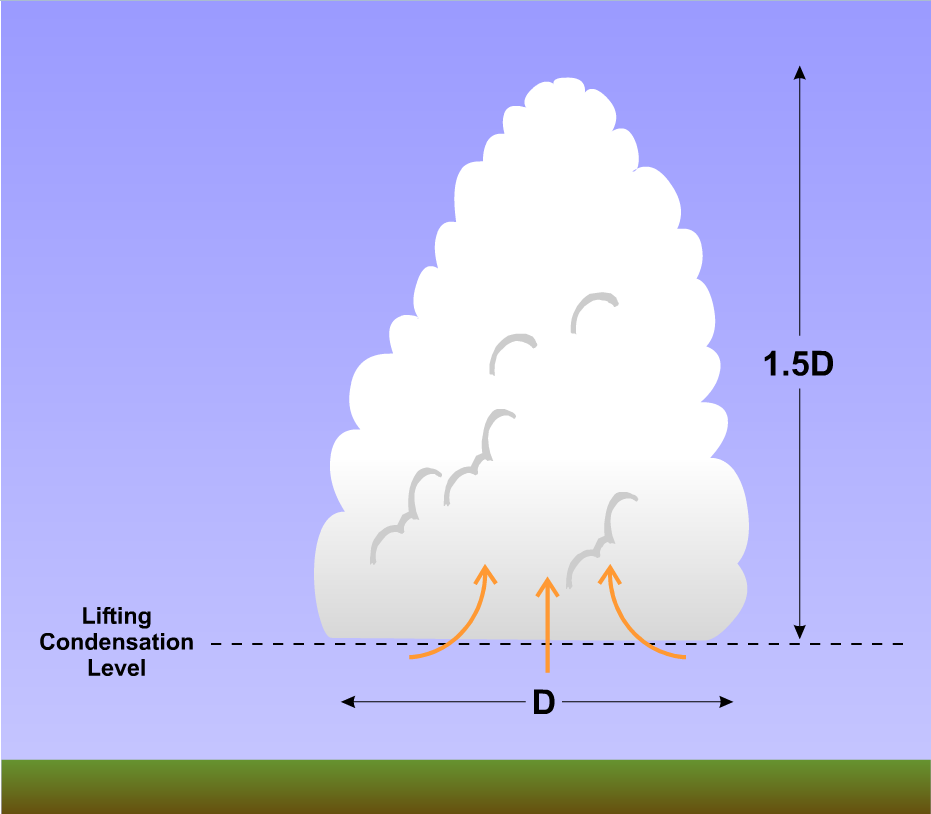
But, these initial cumulus or cumulus congestus clouds typically don't become thunderstorms. Why is that? Well, when working with air parcels, we assume that the air in the parcel doesn't mix with its surroundings, which is unrealistic. In reality, positively buoyant air parcels that comprise the updraft of a growing cumulus cloud actually do mix with surrounding cooler, drier air in a process called entrainment [38], which is bad news for aspiring cumulus clouds. Indeed, as cumulus clouds build skyward above the lifting condensation level (which marks the cloud base, as you may recall), the entrainment of drier air causes some cloud droplets to evaporate. Cooling associated with evaporating cloud drops increases the density and reduces the buoyancy of the air parcels, and by the time the cumulus builds to a depth of about one and a half times its diameter at the lifting condensation level [39], the air loses its buoyancy. All is not lost, however. These initial cumulus clouds, which ultimately "fizzle out," serve a purpose, and help pave the way for thunderstorm development. Let's explore the process, as we investigate the first stage in a single-cell thunderstorm's life cycle -- the cumulus stage.
Cumulus Stage
While initial cumulus clouds often die, they do not die in vain. New cumulus clouds often develop in the same column as the original cumulus, and they benefit from the water vapor from cloud droplets that evaporated earlier. Entrainment into the developing new cumulus still occurs, but the air mixing into the cloud has a higher relative humidity than before, which as you may recall, leaves less potential for net evaporation (and evaporational cooling). If there's a sufficient supply of low-level moisture and persistent positively buoyant parcels over time, a succession of cumulus clouds can now grow and ebb in a single column of air. Eventually, clouds graduate from fair-weather cumulus to towering cumulus congestus.
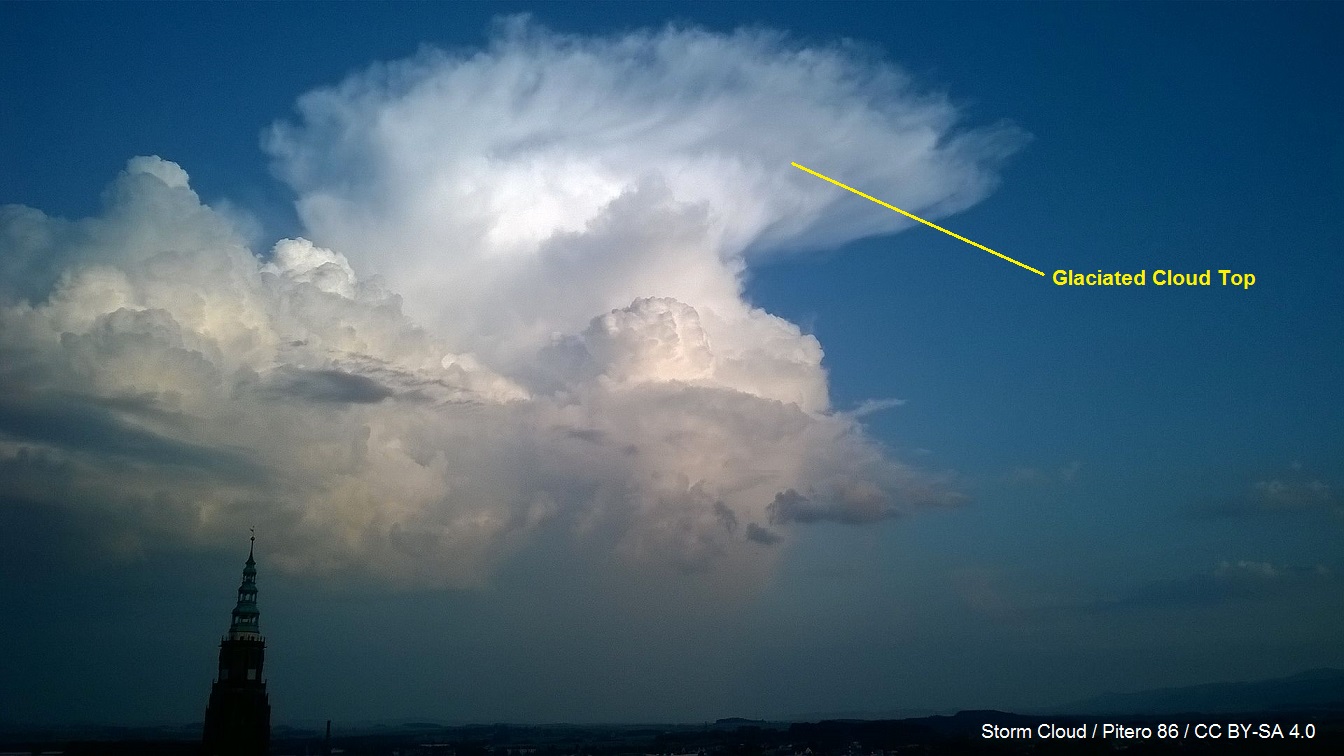
The presence of towering cumulus indicates a dramatic change in the tenor of the convection. During this stage, the growing towering cumulus cloud is dominated by updrafts [40], and updrafts accelerate to roughly 10 meters per second as air from miles around converges to feed the updrafts. Near the end of the towering cumulus stage, the cloud becomes very high and cold, and the top portion of the cloud becomes "glaciated" (composed of ice crystals), causing it to take on a slightly fuzzy or fibrous appearance [41]. The die has been cast and a majestic cumulonimbus cloud is born.
Mature Stage
Not surprisingly, this new phase in the life of an single-cell thunderstorm is the mature stage (see schematic below). Although somewhat arbitrary, the mature stage begins once precipitation reaches the ground. But, the hallmark of the mature stage is the simultaneous presence of an updraft and downdraft within each cell. Downdrafts develop for essentially two reasons: the drag exerted by falling raindrops, and cooling associated with the evaporation of small raindrops (via entrainment). Evaporational cooling increases the density of descending parcels of air, increasing their negative buoyancy and downward acceleration.

When evaporational cooling is operating on all cylinders, it can produce strong downdrafts. To give you an idea of just how strong, if the temperature difference between a sinking air parcel and its environment stays at one degree Celsius during its descent of, say, five kilometers, the downdraft speed can approach 20 meters per second (39 knots; 45 miles per hour). As a general rule, precipitation does not fall straight down into the core of the updraft. Rather, precipitation moves a bit horizontally with upper-level winds before falling air with lower relative humidity, paving the way for evaporational cooling and downward acceleration. When downdrafts "splashdown" at the ground and spread out, they can produce gusty winds. Although single-cell storms don't often produce damaging wind gusts, they can do so on occasion (particularly vigorous single-cell thunderstorms are referred to as "pulse storms").
The splashdown and subsequent spreading out of the downdraft at the ground is akin to water from a kitchen faucet hitting the sink below. Meteorologists refer to the gathering "puddle" of rain-cooled air spreading out along the ground as a "cold pool," which in general tends to be about one to two kilometers deep. After splashdown, the leading edge of this horizontally spreading rain-cooled air is called a gust front or, more formally, an outflow boundary (because it is a boundary between rain-cooled air and the unmodified air mass). You may think of a gust front as a miniature cold front. Gust fronts associated with single-cell thunderstorms can spark other thunderstorms (warm, moist air converging at the gust front is forced to rise), but, most times they don't.
The bottom line here is that the mature stage of a single-cell thunderstorm is exactly what its name suggests--a period when the storm is the most vigorous. Updrafts attain their fastest speeds. Lightning is most frequent. Rain is heaviest. Radar reflectivity is greatest. Cloud tops are highest. When air parcels rise to the top of the troposphere, they quickly become cooler than their surroundings above the tropopause (the stratosphere is stable), which means they become negatively buoyant and slow to a halt. With the tropopause acting like a "lid" in this sense, air parcels spread out horizontally along it to form the glaciated anvil (the flat, spreading top of a cumulonimbus cloud [42]). Single-cell thunderstorms occasionally may also produce small hail in the mature stage (usually not large enough to cause damage), but all of this vigor is fleeting, with a single-cell's mature stage lasting ten minutes or so. The dissipating stage of the cell comes quickly.
Dissipating Stage
The quick end to the mature stage of a single-cell thunderstorm is self inflicted, as the rain that the storm produces ultimately seals its own fate. Indeed, the rain-induced downdraft that splashes down and spreads out laterally inevitably cuts off the inflow of warm, humid air into the storm's updraft. Cut off from a supply of buoyant, maritime-Tropical air, the single cell's updraft weakens. The writing is now on the wall. With the updraft fading and precipitation still sustaining the downdraft (albeit weaker because rainfall rates have also decreased), the downdraft now dominates the single-cell storm, a state which defines the dissipating stage.

The storm's demise is rather quick. Sinking air in the downdraft causes small cloud droplets to evaporate, and once the updraft fades, residual raindrops can "scavenge" cloud droplets as they fall, further eating away at the cumulonimbus cloud. As a result, the once majestic towers that characterized the mature stage of the storm gradually vanish. Indeed, the anvil may become the sole remnant of the single-cell storm.
Summary
The birth, life, and death of a single-cell storm typically takes less than 45 minutes. Once downdrafts become dominant and a storm "rains itself out" as the cold pool grows larger and cuts off the storm from warm, moist air for its updraft, the storm dies. To recap the stages in the life of a single-cell thunderstorm, I created a short video (3:22) highlighting the key characteristics of each stage and their corresponding presentations on idealized radar imagery. Check it out below:
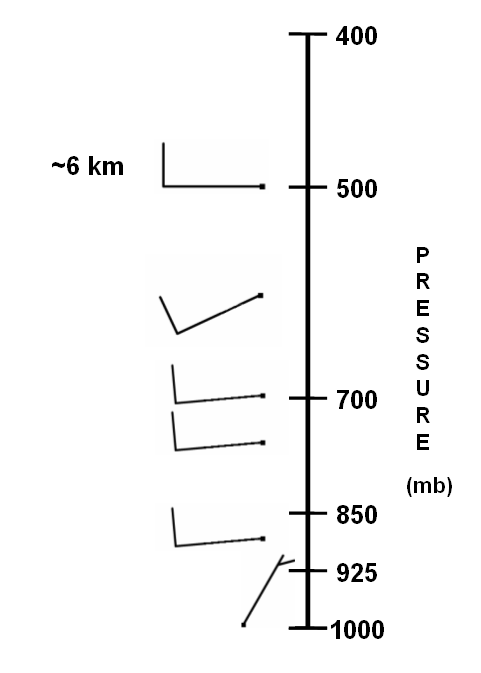
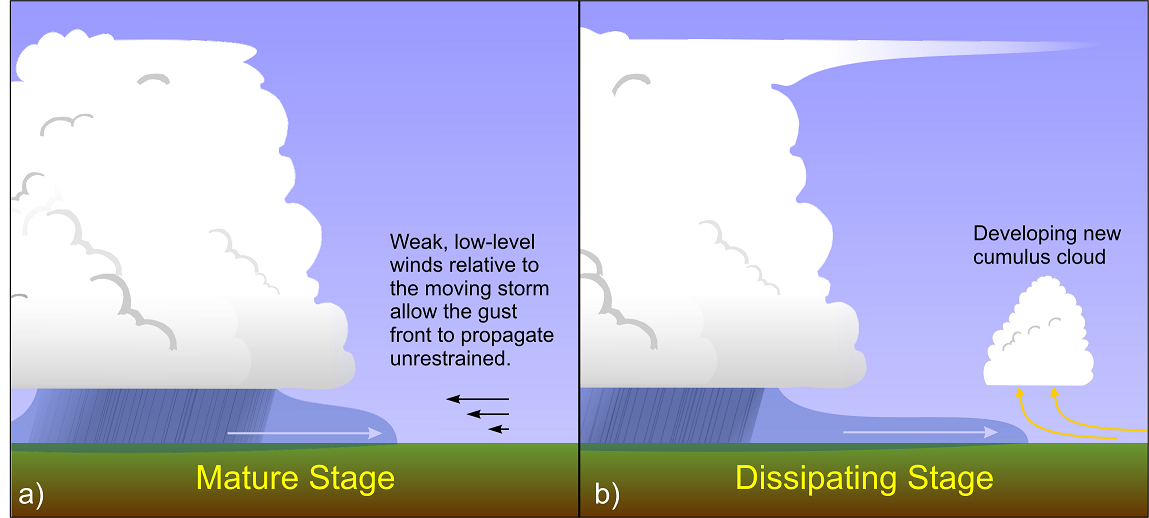
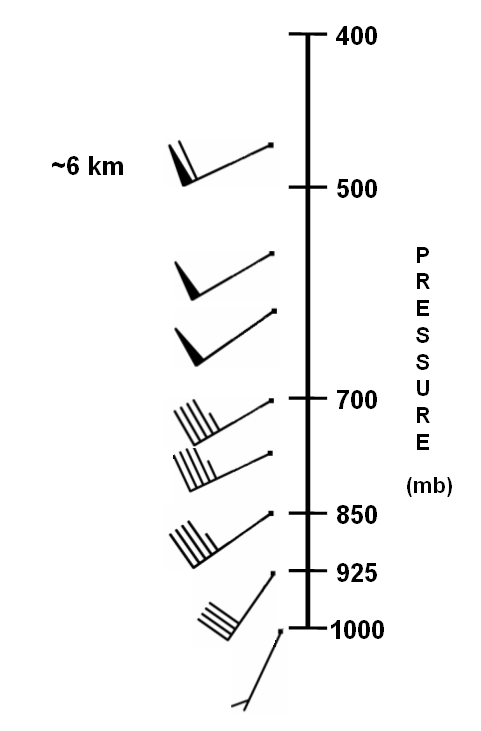
One of the reasons for the fleeting nature of single-cell thunderstorms has to do with the fact that they form in environments with "weak vertical wind shear," meaning that wind speeds and directions change very little with increasing height (here's an example of what a wind profile with weak shear [43] might look like). It's this weak vertical wind shear that allows the storm's downdraft to fall very near the updraft, and allows the storm's gust front to race outward far from the storm [44], because weak low-level winds blowing relative to the moving storm cannot restrain the movement of the dense cold pool. Effectively, new cumulus forming along the gust front hog all the moisture, hastening the storm's demise. What happens when thunderstorms form in environments where vertical wind shear is stronger? In short, thunderstorms don't quite follow the model we studied in this section. We'll explore further beginning in the next section.
Multicell and Supercell Thunderstorms
Prioritize...
Upon completion of this section, you should be able to define multicell and supercell thunderstorms, and contrast their features and characteristics of their environments with those of single-cell thunderstorms.
Read...
You just learned about the life cycle of single-cell thunderstorms, which form in environments with weak vertical wind shear (wind direction and speed changes little with increasing height). As a reminder, here's an example of a vertical wind profile typical of an environment with weak vertical wind shear [43]. Note that the winds are fairly lethargic. The speeds aren't very fast and they don't change much with increasing height. Now contrast that wind profile with a wind profile typical of an environment with strong vertical wind shear [45]. The winds are generally much stronger and their speeds (and in some cases, directions) change substantially with increasing height.
When vertical wind shear is weak, typically the winds blowing relative to a thunderstorm's movement in the lower troposphere are too weak to "restrain" the dense cold pool, allowing the gust front to race away from the storm and ultimately leading to the storm's quick demise. But, as vertical wind shear increases in the atmosphere, conditions become more favorable for thunderstorms to take on different structures and last longer (assuming, of course, that parcels get nudged upward and are positively buoyant in the first place). As vertical wind shear increases, thunderstorms often become "multicells" or "supercells." Let's explore the characteristics of these storm types.
Multicells
If relatively isolated thunderstorms develop when vertical wind shear becomes more "moderate," they tend to become multicells. Multicell thunderstorms are a "group" or "family" of single cells at various stages of their life cycles. The photograph of multicell thunderstorms below, taken on June 12, 2016 in Duck, North Carolina, shows a cluster of cumulus clouds in various stages of development. The annotated image of regional radar reflectivity from 2225Z [46] (not long before this picture was taken) shows these multicell thunderstorms, which drifted southward along the Outer Banks of North Carolina.

Though each single-cell storm that makes up a multicell thunderstorm has a life cycle on the order of 30 to 60 minutes, multicellular convection can last for hours. What gives multicell thunderstorms (as a group) this increased longevity? New cells continually form along a more "restrained" gust front, which lifts warm, moist air flowing into the storm. Ultimately, a cluster of multicell storms gets its start the same way that a single-cell thunderstorm does, and to describe the process of how multicell thunderstorms sustain themselves, I've created a short video (2:26), which assumes that a cluster of multicell thunderstorms is already underway. Check it out!
The real atmosphere sometimes doesn't look as nice and tidy as the idealized schematics I showed in the video, but the bottom line is that, in contrast to single-cell convection, the gust front associated with a multicell thunderstorm repeatedly initiates new cells (often on the storm's southwestern flank). The corresponding cumulus towers associated with new updrafts are separate from their neighbors, and along the gust front, the newest cumulus tower forms the farthest from the oldest cell (which is likely in the dissipating stage of its life cycle). Thus, within a multicell thunderstorm, there is a hierarchy of convective cells at various stages in their life cycles, and a given cumulus tower is taller and farther along in its life cycle than the newer cell immediately adjacent to it. The result is often a "stair-step" appearance along the multicell storm's "flanking line," which is an organized zone of cumulus and towering cumulus clouds extending outward from the mature updraft of multicell storms.
The key to sustaining multicell thunderstorms is the "restrained" gust front initiating new storms, which requires stronger low-level wind flow relative to the movement of the storms compared to what occurs when single-cell thunderstorms form. This stronger inflow goes along with an increase in vertical wind shear, which is what weather forecasters look for to help them try to determine what type(s) of thunderstorms might form. With stronger low-level winds blowing toward the gust front, the dense, rain-cooled outflow encounters more resistance, and cannot advance as far away from the downdraft's splashdown point as in the case of single-cell storms. The end result is that the multicell thunderstorm does not lose access to warm, moist air, setting the stage for convergence along gust fronts to initiate new convection and confirming the idea that multicell storms are self-perpetuating.
To better visualize this self-perpetuating nature of multicellular convection, check out this top-down view of radar reflectivity associated with a classic multicell thunderstorm [47]. Note how the low-level, storm-relative flow "attacks" the gust front head on, maximizing lift and thereby paving the way for the repeated initiation of new convective clouds along the flanking line. Of course, as the cold pool continues to expand with the initiation of new storms, it eventually undercuts the updrafts of older cells, which, in turn, dissipate.
Supercells
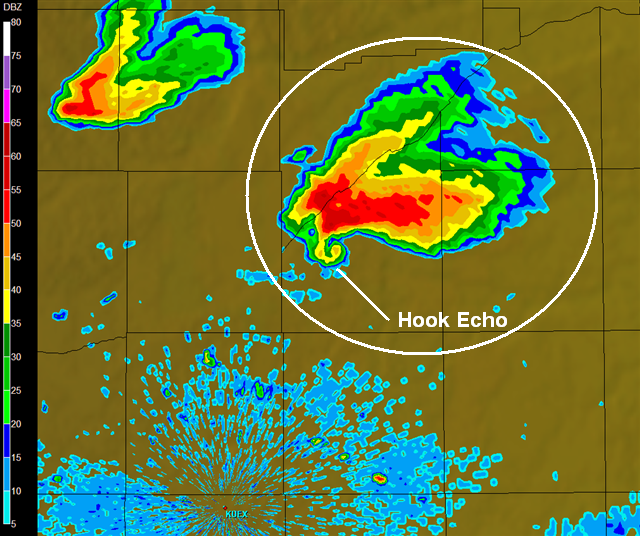
As I just discussed, when vertical wind shear in the atmosphere is moderately strong, multicells tend to form. What about when relatively isolated thunderstorms form in an environment with even stronger vertical wind shear? Allow me to introduce supercell thunderstorms. Supercells are defined by a single rotating updraft that persists for a relatively long period of time. The longevity of supercells is probably one of the traits that earned them the prefix, "super." Indeed, most supercells last for one to four hours, although under certain conditions, they can last longer than that. On radar, discrete supercells sometimes (not always) have a very distinctive appearance (displaying a hook echo [48]).
Supercells can be visually stunning (see photograph below), and when it comes to producing dangerous, destructive weather, supercells are a big deal! As a general rule, nearly all supercells produce large hail or damaging winds. Furthermore, supercells are responsible for nearly all of the strongest tornadoes (rapidly rotating columns of air in contact with the ground that can cause immense damage) and the largest hail (at least two inches in diameter). Beyond tornadoes, large hail, and damaging winds, I also point out that supercells spark frequent lightning, with rates often exceeding 200 flashes per minute, some of the highest rates ever observed. So, there are plenty of good reasons why so many weather enthusiasts find supercells to be alluring.

Before the installation of Doppler radar on a national scale in the late 1980s and early 1990s, meteorologists believed that supercells were rare storms. But, with Doppler radar's ability to detect wind velocities, it became clear that more storms than originally thought have rotating updrafts. So, supercells aren't really rare, but they are certainly a minority of all thunderstorms. Supercells are much more common in some parts of the United States than others (supercells are more common in the Great Plains than they are in Northeast, for example).
The key to the formation of supercells (assuming, of course, that air parcels get a bit of an upward nudge and they can become positively buoyant), is strong vertical wind shear. The changes in wind direction and / or speed with increasing height do two main things that increase a supercell's longevity. First, they assure that the storm's updraft and downdraft remain separate as fast winds aloft carry raindrops, ice crystals, hail, etc., out of the updraft. Secondly, the vertical wind shear's interaction with the storm's updraft helps reduce pressure aloft in the storm, which locally boosts the vertical pressure gradient. The details of how this works are very complex and beyond the scope of the course, but the bottom line is that a stronger vertical pressure gradient boosts the strength of the updraft and helps maintain it.
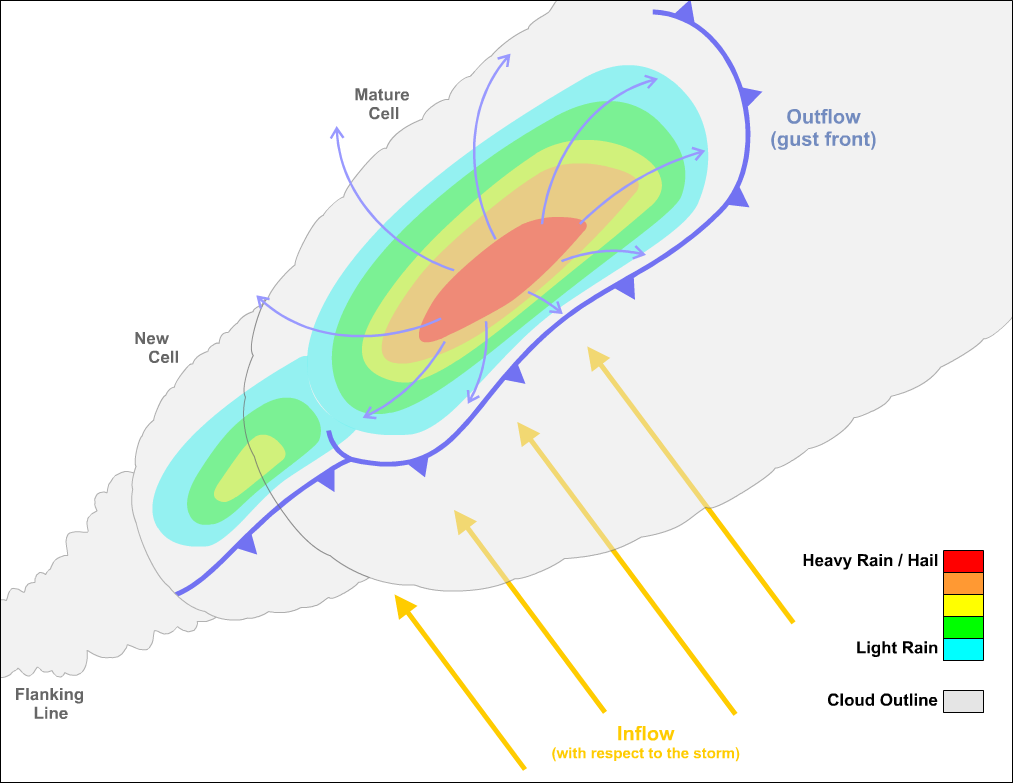
The low pressure aloft that coincides with the supercell's updraft is called a mesocyclone [49], which is the defining characteristic of a supercell (its rotating updraft). Mesocyclones are a few to perhaps 10 kilometers (on order of several miles) wide, and at least half as tall as the depth of the cumulonimbus cloud. As you can tell from the idealized radar reflectivity of a supercell below, the storm's updraft (where the mesocyclone is labeled) is separated from the downdrafts in the storm (where reflectivity is higher and precipitation is falling). On the southwestern flank of the storm, radar echoes appear to wrap around the mesocyclone, forming the "hook echo" that I mentioned earlier (although not all supercells display a discernible hook echo on radar).
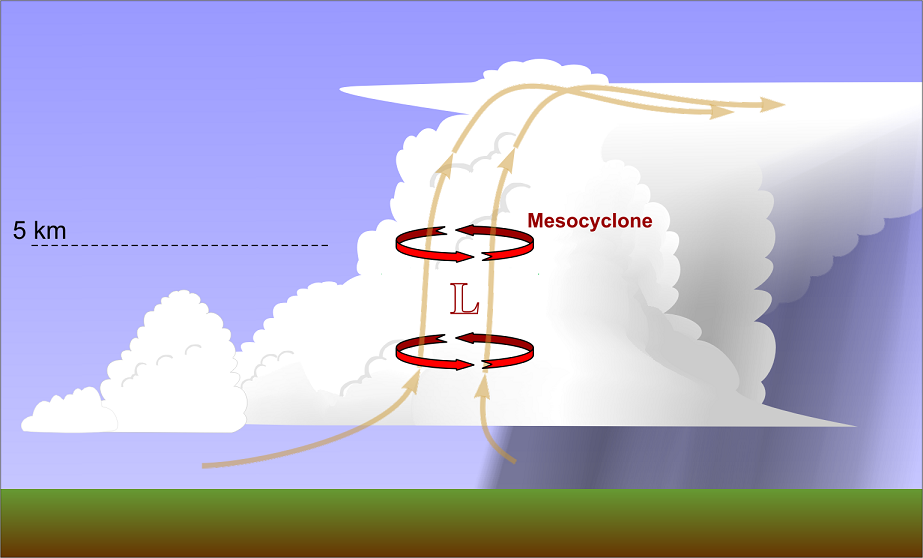
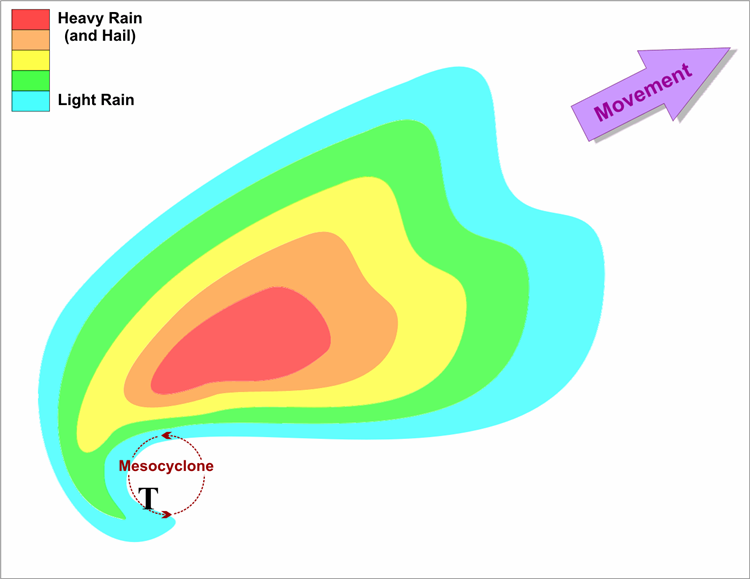
If a supercell spawns a tornado, it would form near the point marked "T" on the idealized radar reflectivity above, but keep in mind that most supercells don't actually spawn tornadoes. I should point out that supercells have gust fronts (and sometimes flanking lines), too, but new thunderstorms typically don't form along them because air tends to sink around the periphery of the supercell.
We'll talk more about supercells in the next lesson as we focus our discussion more on severe weather (since supercells can be such prolific severe weather producers). However, before we focus on severe weather, I want to wrap up the lesson by talking about wintertime convection. While thunderstorms are obviously much more common in the warmer months because of the availability of warm, moist air to make air parcels positively buoyant, convection sometimes occurs in the wintertime, too. The impacts can be quite dramatic, and they don't always involve lightning and thunder. Read on!
Lake-Effect Snow and Snow Squalls
Prioritize...
Upon completion of this section, you should be able to describe two types of cold-season convective precipitation -- lake-effect snow and snow squalls. In particular, you should be able to identify the basic recipe for lake-effect snow, describe the necessary "fetch," and describe the dangers posed by snow squalls.
Read...
Our discussion of convection and thunderstorms so far has focused on thunderstorms, which as you learned, are more common in the warmer months because of the more frequent presence of instability. In other words, warm, moist air parcels that can become positively buoyant are more common. But, instability can be present in the winter, too, even though the lower troposphere isn't all that warm or moist.
So, how does instability develop when it's not warm at the surface? Well, remember that lapse rates are the real driver of instability. Layers that are unstable are marked by temperatures decreasing rapidly with increasing height. Sometimes, a rapid decrease in temperature vertically can be accomplished with very cold air aloft. The cold air aloft makes it more likely that air parcels can be positively buoyant as they rise, even if the conditions at the surface don't seem very "warm" to us. Let's explore a couple of fascinating (and potentially dangerous) weather phenomena that result from convection in the colder months. On occasion, they even come along with thunder and lightning!
Lake-Effect Snow
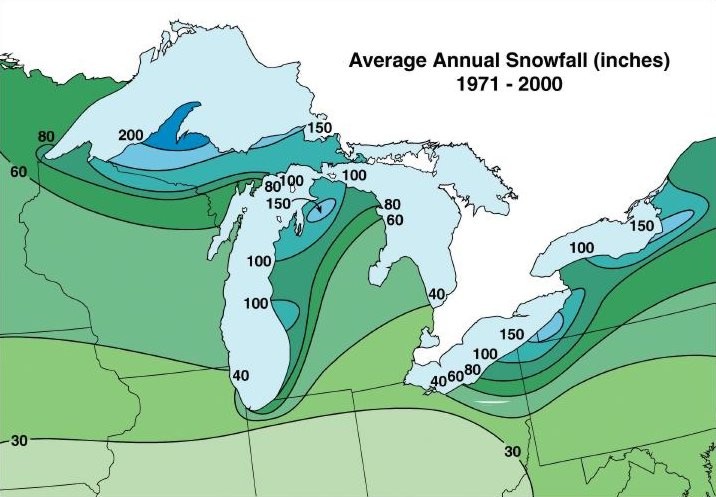
If you live in the vicinity of the Great Lakes in the United States, you probably know about lake-effect snow. In fact, lake-effect snow provides the lion's share of the annual snowfall [50] that occurs downwind of the southern and eastern shores of the Great Lakes. Lake-effect snow dramatically impacts the cold-season climatology in the Great Lakes as some of the traditional snow belts of the Great Lakes receive over four times the mean annual snowfall of neighboring regions that are only a few tens of miles away from the shoreline. The Keweenaw Peninsula [51] (downwind of Lake Superior in northern Michigan) is one particular area that gets hammered by lake-effect snow, for example. Locals measure all seasonal totals against the record 390.4 inches that fell during the winter of 1978-79.
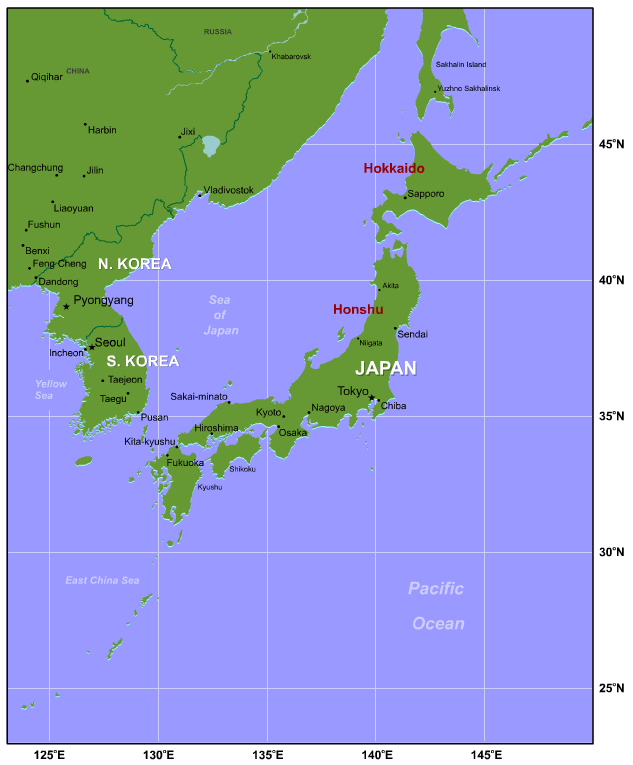
Lest I leave you with the impression that the Great Lakes have the market cornered on lake-effect snows, similar mechanisms can produce snow over other bodies of water, such as Utah's Great Salt Lake and Massachusetts Bay northeast of Cape Cod (technically, ocean-effect snow). In the mid-Atlantic, both Chesapeake Bay and Delaware Bay can produce convective snows, as well. Below is a map of all the bodies of water in North America that can produce lake-effect / ocean-effect snow under the right wind conditions (favorable wind directions denoted by arrows). I further point out that North America does not have a monopoly on lake-effect or ocean-effect snows. For example, the Japanese Islands of Honshu and Hokkaido [52] receive Sea of Japan effect snow when Arctic air masses advance eastward from the mainland of Asia.

So, what causes lake-effect snow? Well, for starters, air temperature is important (cold air is required). More specifically, the difference in temperature between the lake water and the overlying air is critical. As you may recall, large bodies of water have a high heat capacity and tend to be warmer than surrounding land masses from the late fall into the early spring (unless the lake freezes over, of course, which tends to eventually happen to smaller / shallower lakes). Ultimately, cold air flowing over relatively warm lake water is the core of the recipe for lake-effect snow. Specifically, when the air temperature around 5,000 feet is at least 13 degrees Celsius lower (about 23 degrees Fahrenheit lower) than the temperature of the lake surface, the lapse rates are sufficiently large for lake-effect precipitation (meaning that air parcels can become positively buoyant and rise through a deep enough layer to create precipitation-bearing clouds). I should also note that if these are conditions are met, but the atmosphere isn't cold enough for snow, lake-effect rain can occur (which tends to happen earlier in the fall).
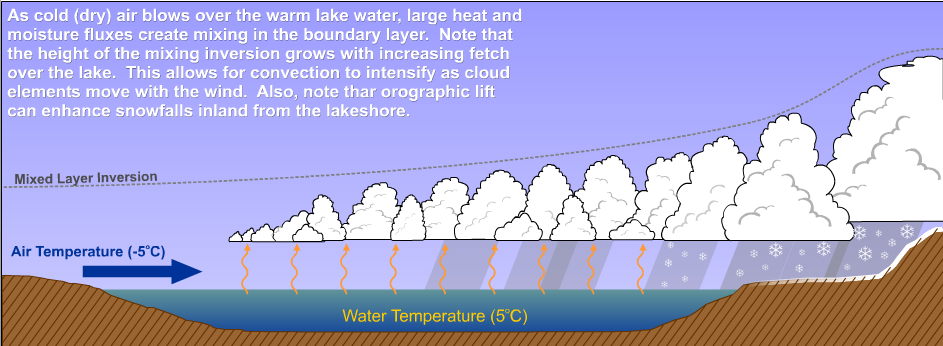
As cold, dry air flows over relatively warm lake waters, warmth and moisture are transferred from the lake to the overlying air, and as air parcels become positively buoyant, convective mixing begins to occur. The longer the "fetch" (the length of water over which the wind blows), the deeper the convective mixing gets, and eventually clouds become tall enough to generate precipitation. If elevated terrain additionally forces air upward as (or after) it comes onshore (orographic lifting), lake-effect snows can become even more impressive. This schematic showing convective clouds growing as air cold air flows over a relatively warm lake [53] should give you a good visual on the process. As a general rule, the fetch must be at least 75 kilometers (slightly less than 50 miles) to allow for enough time for sufficient heat energy and moisture to be transferred into the air above the lake for lake-effect precipitation.
Lake-effect snow tends to form in bands, and for that to happen, vertical wind shear in the lower troposphere must be fairly weak (wind direction, in particular, must not change very much with increasing height). The bands of convective lake-effect clouds can really be stunning on satellite imagery, as shown in the satellite image of lake-effect snow bands on Lakes Superior and Michigan on December 5, 2000 (below). As you might have guessed, the wind flow in the lower troposphere was generally from the northwest, and the "streets" of cumulus clouds followed suit with their northwest to southeast orientation.

When heavy snow bands form and are nearly stationary, the snow totals can be truly jaw dropping. For example, on December 25 and 26, 2017, Erie, Pennsylvania received 60.5 inches of snow, breaking the Pennsylvania state record for snowfall in two days. The culprit was a nearly stationary lake-effect snow band (you can watch the monster snow band take shape on this nine-hour radar loop [54] from the evening and overnight hours of December 25-26). When temperature differences between the water and overlying air are particularly large (especially early in the season in November and early December), the positive buoyancy of air parcels can be strong enough to create updrafts fast enough to electrify the clouds, creating lightning. Indeed, "thundersnow" is more common in the Great Lakes region than in surrounding states because of convective, lake-effect snows.
Another consequence of the banded nature of lake-effect snow is that a distance of only a few miles can mean the difference between getting buried under heavy snow and hardly getting any snow at all, which can create big challenges for weather forecasters! Driving in the vicinity of lake-effect snow bands can also be particularly dangerous because conditions can change very quickly from sunny or partly cloudy skies to near zero visibility and heavy snow. Such rapidly changing conditions are also the hallmark of another more general convective snow phenomenon -- snow squalls.
Snow Squalls
By definition, a snow squall is an intense, short-lived burst of heavy snow that's often accompanied by gusty winds. Snow squalls cause a quick reduction in visibility and often result in a quick accumulation of snow. Lake-effect snow can sometimes qualify as a snow squall, although it's not always short-lived. The most common breeding ground for snow squalls is near strong cold fronts which mark the arrival of Arctic air in the winter. Some complex processes near these fronts, along with strong low-level convergence, can result in strong upward motions, and even though parcels typically aren't strongly positively buoyant, upward velocities can still be sufficient to generate heavy snow and occasionally lightning and thunder.

The combination of a quick burst of moderate or heavy snow and gusty winds can create a life-threatening situation for drivers as visibility can rapidly drop to near zero ("whiteout conditions") and roads become slippery as snow accumulates quickly. Indeed, while big, long-lived snowstorms often take the headlines, they're often not the most deadly in terms of travel accidents. Big, long-duration snowstorms are usually predicted more than a day in advance, allowing people to plan ahead and not travel during the worst conditions. But, the sudden nature of snow squalls often catches travelers off guard, especially on limited-access highways, such as interstates. The end result can be deadly high-speed accidents and multi-car pileups. For a scary example, check out this short video taken on Interstate 94 in Michigan in January 2015 [55], when nearly 200 cars were involved in a pile up (Warning: contains adult language and potentially disturbing images / sounds).
If you watch the video, you'll see how these pileups occur: drivers are going too fast for conditions and simply have no idea what lies ahead of them. Once they realize it, it's too late, and roads are too slippery to stop in time. Highways can be closed for hours (or days) before a massive pileup can be completely cleared away. Given the dangers posed by travel during snow squalls, the National Weather Service is trying to improve public awareness about snow squalls and has created snow-squall related forecast products. This short video (3:29) from January 2018 [56] that Dr. Jon Nese created for Penn State's Weather World [57] television program shows just how common snow-squall related major accidents are and summarizes what the National Weather Service is doing to help alert the public about impending snow squalls.
While snow squalls can happen just about anywhere that wintry weather occurs, the Great Lakes region again tends to be a hotbed for them. If you watched Dr. Nese's video, you saw that there were nine major pileups related to snow squalls on Pennsylvania highways alone in just a six year period. Hopefully, improved warning about snow squalls will reduce the number of snow-squall related accidents. It's always a good idea to stay up on the latest weather forecast to see if snow squalls are possible. If they are, you may want to delay your travel, or if you must travel during times when snow squalls will be around, make sure to reduce your speed, turn on your headlights, and prepare for driving conditions that can change in a matter of seconds. Slamming on your brakes often results in losing control of your vehicle in slick conditions, which increases the odds of multi-vehicle crashes. But, ultimately, there is no safe place on a highway in a snow squall [58], so it's best to get off the highway entirely if possible when they occur.
Snow squalls give a good example of a danger posed by convective weather, but we've just scratched the surface. In the next lesson, we'll focus on a wide variety of dangerous weather caused by convection, with a main focus on severe thunderstorms.