Lesson 9: Severe Weather
Motivate...

Weather affects everyone, every day. Weather affects the clothes you wear, your personal comfort (either directly or through your heating and cooling bills), and the prices of many goods that you buy. Those are just a few big ways that weather can affect you (some of which you may have taken for granted). But, have you really thought about the many ways that weather can affect your very life itself?
We've already discussed a few ways that weather can be dangerous, in terms of winter weather and lightning. But, those certainly aren't the only ways that weather can hurt or kill you (or damage / destroy property). Have you thought about the many other dangers posed by the weather? Sadly, people are hurt or killed by the weather on a daily basis around the world, in most cases because they're caught off guard by some type of severe weather event. It's pretty common to see headlines that say that a dangerous weather event occurred "without warning," but such headlines are often misleading. Weather forecasting has advanced to the point where relatively few dangerous weather events truly hit "without warning" (although unfortunately not everyone receives critical weather warnings in a timely fashion).
That's right: In the vast majority of situations, weather-aware individuals can take steps to keep themselves safe (or at least reduce the risks posed by weather). So, what can you do? Well, for starters, you can stay "in touch" with the weather on a regular basis by having a reliable source of regular weather forecasts and warnings. Furthermore, you can you arm yourself with weather awareness and weather knowledge so that if a dangerous weather situation arises, you can maximize your chances of survival.
In short, this lesson is all about severe weather. We will look at various types of threatening weather like hail, flash flooding, and tornadoes along with the types of conditions and storms that produce these phenomena. Finally, you will learn about weather watches, warnings, and safety tips that you can use to avoid becoming a victim of severe weather. This lesson may be the most important one in the course because it could literally save your life (or the life of a loved one) at some point. Armed with knowledge about severe weather, I believe that you will be more aware of potential severe weather threats and know what to do in order to minimize potential threats to you and your family if severe weather occurs in your area. Let's get started!
Flash Flooding
Prioritize...
When you've completed this section, you should be able to discuss the dangers associated with flash flooding, safety tips, and the general atmospheric conditions in which flash flooding occurs.
Read...
When it comes to thunderstorms, you might immediately think of lightning and thunder. Or, perhaps you think of other storm-related hazards like strong winds or even tornadoes (both of which we'll explore more later in this lesson). But, one "underrated" weather risk (in my opinion) associated with convective storms is flooding. Statistics vary from year to year, but in the 30-year period from 1987 to 2016, more deaths were attributed to flooding [1] in the United States than all other weather hazards (other than heat-related deaths, which are not related to convection or thunderstorms). Furthermore, the 10-year average number of fatalities (from 2007-2016) was slightly higher than the 30-year average, suggesting that deaths from flooding are a problem that isn't improving (unlike lightning deaths, as you may recall).
All floods are not created equal, however. Some floods result when rivers or other bodies of water slowly rise out of their banks. These types of floods are usually well predicted at least a day or two in advance (sometimes longer) and may last for days or even weeks before water levels decline and return to their normal confines. On the other end of the spectrum is what we'll focus on in this section -- flash floods. Of course, the operative word in "flash flood" is flash because these floods typically develop suddenly (with little advance warning) over a local area. Flash floods usually come and go within a matter of hours. The flash flood in the images below, which occurred in Maricopa County, Arizona, on October 13, 2003, was at its peak at 10:30 A.M. Only two and a half hours later, the offending "wash" had all but emptied (for the record, a wash is a natural channel for run-off in an dry climate).

The dangers associated with flash flooding boil down to two things: First, flash floods occur with little advance notice, so people don't have much time to prepare or seek higher or drier ground. Secondly, moving water carries a lot of force! Indeed, most people underestimate the power of moving water. Just six inches of rushing water can potentially knock an adult off his or her feet. The immense force of moving water is the reason why statistics show that more than half of all flood-related deaths occur in vehicles, when people drive their cars into floodwaters.
"Turn Around! Don't Drown!"
Given the prevalence of flood-related deaths in vehicles, the National Weather Service has adopted the phrase, "Turn around! Don't Drown!" to raise awareness of the dangers of driving vehicles into floodwaters. Trouble begins when people assume they know how deep the water across the roadway is, and they assume that they'll be able to drive through it. But, just 12 inches of water (not even enough to cover the tires) is enough to float smaller vehicles, and 18 to 24 inches of water can float larger vehicles like SUVs and vans. If the water is moving rapidly, vehicles easily get swept away like small toys [2].
The fact that so little water can cause a vehicle to be swept away may surprise you. The physics of how seemingly little water can sweep away something as large as an automobile involves buoyancy, and you may find this short video (3:47) explaining the forces that water imposes on a vehicle [3] to be fascinating. You should NEVER attempt to drive through a flooded roadway. Even if you think you're familiar with the area and that the water isn't deep, you don't know the condition of the road beneath the water [4]. Don't be like the person in the "Turn Around! Don't Drown!" public-service announcement below!
You're running late and your path is blocked by water crossing the road. It doesn't look that deep, so you decide to drive through it. Bad decision. And, it may be your last.
Ultimately, the biggest step you can take to avoid becoming a victim of a flash flood is to respect the power of moving water. Do not drive through or walk into flood waters (walking in or near flood waters is the second leading cause of flood-related deaths). Take extra caution at night, when it's often not easy to see areas of standing water. Of course, staying in tune with the latest weather forecasts can go a long way in preparing you for the possibility of flash flooding, even though a flash flood itself may come on suddenly. Now let's examine the atmospheric conditions that can lead to flash floods.
The Meteorology of Flash Floods
Predicting flash floods comes with two main challenges: Not only must forecasters recognize patterns favorable for heavy rain, they must also weigh "hydrological factors," which are characteristics that relate to the "behavior" of precipitation (and existing water) at or below the Earth's surface. Indeed, the potential of a given rainfall to produce flash flooding depends on preceding precipitation (recent heavy rains may have already saturated the ground, for example), the size and topography of the drainage basin, and the degree of urbanization within the basin (which can lead to faster runoff). There can be other extenuating circumstances, of course, ranging from catastrophic dam failures to ice jams on rivers to autumn leaves clogging urban drains.
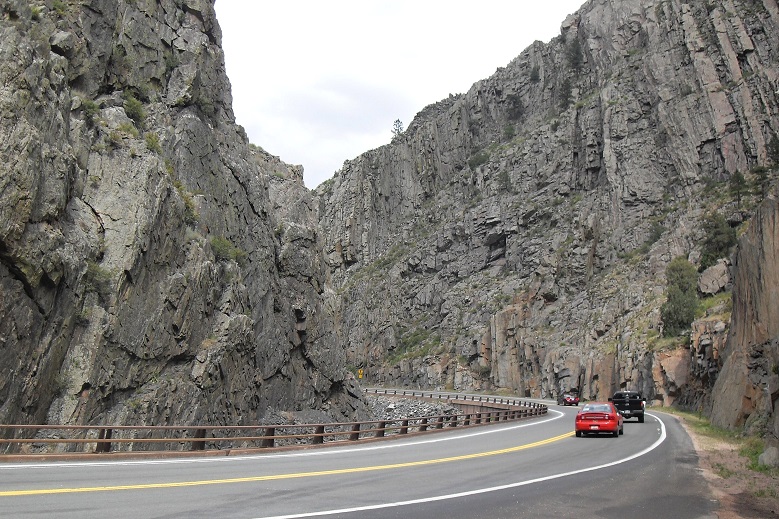
Meteorology and hydrology conspired to create one of the worst flash floods in U.S. history -- the Big Thompson Canyon Flood in Colorado during the early evening of July 31, 1976. In a matter of a few hours, flash flooding killed 145 people and destroyed 418 houses and 152 businesses. The estimated cost of the damage was more than $40 million.

The tragedy unfolded as a line of strong thunderstorms (see photograph on the right) erupted over the foothills of the Colorado Rockies. The storms remained nearly stationary for three to four hours, inundating an area of 70 square miles in the central portion of the Big Thompson River drainage basin with as much as a foot of rain. A foot of rain in just a few hours would cause flash flooding practically anywhere, but persistent downpours in the Big Thompson Canyon were simply a recipe for unmitigated disaster. Sheer rock, which juts upward at very steep angles [5], forms the walls of the canyon. Obviously, there's not much soil and vegetation to absorb some of the runoff.
The weather patterns that can produce flash flooding can vary, but they often involve thunderstorms that develop either with weak winds aloft or with winds that blow parallel to a line of thunderstorms. Weak winds aloft cause thunderstorms to move slowly (or remain stationary), which can focus heavy rain over a small area. On the other hand, when winds aloft blow parallel to a line of thunderstorms, individual thunderstorms can follow each other and pass over the same location, like train cars traveling along a train track. Such situations are called training, and can be prolific flash flood producers as recurrent heavy rain falls over the same areas. To see what I mean by training thunderstorms, check out this radar loop from 00Z to 06Z on May 27, 2007 [6] and focus on the north-south oriented line of thunderstorms near the center of the image. The individual cells were following each other along a south to north path through northern Texas into Oklahoma, dropping very heavy rain (two to three inches per hour), which spawned flash flooding.
In addition to weak winds in the middle and upper troposphere, forecasters also look for weak vertical wind shear because when stronger vertical wind shear tends to increase the entrainment of dry air into cumulonimbus clouds, which reduces the "precipitation efficiency" of the storms (in other words, the cloud produces less rain than it otherwise would). Weak vertical wind shear reduces dry entrainment and allows cumulonimbus clouds to produce rain more efficiently.
Forecasters also look for high dew points because they suggest high amounts of water vapor in the lower troposphere. Of course, moisture near the surface isn't the only important factor, so forecasters also use other metrics to assess moisture through the depth of the troposphere to gauge just how "juicy" an air mass is compared to average for a given location and date. When the amount of moisture in an air column is much higher than average, the risk of flash flooding increases.
Finally, forecasters look for a stationary (or nearly stationary) mechanism to promote rising air. This could be anything from a slow-moving front (a source of lifting) to a mountain range. In particular, forecasters are on the lookout for situations in which a narrow ribbon of fast, low-level winds (often called a "low-level jet stream" or "low-level jet") interacts with a slow-moving front or is forced to rise up elevated terrain (orographic lifting). Such low-level jet streams can continue to supply moist air for hours at a time, and when that moist air is forced to rise over a front [7] or up a mountain slope, the stage can be set for prolonged heavy rain.
While forecasters can often identify weather patterns that may favor flash flooding in a particular region a few days in advance, pinpointing the details of exactly when and where the flooding might occur is difficult more than perhaps a few hours ahead of time. So, stay alert when the possibility of heavy rain is in the forecast!
Up next, we'll start looking at other damaging aspects of thunderstorms, and we'll begin with hail. Read on!
Hail
Prioritize...
After you've finished this section, you should be able to define hail and describe the process by which hail forms. You should also be able to define graupel, severe hail, and precipitation loading.
Read...
Hail is another thunderstorm hazard that I would consider "underrated." It doesn't tend to make national headlines the way some other weather hazards do, but it's no less damaging. For starters, though, what exactly is hail? Hail is precipitation in the form of balls or chunks of ice produced by convective clouds. Hail is actually the most costly thunderstorm hazard in the United States each year, causing more than a billion dollars per year in damage to vehicles alone! This local news story from 2014 (2:36) [8] about hail damage to 4,300 cars at a dealership in Nebraska demonstrates how the damage to automobiles can be so immense.
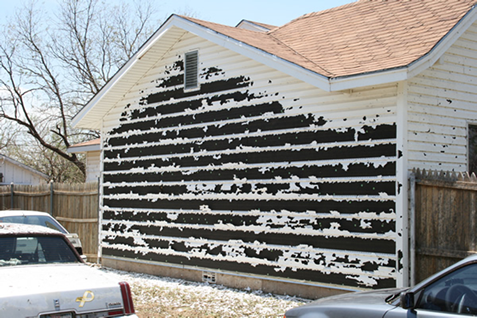
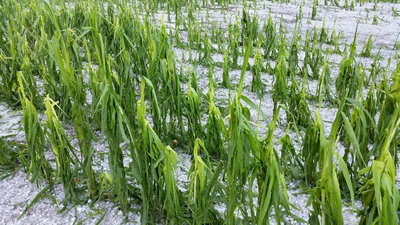
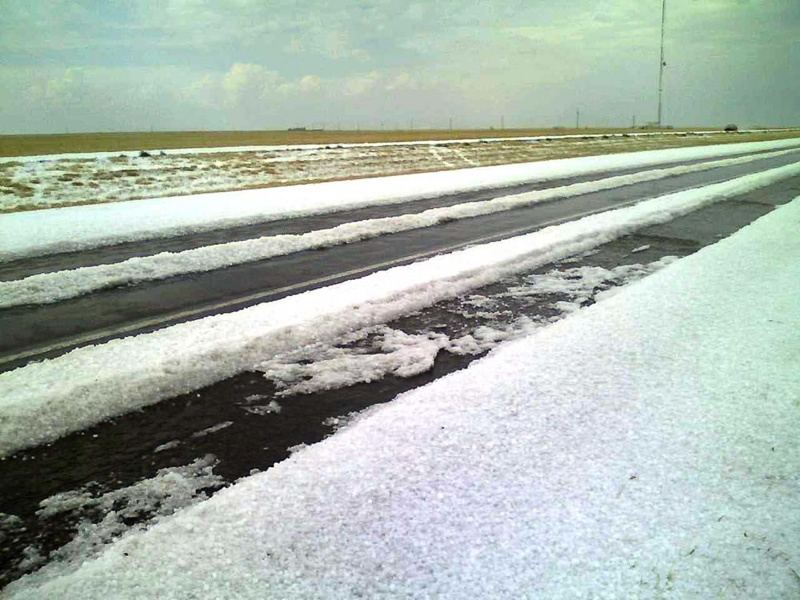
Of course, hail doesn't just damage automobiles. To give you a feel for how hail can brutalize the landscape, check out this amazing video of hail pummeling a backyard in Phoenix, Arizona in 2010 (1:29) [9]. After watching the video, perhaps you can see why wind-blown hail can rip the siding right off a building [10] (credit: National Weather Service, Lubbock, Texas) or severely damage crops [11] (credit: National Weather Service, Hastings Nebraska). Note how in the photo of crop damage, hail accumulation somewhat resembles the wake of a snowstorm! Believe it or not, snow plows have been deployed to clean up after significant accumulations of hail [12] (credit: National Severe Storms Laboratory)!
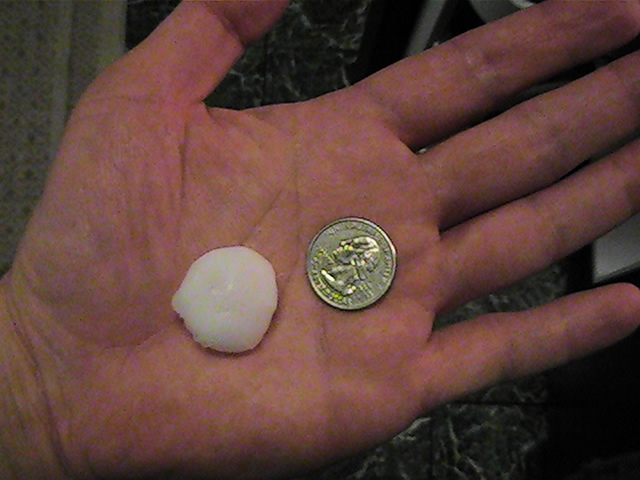
Just about any type of thunderstorm (single cell, multicell, or supercell) can generate hail under the right conditions, but some areas of the United States are more prone to hail than others. The map below shows the average number of severe hail days per year (the average number of days per year with severe hail within 25 miles of a point) from 2003 to 2012. Severe hail is defined as having at least a one-inch diameter (about the size of a quarter [13]; credit: National Weather Service) because research has shown that most damage occurs once hail diameter reaches at least one inch. The map clearly shows that severe hail is much more common from the Rocky Mountains eastward, with the biggest hail "hot spots" being along the Front Range of the Rockies in Colorado and Wyoming and in the central and southern Plains (Oklahoma, Kansas, Missouri, Nebraska, and South Dakota in particular). Hail is also fairly common along the interior of the southeastern U.S. (more than six days per year with one-inch diameter hail).

So, why do some thunderstorms produce hail, while others don't? To answer that question, let's explore how hail forms. For starters, hail formation requires a thunderstorm updraft that's strong enough to prevent growing ice particles from falling for a time. Hailstones actually have a humble and meager beginning, with their roots tracing back to small ice crystals swept up in the main updraft of the storm. Remember that high up within cumulonimbus clouds, the cloud is actually composed of some ice crystals, but also many supercooled water drops (water in liquid form that is less than 32 degrees Fahrenheit). After a relatively short period of time (on the order of ten minutes), ice crystals grow to the point that they have sufficient mass causing them to settle with respect to the lighter cloud drops.
At this point, growth quickens as ice crystals "collect" supercooled cloud drops and raindrops, which freeze on contact (a collection process called "accretion"), forming graupel [14]. The formation of graupel paves the way for rapid growth as these heavier snow pellets sweep out more and more supercooled droplets (frozen raindrops can also serve as hail embryo). As the rate of growth accelerates, supercooled drops may not freeze immediately after contact. Instead, they spread over the hailstone like a film, filling in gaps between places where supercooled drops previously froze, which increases the density of the hailstones.
In general, updraft speeds of at least 10 to 15 meters per second (more than 20 miles per hour) are required for hailstones to develop. Hailstones grow largest when their fall speeds match the velocity of the updraft in regions where there's a large supply of liquid drops in the cloud. In such a scenario, suspended hailstones eagerly gobble up supercooled drops, achieving diameters as large as four inches (about the size of a softball) when updraft speeds are very strong (50 meters per second or faster). So, strong updrafts are required in order to suspend large volumes of hail and liquid drops high in a thunderstorm, a process which is called precipitation loading. Hailstones have very high radar reflectivity, and meteorologists can spot the signs of precipitation loading using cross-sections of radar reflectivity by locating areas of very high reflectivity aloft in a thunderstorm [15] (altitude in thousands of feet is marked along the left of the image).
As hailstones suspended by strong updrafts get larger, they develop onion-like patterns of ice as they get tossed about by the turbulent updraft (see the cross-section of the hailstone below). Layers alternate between clear, hard ice that forms in environments with lots of liquid water drops (water spreads across the hailstone before freezing) and softer, milky ice that forms in environments with fewer liquid drops available (water freezes on contact, trapping tiny air bubbles in the process). I also note that hailstones are generally spherical or oblong, but hailstones can also clump together, resulting in a spiky appearance.

When thunderstorm updraft speeds get pretty fast (greater than 35 meters per second) and hailstones are still fairly small, some hailstones can get ejected from the updraft, depriving them of further meaningful growth (because they're no longer suspended in the updraft). Hailstones suspended in the updraft, however, continue to grow as the "rejects" (hailstones tossed out of the updraft) start falling toward the ground, which contributes to a variation in the sizes of hailstones that we observe at the ground. The sizes of hailstones that we eventually observe at the earth's surface (or whether hailstones survive to the surface at all) also depends on the altitude of the melting level. As hailstones fall toward the ground, eventually their environment becomes warm enough that they start melting, and it becomes a race to see whether the hailstones can survive to the ground before entirely melting into liquid.
So, thunderstorms that produce hail require strong updrafts, and typically, strong updrafts require very warm, buoyant air near the ground. But, the warm air in the lower troposphere can't be too warm, or extend up too high, or else hailstones will melt completely before hitting the ground. A complicating factor is that, as hail tumbles to the ground, evaporation of nearby raindrops occurs, which cools the air (evaporational cooling) and slows the melting process somewhat. So, meteorologists have to account for evaporational cooling, too, as they try to determine whether it's likely that hail will be able to survive to the ground before melting. The details of hail forecasting can be tricky indeed!
With regard to forecasting specific sizes of hail (say, 2.5 inches in diameter versus 3.5 inches, for example), I won't beat around the bush. In a nutshell, forecasting specific hail size is practically Mission Impossible because of the complex processes and updraft interaction that hail size depends on (processes which we can't regularly observe, for all practical purposes). Recently, some new methods have been developed to predict hail size based on a comparison of existing environmental conditions to historic severe hail cases, but the predictions take the form of a "best guess" for maximum possible hail size (sort of a "reasonable worst case scenario" for what a storm might produce).
Still, meteorologists are usually able to recognize the atmospheric conditions which may favor severe hail. Meteorologists look for environments that favor strong thunderstorm updrafts and have relatively thin "warm" layers extending up from the surface to limit melting. If the melting layer extends any more than about 11,000 feet above the ground, typically hailstones can't survive their descent to the surface. Analyzing these factors helps meteorologists alert the public to the risk of large hail with certain thunderstorms, even if we can't reliably pinpoint exactly how large hail might be. Hail prediction is pretty complex, and is certainly an active area of current research!
In weather reports, hail size is usually compared to common objects to give the public an idea of just how big hailstones are (see the chart below). So, that's why you may hear meteorologists refer to "golf-ball sized hail" (1.75 inches in diameter) or "softball-sized hail" (four inches in diameter), for example. Hail greater than two inches occurs almost exclusively in supercell thunderstorms, as you may recall, and on rare occasions, supercells can produce gigantic hail. The largest hailstone on record in the U.S. occurred with a supercell in Vivian, South Dakota [16] on July 23, 2010, measuring a diameter of a whopping eight inches [17] (credit: National Weather Service), which is about the size of a volleyball. That'll leave a mark!

In case you're wondering, hail storms can be deadly, although death-by-hail is relatively rare (averaging less than one death per year in the United States). The deadliest hailstorm in modern times likely occurred in India in 1888 (246 people were killed). Needless to say, you don't want to be outside when hailstones plummet to the ground!
Now that we've covered "precipitation" hazards associated with thunderstorms (flash flooding and hail), we'll turn our attention to a hazard that is somewhat related to precipitation. As precipitation falls to the ground in the downdraft of a thunderstorm, sometimes the downdraft can become quite strong and pave the way for damaging winds. We'll explore that in the next section!
Downbursts
Prioritize...
Upon completion of this section, you should be able to describe downbursts (including the difference between a microburst and a macroburst), and how precipitation loading and evaporational cooling can lead to their development. You should also be able to describe why downbursts are a hazard, and in particular explain why microbursts are a threat to aviation.
Read...
In the not-too-distant past, airline passengers faced a mysterious menace in the sky. This menace was responsible for at least five fatal airline crashes in the 1970s, and several more in the 1980s. The mysterious menace? Downbursts -- a strong downdraft of air that causes an outflow of damaging, straight-line winds at or just above the ground. Remember that all thunderstorms have downdrafts [18], which cause cool air to rush out from the "splashdown" point, but sometimes downdrafts can become very strong, which leads to an outflow of damaging winds at the surface that characterizes downbursts (winds can exceed 100 miles per hour). This raw video from WFAA TV [19], showing the aftermath of the crash of Delta Airlines flight 191 on August 2, 1985 on approach to Dallas-Fort Worth Airport, is a testament to just how devastating the impacts of downbursts can be for aircraft.
I'll return to the risks posed by downbursts to aviation later, but for now, let's cover a little more about what downbursts are and what causes them. For starters, downbursts are separated into two categories:
- Microbursts: small downbursts, with a horizontal scale of damaging winds less than four kilometers (about 2.5 miles)
- Macrobursts: larger downbursts with a horizontal scale of damaging winds greater than four kilometers (about 2.5 miles)

Regardless of size, downbursts can really pack a punch! For evidence, look no further than the photograph on the right, showing the damage done by a microburst to the radome of the NEXRAD at Del Rio, Texas on May 26, 2001. Around 06Z, outflow from a downdraft of a supercell scored a direct hit on the radome and crushed it.
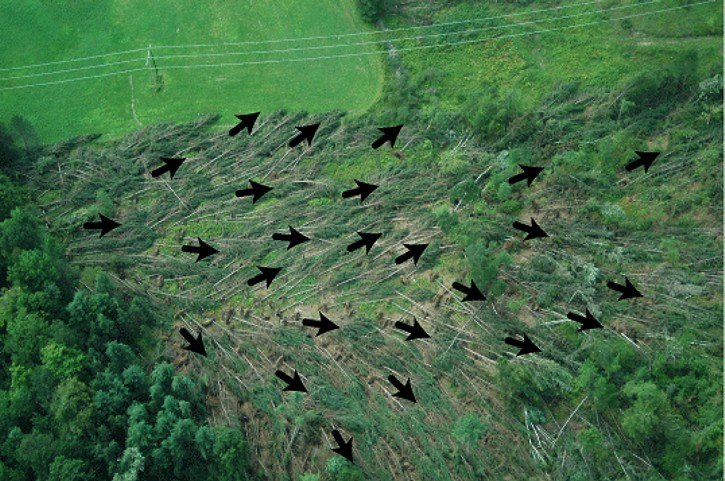
Prior to the 1970s, nobody really knew what downbursts were, and many cases of thunderstorm wind damage that were actually caused by downbursts were just assumed to be from tornadoes. But, during an aerial survey of damage in the aftermath of a “super-outbreak” of 148 tornadoes on April 3-4, 1974 [20] Dr. Ted Fujita (who also devised the damage rating scale for tornadoes, which we'll study later in the lesson) noticed a "strange pattern" of tree damage in some places. Unlike damage inflicted to forests by tornadoes (which usually displays evidence of circulation or rotation), there were splotches of damage where hundreds of fallen trees lay in a divergent starburst pattern [21].
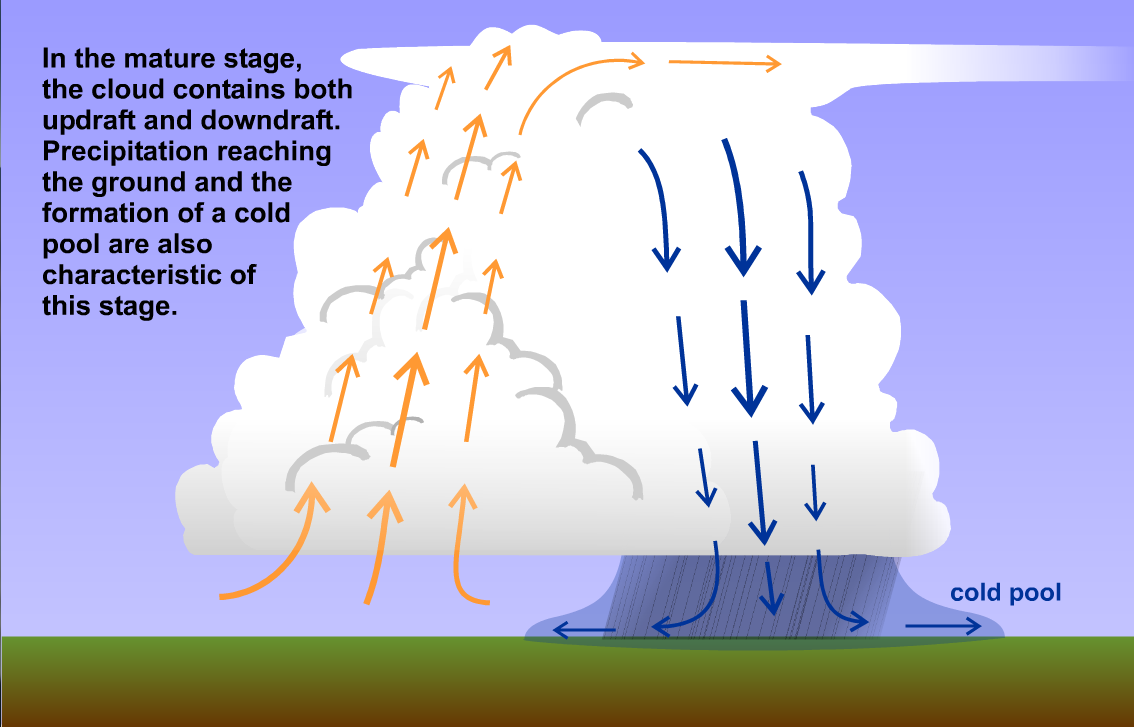
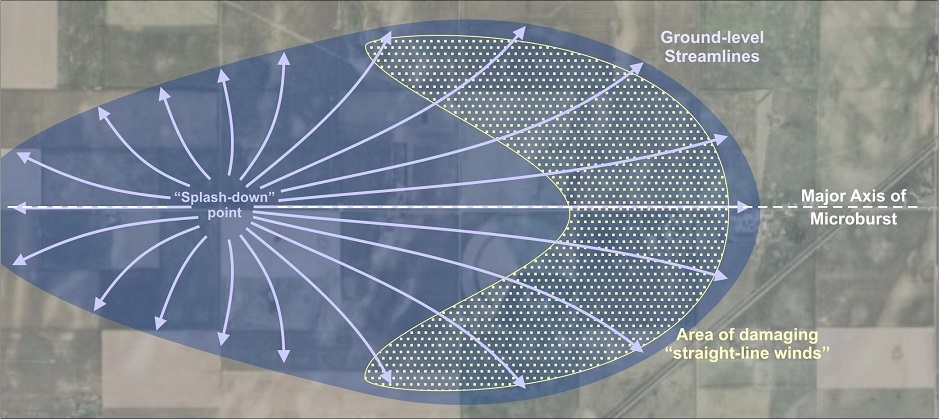
To the public, tornadoes were clearly the culprits, but Dr. Fujita visualized a downdraft "jet" that "hard-landed" at the center of the starburst pattern of damaging straight-line winds, much like water from a kitchen faucet rushes outward after hitting the sink below. Fujita's original concept was largely consistent with the accepted model downbursts that we use today (depicted in the image below, which shows two perspectives of the air flow associated with a downburst). The top part of the image below shows a cross-section view (from the side), showing the downdraft splashdown and damaging winds rushing out behind the leading edge of the cold pool. The bottom part of the image shows a top-down view of downdraft's splashdown point and "streamlines" (arrows tracing the air's movement) spreading out. The area of damaging winds essentially lies just behind the cold pool's outflow boundary (gust front).

The following year, while investigating the fatal crash of Eastern Airlines Flight 66 at JFK Airport on June 24, 1975, Professor Fujita coined the term, "downburst," a "wind system" strong enough to bring down a jet aircraft but small enough to go undetected by our network of surface weather observations. In the following years, Dr. Fujita's research helped make the distinction between macrobursts and microbursts. The most intense downbursts can produce winds that exceed 60 meters per second (approximately 134 miles an hour). Indeed, downbursts are responsible for the record wind gusts at many inland cities or towns. At State College, Pennsylvania, for example, the all-time record wind gust is 95 miles an hour from a downburst on July 23, 1991. Such wind gusts can easily down trees, damage buildings, and pose tremendous danger to aircraft landing (or parked) at airports.
So, what exactly causes downbursts? We're going to focus on two main culprits -- precipitation loading and evaporational cooling. As a reminder, precipitation loading is the suspension of hail, raindrops, graupel, snow crystals, etc., by updrafts in thunderstorms. Basically, precipitation loading is a real "drag." The increasing weight of graupel, hail, and liquid water may trigger or enhance a downdraft simply by dragging down the air as it descends. As a result, precipitation loading can be a mechanism that generates strong downdrafts once the weighty bundle of precipitation particles abruptly plummets to earth (and drags air down with it).
In light of this observation, it stands to reason that forecasters can use cross sections of radar reflectivity to identify short-term potential for downbursts (particularly microbursts). To see what I mean, check out this loop of radar cross-sections from the radar at Salt Lake City, Utah radar [22] spanning from 2226Z to 2250Z on July 10, 1997. Distance in nautical miles is labeled along the bottom of the cross-section, while altitude in thousands of feet is labeled along the left side. The cross-section indicates that a storm formed about 20-25 nautical miles from Salt Lake City (initially there's a small core of 29 dBZ reflectivity above 14,000 feet), and as precipitation loading continued, the core reflectivity increased to 34 dBZ and descended to the ground. The anemometer at the Salt Lake City Airport measured a gust of 49 knots (57 miles per hour), but stronger wind gusts likely occurred closer to the splashdown point (especially within four kilometers).
Essentially, you can think of a downburst as having three distinct stages (depicted in the image below). First is the "contact stage," when the downdraft initially makes contact with the ground. Next comes the "outburst stage", when wind rushes out from the splashdown point, potentially causing damage. Finally, comes the "cushion stage," when the cold pool at the ground acts as a "cushion" of sorts: The cold pool becomes thick enough and cold (dense) enough that the downdraft can no-longer penetrate to the surface because air parcels in the downdraft become warmer than their surroundings near the ground, making them positively buoyant and halting their downward acceleration.

If you watch this time lapse of a microburst [23], you should be able to liken it to the classic model above. You can see a large bundle of precipitation accelerating downward in the downdraft and really get the sense of air rushing outward after the downdraft splashes down at the ground. Storms can produce multiple downbursts during their lives, and this storm time-lapse over Columbus, Ohio [24] from August 28, 2016 is a great example. If you watch carefully, you can see a few bundles of precipitation dropping toward the ground, including a really dramatic one that starts around 25 seconds in (it's a pretty awesome time lapse, which even includes a bonus rainbow!). Watching these videos also gives you a sense for why some refer to microbursts as "rain bombs," although that's not a scientific term.
Evaporational cooling contributes to downdraft speeds as well, because it increases the density of air parcels (increasing negative buoyancy) and aiding their downward acceleration. While most microbursts are "wet microbursts," (meaning that heavy rain is observed when the microburst occurs, despite some evaporation along the way), occasionally "dry microbursts" can occur, too, in which little, if any rain reaches the ground. In a dry microburst, very low relative humidity beneath the cumulonimbus cloud favors net evaporation of raindrops and prime conditions for evaporational cooling, which causes large negative buoyancy and downward acceleration. Most, if not all, raindrops don't survive to the ground before evaporating in a dry microburst. I should also add that melting of ice particles also contributes to negative buoyancy (melting requires energy, and is a cooling process much like evaporation), and may pay a particularly important role in the development of negative buoyancy in downdrafts associated with wet microbursts.
In addition to the threat posed by downbursts to people and property, microbursts in particular pose a huge threat to airplanes taking off or landing. The threat comes from a rapid change in wind direction (horizontal wind shear) experienced by the aircraft (for a visual, imagine a plane flying from right to left through this idealized microburst [25] while trying to land). When flying through a microburst, an airplane experiences strong headwinds, which causes the airplane to gain lift as more air moves past the wings. This added lift causes pilots to point the nose of the aircraft down, but then suddenly the headwind changes to a tailwind after the aircraft passes the downdraft's splashdown point. With strong tailwinds moving along with the aircraft, less air moves over the wings, greatly reducing lift. The aircraft quickly loses altitude and pilots simply can't adjust fast enough, resulting in tragedies like the 1985 crash of Delta Flight 191 mentioned above.
Fortunately, years of research have led to the installation of systems to detect wind shear from downbursts at most major airports. The advent of Doppler radar made such systems possible, given that it can detect air movement, and with modern detection systems in place and better pilot training, air travel is now much safer than it was just a few decades ago. Downburst-related airline incidents have declined sharply (including a 20+ year stretch without any in the U.S.) -- a clear success of the application of meteorological science.
While the field of aviation is much better at anticipating and avoiding microbursts, they can still take the public by surprise. What steps does the National Weather Service take to advise the public of such risks posed by impending thunderstorms? We'll explore that in the next section. Read on!
Severe Weather Watches and Warnings
Prioritize...
After you've completed this section, you should be able to describe the conditions under which a thunderstorm would be considered "severe," and be able to interpret the meaning of a severe thunderstorm watch, severe thunderstorm warning, tornado watch, and tornado warning.
Read...
All thunderstorms can be dangerous because they produce lightning. But, some thunderstorms pack more of a punch than others, bringing a variety of serious weather hazards. In order to help the public prepare for the risks associated with thunderstorms, the National Weather Service formally classifies a storm as "severe" if it produces at least one of the following:
- a tornado (a rapidly rotating column of air in contact with the ground and a cloud above)
- hail at least one inch in diameter (the size of a quarter)
- straight-line winds of at least 50 knots (58 miles per hour)
Why were these particular criteria chosen? Well, chances are, if a thunderstorm produces at least one of the above, it's more likely to damage property and / or endanger lives. Note that the formal definition of a severe thunderstorm doesn't cover all thunderstorm hazards; it says nothing about lightning or flash flooding (although some other nations do, indeed, include flash flooding in their definition of severe thunderstorms). So, just because a thunderstorm doesn't meet the official definition of "severe" doesn't mean it can't produce damage or endanger lives.
Still, formally classifying thunderstorms as severe helps forecasters alert the public on days when the risks from thunderstorms are heightened. In the United States, a branch of the National Weather Service called the Storm Prediction Center (SPC), headquartered in Norman, Oklahoma is responsible for monitoring conditions that could favor severe thunderstorms anywhere in the country.
If SPC identifies an area with favorable conditions for an organized outbreak of severe thunderstorms, they will choose to issue either a severe thunderstorm watch or a tornado watch for that region. What do these watches mean?
- A severe thunderstorm watch means that severe thunderstorms are possible and that you should be prepared.
- A tornado watch means that severe thunderstorms with multiple tornadoes or particularly strong tornadoes (in addition to other severe weather threats) are possible and that you should be prepared.
Severe thunderstorm and tornado watches are fairly large, typically covering tens of thousands of square miles (roughly the size of a state or perhaps parts of several states), and are in effect for several hours (perhaps as many as six to eight hours), but watches can be canceled, re-issued, or modified as conditions dictate. I like to think of severe thunderstorm and tornado watches as an initial "heads up" of sorts, aiming to get the public's attention that there might be severe weather (damaging straight-line winds, large hail, or tornadoes) in the coming hours, so that they can stay alert and be prepared.
To see an example of a tornado watch, check out the image below showing Tornado Watch #511, issued by SPC on November 5, 2017 at 12:10 PM EST, in effect until 7 PM EST (nearly seven hours). Watch areas, like this one, typically resemble large parallelograms, but are really issued by county. All of the counties shaded in red were part of the tornado watch, which highlighted a swath covering parts of Indiana and Ohio, including cities like Indianapolis, Dayton, Toledo, and Cleveland.

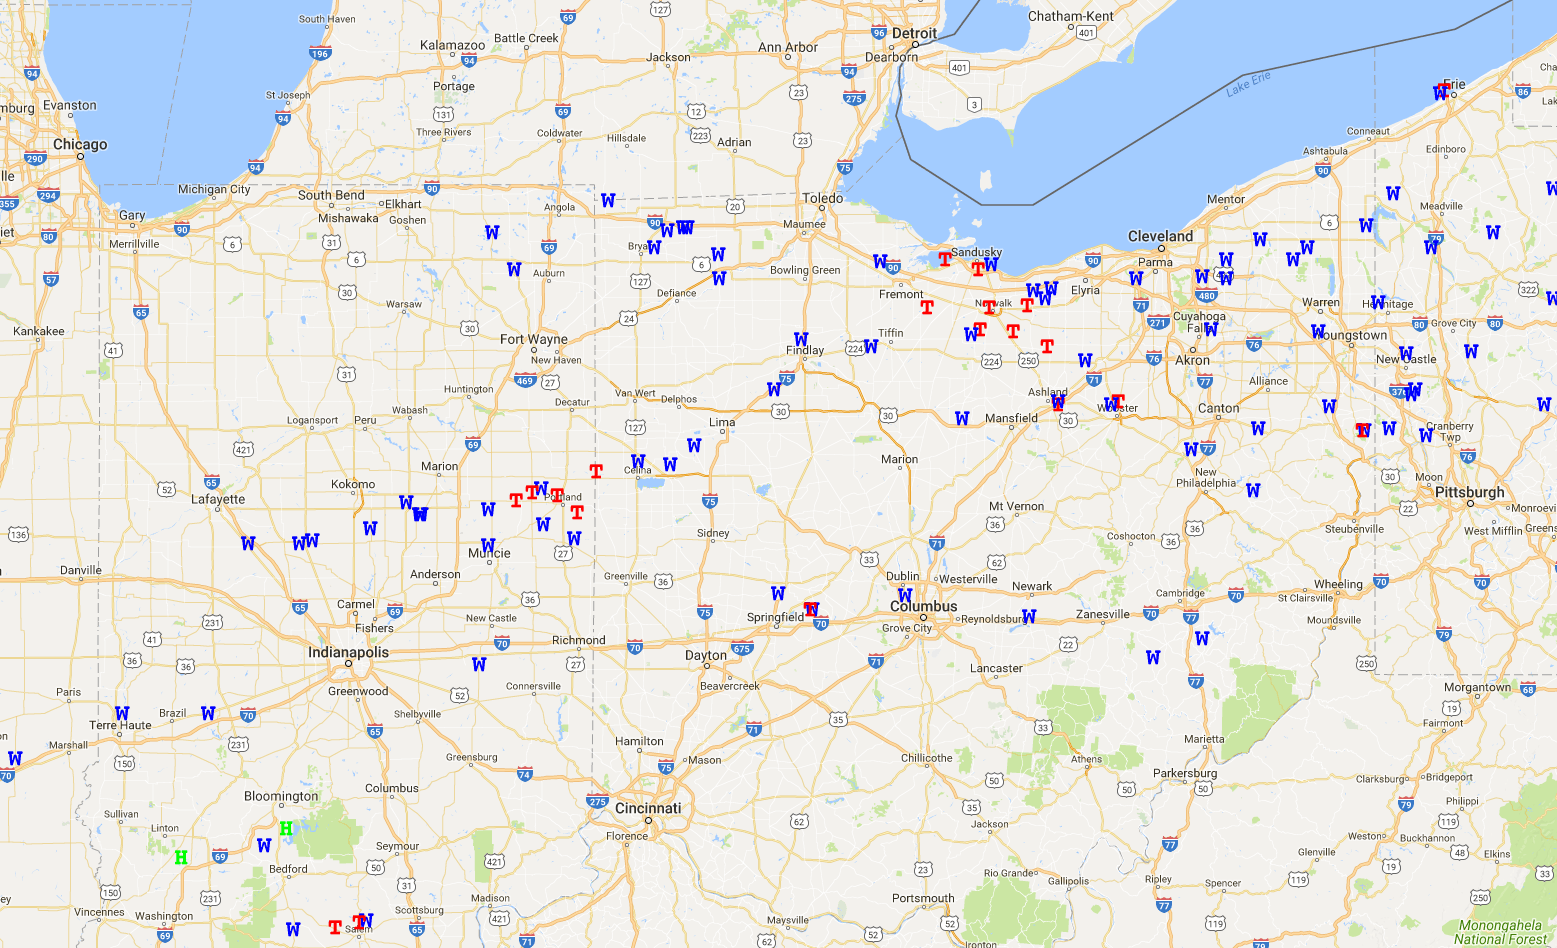
While no forecasters are perfect, the forecasters at SPC are very good at what they do, and this case was no exception. The tornado watch box was meant to raise awareness of the possibility of multiple tornadoes across Indiana and Ohio, and the severe weather reports from November 5 [26] show that more than a dozen tornadoes occurred in the area covered by the watch (each red "T" marks a tornado report, while each blue "W" marks a report of damaging straight-line winds).
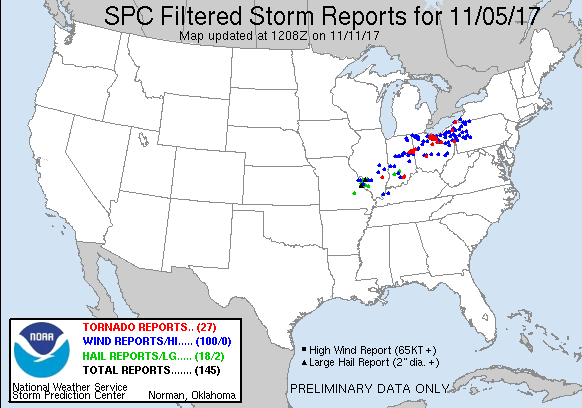
A more zoomed out look at the severe weather reports from November 5 [27] shows that tornadoes and damaging wind also occurred across northwestern Pennsylvania, and severe hail occurred across parts of Missouri and Illinois. Given the large areas that can experience severe weather in a single day, it's not uncommon for several severe thunderstorm and / or tornado watches to be in effect simultaneously. In fact, SPC issued three tornado watches, along with two severe thunderstorm watches on this date, represented by the red and blue parallelograms, respectively on this animation of SPC watches superimposed on radar [28] spanning 23Z on November 5 to 0015Z on November 6. As you can see, SPC covered the area where severe weather occurred quite well!
When severe thunderstorms are occurring, or when radar imagery reveals signs of imminent severe weather, a local forecast office of the National Weather Service will issue a severe thunderstorm warning or tornado warning. What do these warnings mean?
- A severe thunderstorm warning means that forecasters have identified a thunderstorm capable of producing at least one-inch diameter hail or wind gusts of at least 50 knots (58 miles per hour) based on its radar characteristics (or storm spotters are reporting that at least one of these things is occurring). Seek shelter immediately!
- A tornado warning means that forecasters have identified a thunderstorm capable of producing a tornado (possibly in addition to other severe weather) based on its radar characteristics (or based on spotter reports). Seek shelter immediately!
If a severe thunderstorm warning or a tornado warning has been issued for your area, imminent danger to lives and / or property from severe weather may exist currently or very soon. Take shelter and any other necessary precautions immediately!
Severe thunderstorm warnings and tornado warnings are more "urgent" than watches. Warnings also are much smaller than watches, usually spanning about the size of a single county, or maybe portions of several counties, and are also in effect for much shorter time periods (usually about an hour or less). Ideally, warnings are issued far enough in advance to give people in potentially-affected areas enough time to seek shelter and take other safety measures (at least a few minutes before severe weather strikes). Within the tornado watch from November 5, 2017 (shown above), a number of individual tornado warnings were issued, such as the one shown below, for a small area of north-central Ohio. Note the relatively small size of the tornado warning (compared to a watch) in the inset map on the lower left. This particular warning was in effect for just 32 minutes (it was issued at 4:58 PM local time and expired at 5:30 PM local time).

Ultimately, the severe weather (either damaging straight-line winds, large hail, or a tornado) that occurs within a warning area often only affects a small fraction of the area covered by the warning, so a severe thunderstorm warning or tornado warning is not a guarantee that you will personally be impacted by severe weather. A tornado did occur within this particular warning [29], but its damage path never exceeded 400 yards wide (less than one-quarter of a mile). So, most people in the warning area were not affected by the tornado, which is typical.
Most warnings are issued based on analysis of Doppler radar data, and in the case of tornado warnings, that's a double-edged sword. On the good side, Doppler radar has helped forecasters give earlier advanced warning of tornadoes. Before the Doppler radar era (which began nationwide in the early 1990s), tornado warnings were issued only about three minutes before the actual tornado occurred, on average. But, with Doppler radar's ability to detect rotation within thunderstorms, forecasters can give more advanced warning (10-15 minutes, on average), giving the public more time to seek shelter.
But, not all thunderstorms that exhibit rotation actually form tornadoes (in fact, most don't), and that leads to many "false alarm" tornado warnings (warnings issued in cases where a tornado never occurs). Statistics show that about 75 percent of tornado warnings are actually false alarms [30]. Weather forecasts have improved greatly over the years, but small-scale, fast-changing weather events still provide huge challenges to forecasters, and the precision and accuracy of warnings is an area where there's still lots of room for improvement. The new capabilities of dual-polarization radar (to detect debris from tornadoes) may be able to lower the false-alarm percentage in time, but there's significant concern that the high false-alarm rate will lead to public complacency about tornado warnings. Still, at the end of the day, it's wise to take all warnings seriously and take appropriate precautions immediately. If you prepare and seek shelter and then no severe weather occurs, you're safe (although maybe inconvenienced or annoyed). But, if you ignore the warning and then you're ill-prepared for severe weather that does occur, you may end up injured or dead.
Being able to interpret severe thunderstorm watches and warnings is a critical life skill so that you can identify situations when you may need to take quick actions to seek shelter. I highly recommend having a trusted source of weather information that allows you to get watches and warnings at all times (such as NOAA Weather Radio [31], or a reliable weather mobile app). Receiving and acting on critical warnings could save your life! Up next, we're going to start looking at the types of thunderstorms that are the most prolific severe weather producers. Read on!
Squall Lines, Derechos, and Bow Echoes
Prioritize...
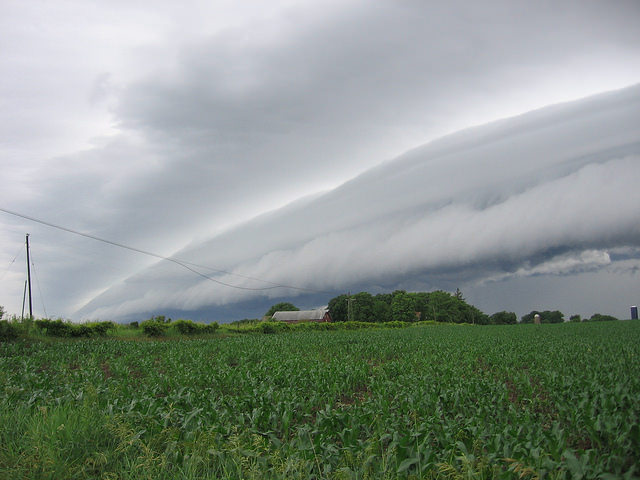
By the end of this section, you should be able to define squall lines, bow echoes, and derechos. In addition to formally defining each of these, you should be able to describe their basic structure and impacts. You should also be able to describe the type of cloud (a shelf cloud) that sometimes signals the arrival of a gust front.
Read...
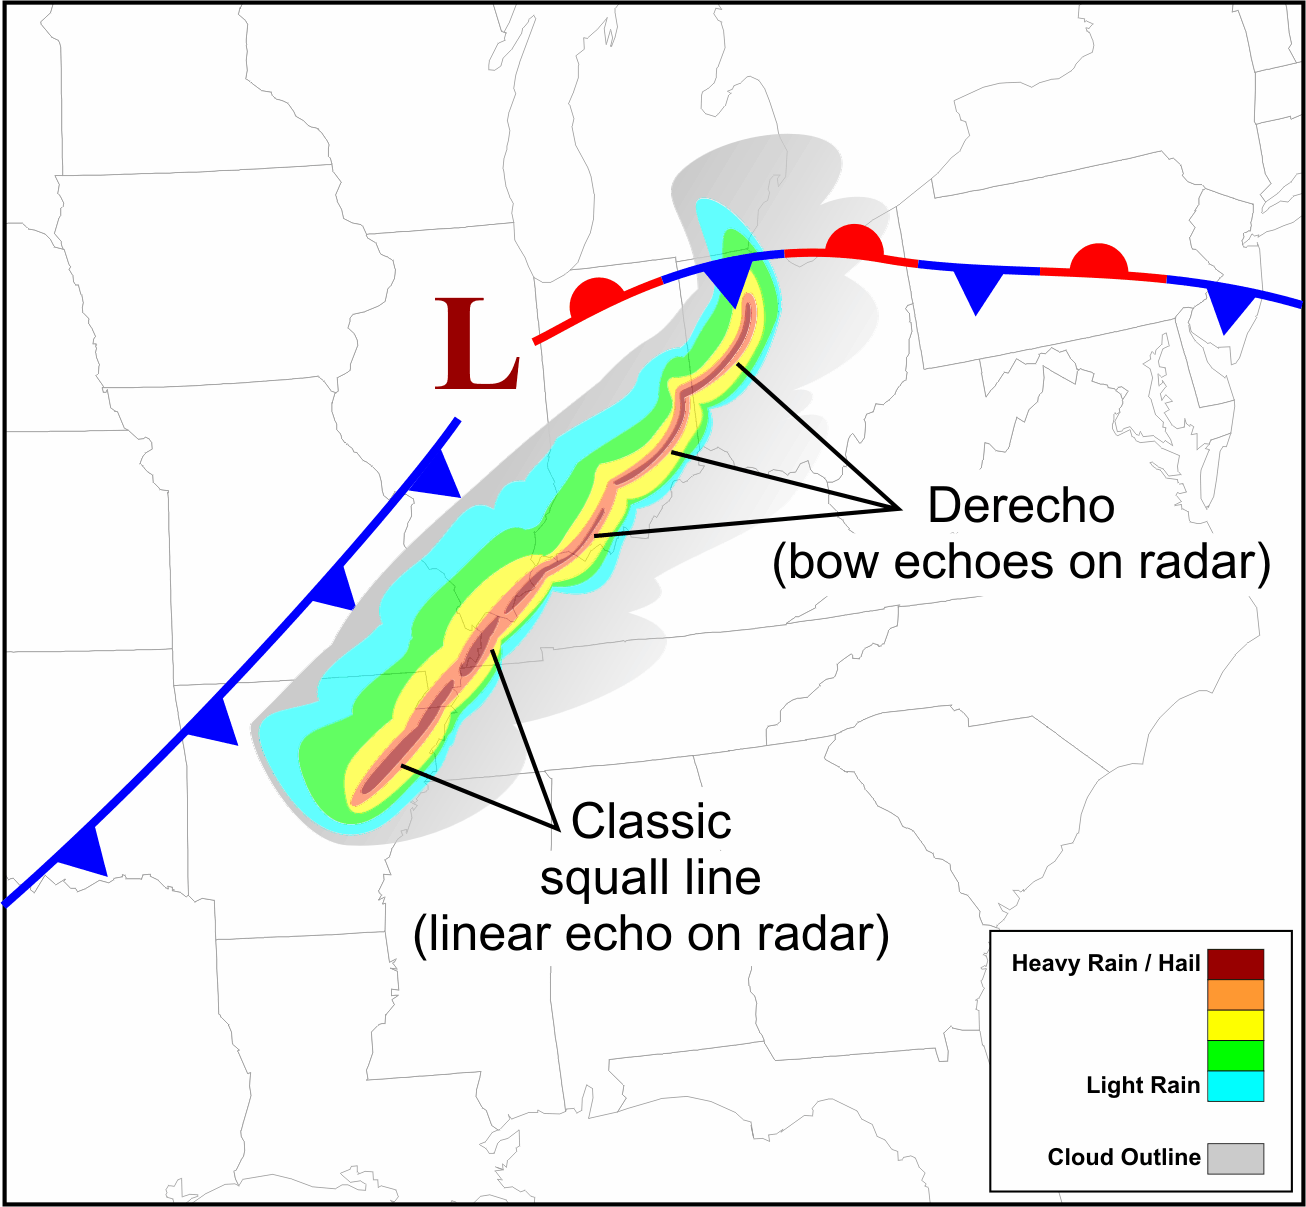
Have you ever seen the movie, The Wizard of Oz? Are you familiar with the scene in The Wizard of Oz [32] when Dorothy, the Scarecrow, and the Tin Man fearfully chant "Lions and tigers and bears, oh my!" as they walk along the yellow brick road through the forest? When I wrote the title to this section, I couldn't help but think of that scene. This section is about squall lines, bow echoes, and derechos (oh my!), and it begins our focus on the types of thunderstorms that are the most prolific severe weather producers. These thunderstorms warrant some extra attention because they tend to cause the most widespread, damaging severe weather outbreaks. Squall lines, derechos, and bow echoes actually aren't three separate types of thunderstorms, but they all indicate an increased risk of damaging straight-line winds, so like Dorothy, the Scarecrow, and the Tin Man, let's forge ahead (chanting "squall lines and bow echoes and derechos, oh my!" is optional).
Squall Lines
By definition, squall lines are clusters of thunderstorms that have a prominent, relatively linear signature on images of radar reflectivity. While squall lines can produce any kind of severe weather, they most prominently produce damaging straight-line winds. The convection in a squall line tends to be relatively narrow, while the characteristic length can range from approximately 50 miles to hundreds of miles. Squall Lines can be solid (thunderstorms "touch" each other), as the image of radar reflectivity at 23Z on March 9, 2006, attests (below). Note that the squall line is solid from central Tennessee, to northwest Alabama and into Mississippi. Squall lines can also be broken (cell-sized gaps between thunderstorms). Check out this visible satellite image of a squall line [33] over the Middle West at 22Z on August 28, 2007, and note the spacing between storms from western Wisconsin across southeast Minnesota to northern Iowa.

The thunderstorms that we studied previously (single cells, multicells, and supercells) were all relatively discrete (meaning relatively isolated). So, what causes some thunderstorms to develop into long lines? Squall lines tend to develop along (or very near) surface boundaries like cold fronts or surface troughs of low pressure because these boundaries mark zones of low-level convergence. If the low-level convergence is strong enough along the boundary, many air parcels in close proximity to each other along the boundary get forced upward, and if they're positively buoyant, that leads to many adjacent thunderstorms along the boundary.
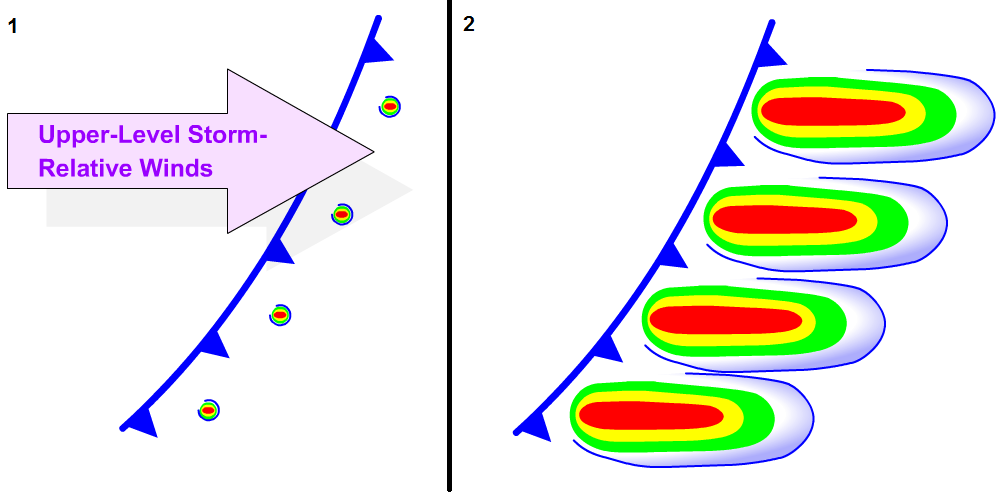
Even if the low-level convergence isn't extremely strong along the boundary, a squall line can still develop. If the upper-level winds relative to the storms' motion blow mostly parallel to the boundary, precipitation aloft in the clouds tends to get blown along the boundary, too, leading to long, nearly continuous thunderstorms [34]. On the other hand, when the upper-level winds relative to the storms' motion blow mostly perpendicular to the boundary, precipitation aloft in the clouds tends to get blown perpendicular to the boundary too, allowing the cells to remain somewhat separated, creating a broken squall line [35].
Squall lines form and thrive (they can last for several hours or even longer, on occasion) in environments with strong vertical wind shear, especially in the lower troposphere. Strong vertical wind shear tends to go with stronger low-level winds blowing relative to the squall line's gust front, which keeps it restrained and prevents the cold pool from racing out far ahead of the line of thunderstorms. If the cold pool is unrestrained and races out ahead of the squall line, thunderstorms tend to be short lived because squall line's updrafts lose access to warm, moist, buoyant air parcels (not unlike the dying updraft of a single cell thunderstorm).

Squall lines also typically have an area of stratiform rain that trails the main line of thunderstorms (called the "trailing stratiform" region), although depending on how the upper-level winds are blowing, the area of stratiform rain occasionally is ahead of the squall line or even parallel to it [36], so there's more than one flavor of squall line! Many squall lines are also preceded by a shelf cloud, which is a low-level, horizontal wedge-shaped cloud along a gust front. The shelf cloud marks rising air along the leading edge of the gust front, and the approach of a shelf cloud can look quite ominous (as in this shelf-cloud photo [37] from the NOAA library), suggesting that the approaching gust front may pack a punch!
To see a raging squall line blossom, check out this radar loop from 22Z on January 29, 2008 to 02Z on January 30 [38]. By the end of the loop, you'll see a long, continuous squall line stretching from western Ohio to Tennessee. This squall line formed in conjunction with strong low-level convergence along a cold front (18Z surface analysis [39]), and caused hundreds of reports of damaging winds (each marked by a blue dot on the map of SPC storm reports for January 29, 2008 [40]). You may have also noticed that the squall line wasn't a perfectly straight line on radar. It had sections that bulged forward. That's a classic radar signature that damaging straight-line winds are likely occurring.
Bow Echoes
A bow echo is crescent-shaped radar echo that sometimes appears along the otherwise linear reflectivity pattern associated with a squall line, which is frequently associated with damaging straight-line winds and occasionally, brief tornadoes. As you learn about bow echoes, keep in mind that they are strictly features observed on radar. In other words, a bow echo itself is not a type of storm or a storm hazard. Rather, it's the radar footprint that signals that a storm hazard (damaging straight-line wind along a squall line) is likely occurring.
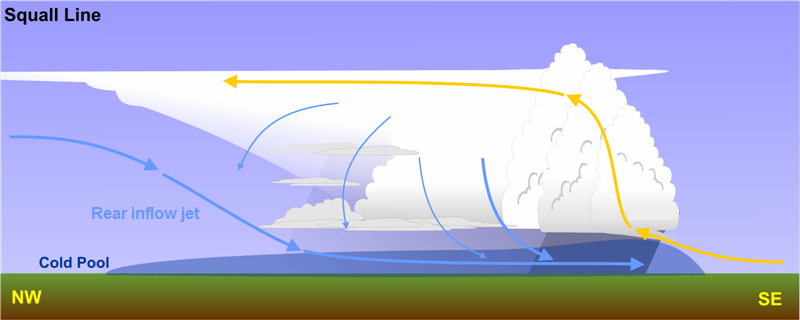
The details of how bow echoes form are beyond the scope of this course, but the bottom line is that sometimes pressure gradients aloft in the vicinity of the squall line cause a stream of air to rush into the back edge of the squall line [41] (called a "rear-inflow jet") and descend toward the surface, sometimes reaching all the way to the ground. When a rear-inflow jet descends to the surface (essentially a downburst), the stage is set for a portion of the squall line to bulge forward in response to the surge in low-level winds. On radar reflectivity, a bow echo appears in this region. Such echoes got their name because of their resemblance to an archery bow, which you can see on the radar mosaic from 1150Z on May 2, 2008 (below).

Of course, images of radar reflectivity don't have to display bow echoes in order for there to be wind damage, but when squall lines with bow echoes become long-lived, the stage is set for damaging winds over an expansive path. Meteorologists give such long-lived wind storms a special name.
Derechos
Formally, a derecho (pronounced "de-RAY-cho") is a widespread, convectively-induced straight-line wind storm composed of numerous downbursts produced by a group of thunderstorms. Derecho is actually a Spanish word that, in this context, translates to "straight-ahead" or "direct." There's some disagreement in the meteorological community on what exact criteria should define a derecho, but we'll use these as our criteria:
- There must be a "concentrated area" of reports of wind damage and/or convective wind gusts greater than 50 knots that follows a chronological pattern consistent with a long-lived group of thunderstorms. This area of reports must be at least 400 kilometers (about 250 miles) long.
- Within this area, there must be at least three reports of damage as severe as what could be inflicted by a weak tornado and/or wind gusts of 65 knots (75 miles per hour) or more. The reports must be sufficiently spread apart (at least 64 kliometers, or about 40 miles) to indicate that the thunderstorms maintained noteworthy intensity for a sufficiently long time.
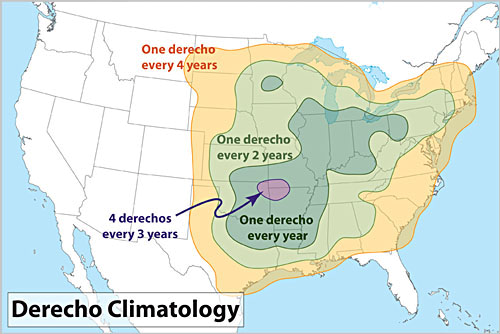
In the interest of full disclosure, some meteorologists don't believe that reports of wind gusts of at least 65 knots should be included in the criteria (it's a hard criteria to meet), but I'll include it in the definition because it reserves the term "derecho" for truly remarkable, long-lived wind storms. Derechos are most common from May through July in the United States, and most areas of the eastern U.S. (east of the Rockies) experience a derecho at least once every few years [42], on average. Derechos are most common in a swath from the southern Plains to the southern Great Lakes region.
Some derechos are basically long-lasting, ferocious squall lines that display multiple bow echoes on radar imagery [43]. They often form along or ahead of a cold front (perhaps in a trough of low pressure ahead of the front), and are called "serial derechos." But, there's another kind of derecho that's more common during the warm season. It forms a bit differently, in that it typically starts as a cluster of thunderstorms to the north of a warm or stationary front, and is called a "progressive derecho." Over time, progressive derechos develop multiple bow echoes and end up resembling squall lines as they mature.
A prime example of a progressive derecho occurred on June 29, 2012, which started as a cluster of thunderstorms over northwest Illinois and east-central Indiana. This radar loop of the June 29, 2012 derecho [44] is a "must watch," as it documents the storms from their initiation around Chicago through their race off the East Coast. Along the way, this derecho carved a path of destruction, as evidenced by the map of storm reports below.

More than 600 severe wind reports with this derecho took their toll, and all in all, more than 4.2 million customers lost power during the storm (roughly 250,000 customers still did not have power a full week later). The following week was very hot in some of the hardest hit areas of Indiana, Ohio, and West Virginia, and the combination of sweltering heat and no electricity for air conditioning (or refrigeration for food) caused this storm to take on legendary status for those affected. So, while any squall line brings an increased risk of wind damage, the extent of wind damage from derechos is in a league of its own. But, straight-line winds aren't the only wind-related threat associated with thunderstorms. Up next, we'll shift our focus to tornadoes -- the wind-related threat that takes all the headlines. Read on.
Putting a Spin on Supercells and Tornadoes
Prioritize...
This section is about tornadoes and the storms that most typically produce them -- supercells. By the end of this section, you should be able to define tornadoes and funnel clouds, describe the tornado climatology in the United States (including geographic locations and monthly distribution), and describe where the rotation of a supercell and tornado comes from.
Read...

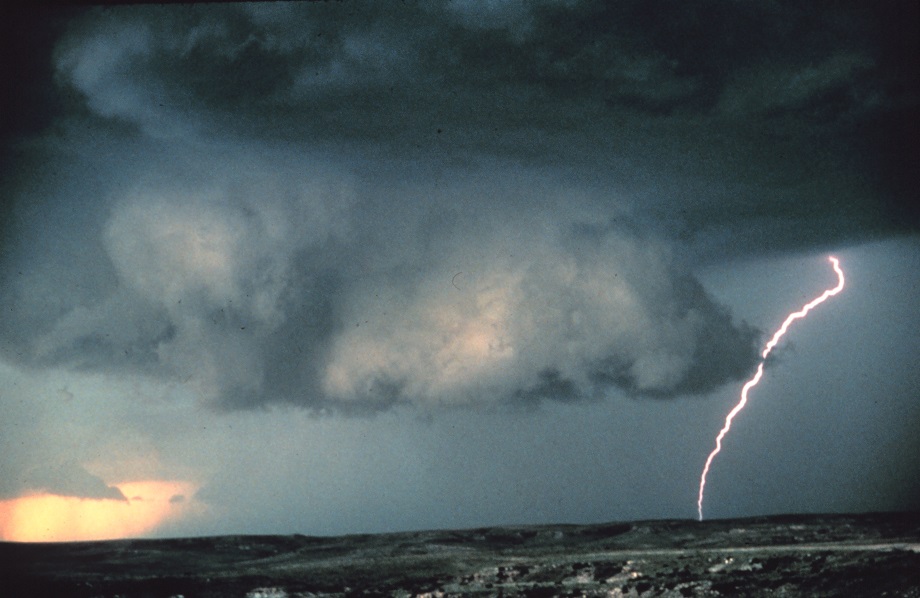
While there's no doubt that damaging straight-line winds are a major thunderstorm hazard, tornadoes tend to make the big headlines. Although I've described tornadoes before (and you're probably somewhat familiar with them), formally a tornado is a rapidly rotating column of air in contact with the ground and with the base of a cloud. Note that, by definition, a tornado must be in contact with the ground. There's no such thing as a tornado that's not on the ground, so if you've ever seen storm-chaser video of a tornado and someone yelled "Tornado on the ground!" they were being redundant. If there's a rapidly rotating column of air that's descending from a cloud, but it doesn't touch the ground, it often appears as a funnel cloud (see the photo on the right for an example).
Tornadoes can vary in shape and size, but the average tornado is only a few hundred feet wide. On the large end of the spectrum, tornadoes can exceed two miles in width, so in the scheme of things, tornadoes are pretty small weather features, but they can be devastating. Even so-called "weak" tornadoes have wind gusts around 65 miles per hour or more (plenty strong enough to damage property). On the other hand, the strongest tornadoes can attain wind speeds of more than 200 miles per hour, which can flatten entire neighborhoods and grab top headlines [48].
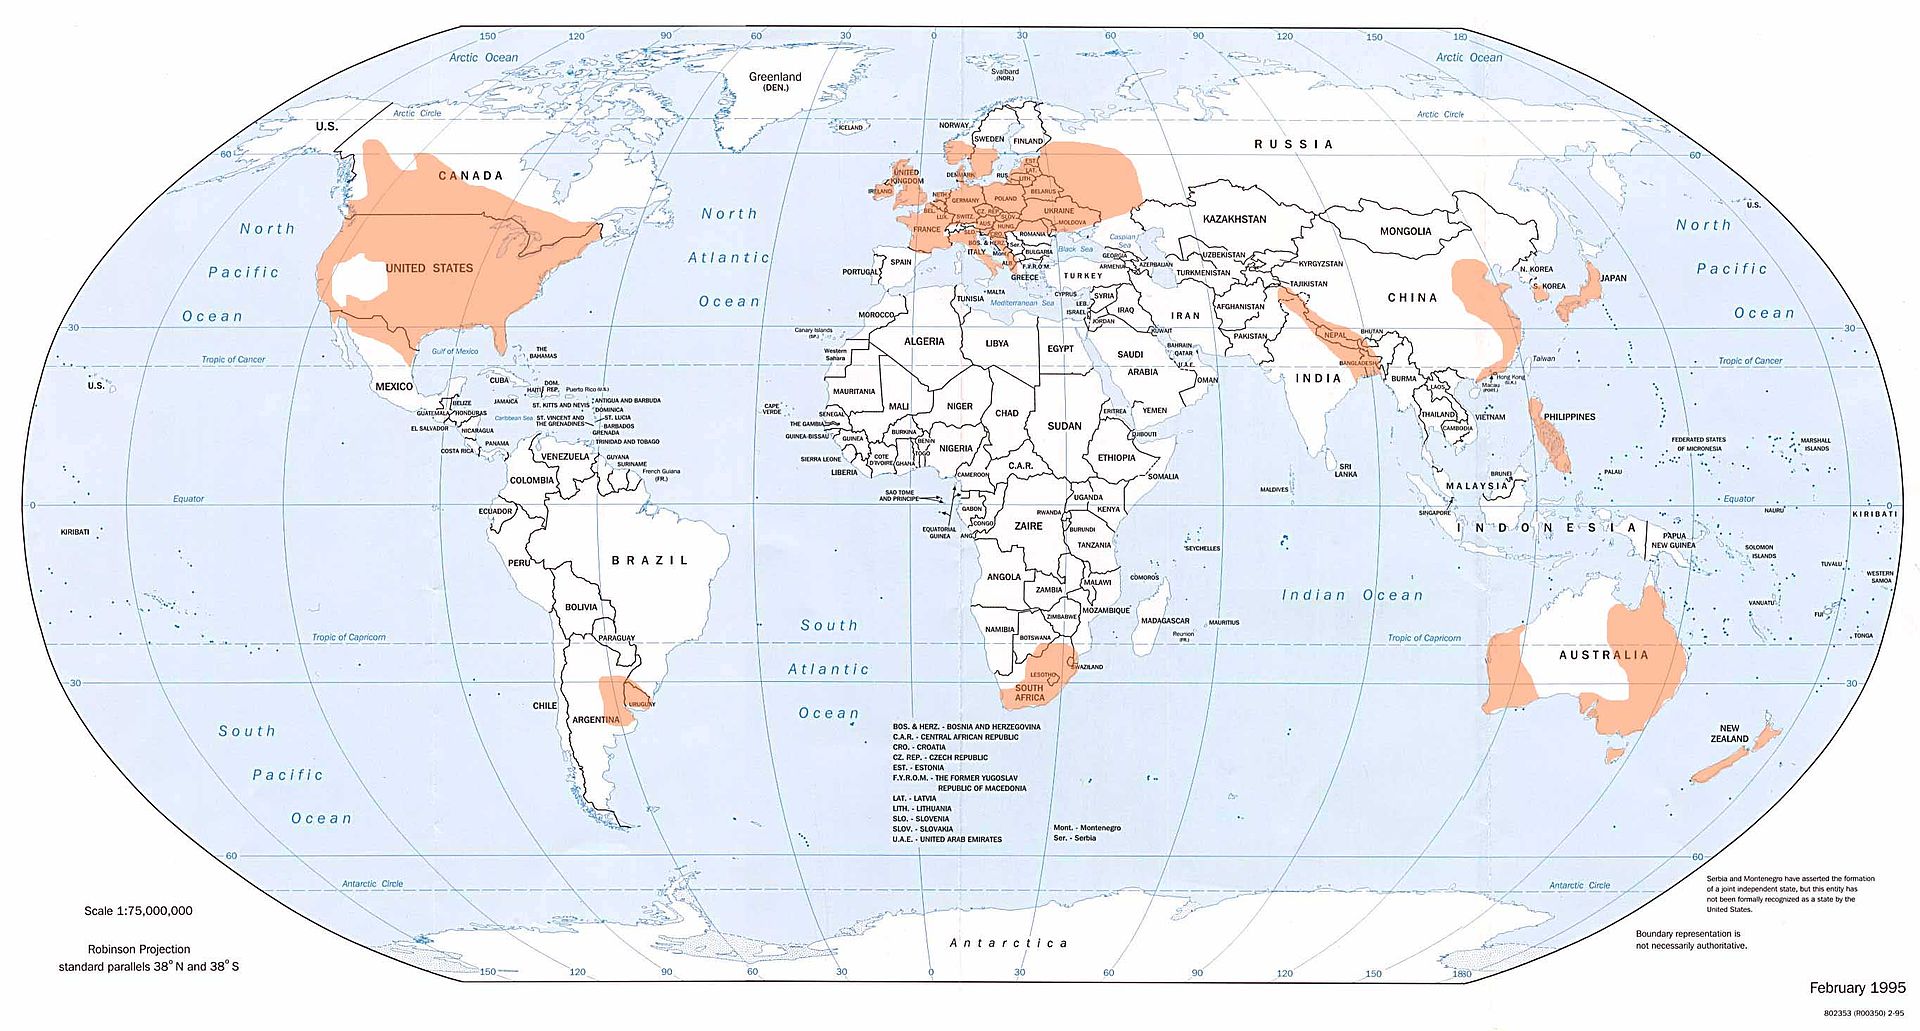
As you may recall, most tornadoes (and nearly all strong tornadoes) are caused by supercell thunderstorms (thunderstorms characterized by a rotating updraft), so tornadoes can happen anywhere that supercell thunderstorms can develop. Statistics show that the United States is the world leader in tornadoes (averaging more than 1,000 per year), followed by Canada (a distant second at roughly 100 per year). Several other regions of the world regularly experience tornadoes, however (shaded in orange on this world map from the National Climatic Data Center [49]).
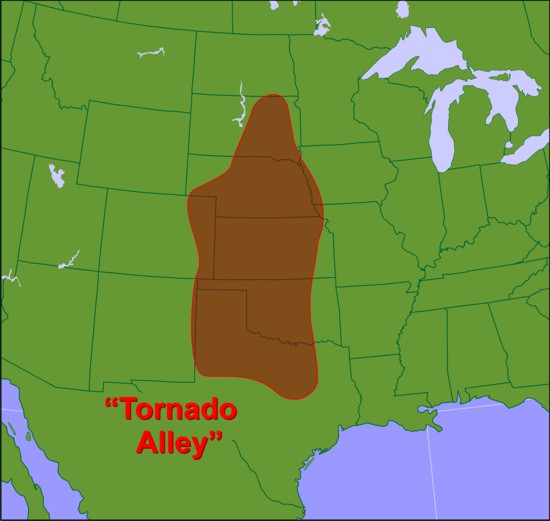
Within the United States, tornadoes have occurred in all 50 states, although they're much more common in some states compared to others. The map below shows the average annual number of tornadoes per 10,000 square miles in each state from 1995 to 2014. First, take note that the states in the western U.S. labeled with zeroes merely average less than one tornado per 10,000 square miles per year (so tornadoes are infrequent, but not unprecedented). Secondly, the Great Plains, Midwest, and Southeast U.S. tend to be "hotspots" for tornadoes (states like Kansas, Oklahoma, Iowa, Illinois, Mississippi, Alabama, and Florida). Alaska and Hawaii aren't shown on the map, but tornadoes occur in those states, too (although infrequently, especially in Alaska).

The relative frequent occurrence of tornadoes in much of the Great Plains compared to other parts of the country has earned it the nickname "Tornado Alley [50]." But, given the frequency of tornadoes in the Southeast, forecasters are starting to recognize a secondary "tornado "alley" that extends across much of the Southeast U.S., sometimes referred to as "Dixie Alley [51]." Why are these zones so ripe for tornadoes? Well, for starters, they most frequently possess the ingredients for supercell thunderstorms. You may recall that supercell thunderstorms require instability for positively buoyant air parcels and strong vertical wind shear. But, the formation of individual supercells also requires weak or modest sources of lifting (remember that when lifting is really strong, lots of thunderstorms form in close proximity, and squall lines often develop). In short, favorable ingredients for supercells and tornadoes come together in "Tornado Alley" and "Dixie Alley" more often than in other parts of the country.
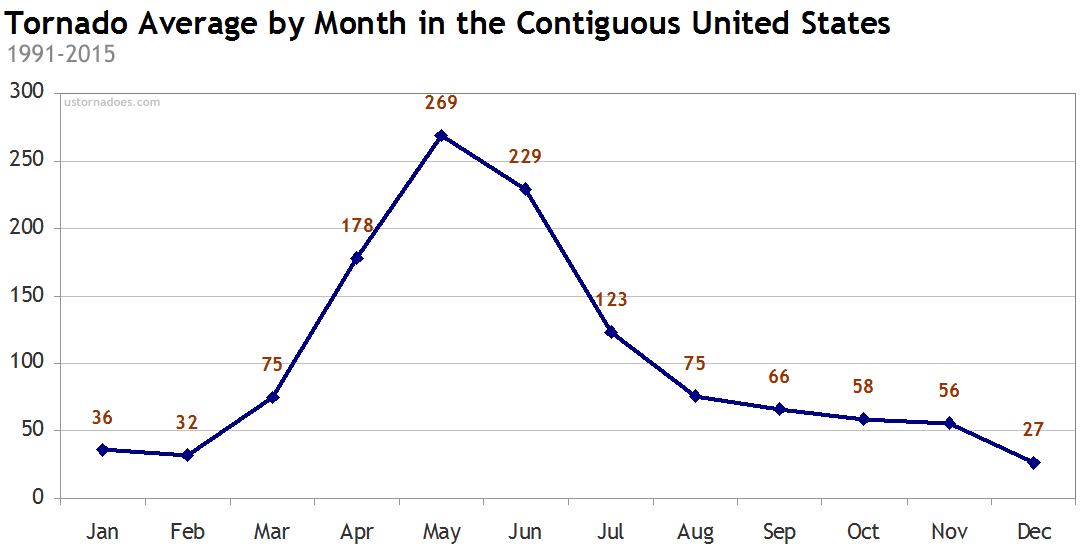
Throughout the year, tornado activity also has a seasonal "rhythm" to it, as this animation showing the probability of a tornado on select dates throughout the year [52] shows. The lifting that comes along with mid-latitude low-pressure systems along with access to maritime-Tropical air can be a volatile recipe for severe thunderstorms and tornadoes, and those ingredients typically come together most favorably along the Gulf States in the winter. As winter turns to spring, the likelihood of tornadoes increases farther north into the Great Plains, as the northward extent of maritime-Tropical air increases. The extent of tornadoes in the summer months spreads even farther north, and even toward the Northeast U.S., when warm, buoyant air is more readily available. Late in the year as summer turns to fall and winter, the likelihood of tornadoes decreases again (and migrates southward again). In terms of overall numbers, April, May, and June are typically the most active months for tornadoes, with the peak of tornado activity occurring in May, on average [53] (credit: ustornadoes.com).
Putting a Spin on Supercells
So, why are supercells the most common producers of tornadoes? It all comes down to spin. Supercells are characterized by a sustained, rotating updraft, but what causes the rotation? When I introduced supercells, I discussed the importance of strong vertical wind shear in increasing the storm's longevity by separating the storm's updraft and downdraft, which ensures that the downdraft doesn't interfere with the updraft. But, vertical wind shear is important for inducing rotation into the storm, as well. In particular, it's wind shear in the lower troposphere that's critical.
To use an analogy, I like to think of supercells as getting their spin by "eating" long, spinning "spaghetti noodles" of warm, moist air. How does a supercell "eat" spinning spaghetti noodles? When there's strong vertical wind shear in the lower troposphere, wind speeds increase markedly with increasing altitude, which would impart spin on a horizontal "noodle" of air [54] aligned with the flow into the storm's updraft. If you're having trouble visualizing, take (or imagine) a pencil resting on the palm of your left hand and then move your right palm over the pencil to simulate faster winds above -- the pencil should roll across your hand, which is similar to the process of how faster winds above the surface can produce a horizontal "noodle" of rotating air.
As the twirling "noodle" of air gets drawn into the storm's updraft, the rotating air gets tilted vertically, resulting in the formation of a mesocyclone, which rotates around a vertical axis. The annotated photograph below should help you visualize a long, spinning "spaghetti noodle" getting ingested into a supercell's updraft. Or, if a spaghetti noodle visualization doesn't do it for you, think of a stream of perfectly spiraling footballs [55] flowing toward the storm and then tilting vertically as they get sucked into the updraft.

But, the presence of a mesocyclone doesn't guarantee that a tornado will form. The spinning column of air that is the mesocyclone must get further "stretched" vertically, which causes the column to spin more rapidly, via the conservation of angular momentum [56]. If you've ever watched a figure skater perform a scratch spin [57], you've seen this concept in action. As the skater pulls her arms in and raises them above her head, she spins faster as a result of the conservation of angular momentum. By pulling her arms in, she decreases her radius of rotation, and increases her spin rate. This process is a critical part of the transition from a mesocyclone to a tornado -- the updraft must contract (become "skinnier") and stretch vertically in order to spin faster, paving the way for a tornado.
How and why does this vertical stretching occur? Why does it happen in some supercells and not others? Good questions! Unfortunately, they're questions that we don't have concrete answers for currently. Some emerging theories suggest that the buoyancy of air parcels and the relative humidity of air parcels in the lower troposphere are important factors. If they're not "just right," a tornado won't form. We ultimately don't know the exact details of the mechanisms that form tornadoes yet, but meteorologists are still actively studying the process through observations taken during field experiments. Measuring the environment in and immediately surrounding a tornado has historically not been easy! In fact, if you've ever seen the movie 1996 movie, Twister [58], the chasers' devised method for measuring a tornado's environment was actually based on a real research project from the 1980s [59].
So, that's the story of where and when tornadoes most commonly form, and how a supercell gets the spin that can produce a tornado. Up next, we'll explore the anatomy of a supercell more closely.
More on Supercells and Tornadoes
Prioritize...
At the end of this section, you should be familiar with the anatomy of a supercell. Specifically, you should be able to describe the forward-flank downdraft, rear-flank downdraft, updraft region, mesocyclone, and tornado (if applicable). You should also be able to describe the cloud formation (a wall cloud) that's often a precursor to a funnel cloud or tornado formation, and identify the location on radar reflectivity where a tornado might form in a classic supercell.
Read...
We're going to continue with a closer look at supercells since they're such prolific severe weather producers. After all, supercells produce most tornadoes (and nearly all strong tornadoes), are responsible for nearly all reports of hail at least two inches in diameter, and nearly all supercells produce damaging straight-line winds. So, supercells are a triple threat when it comes to severe weather.
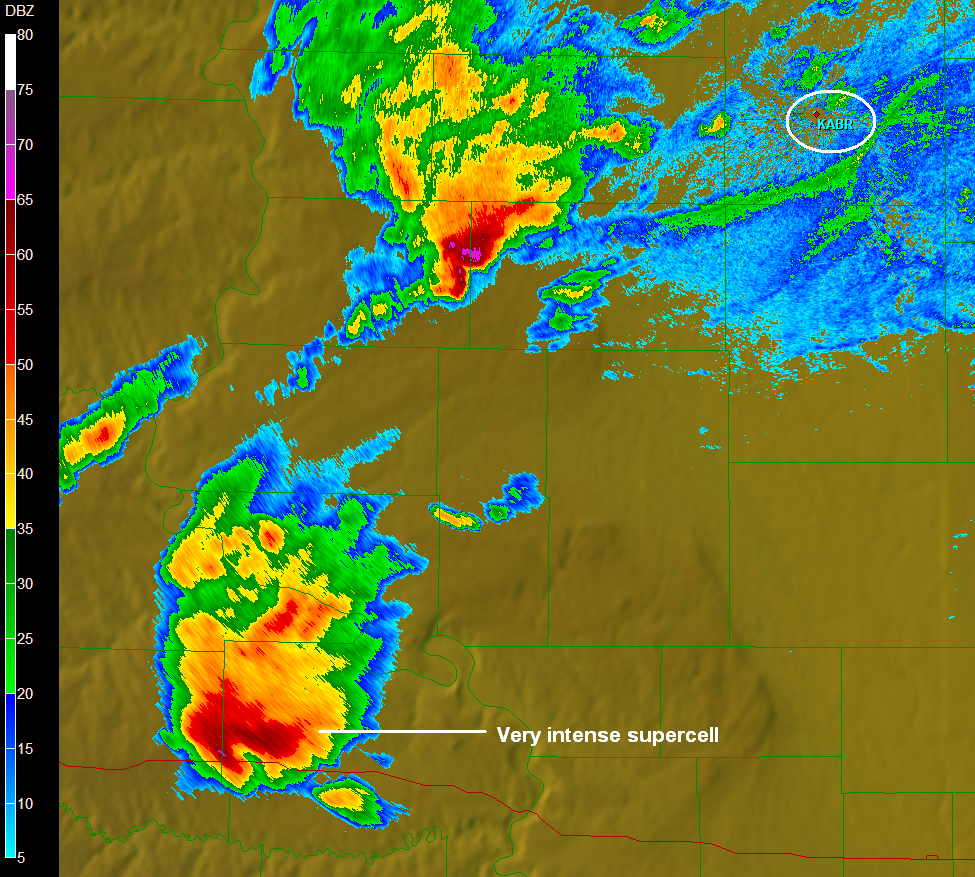
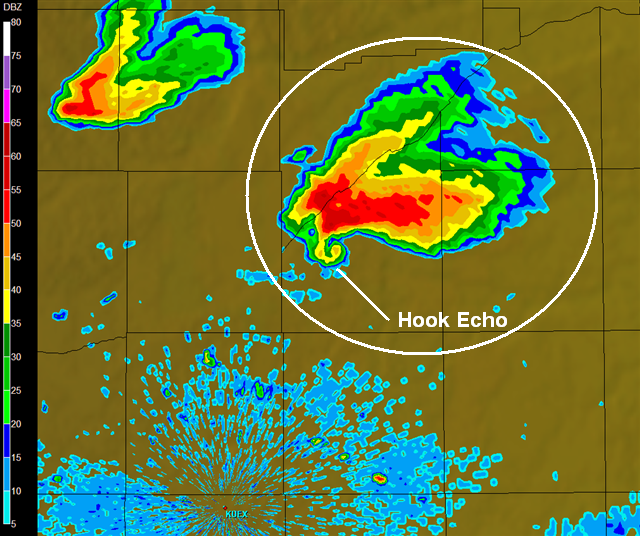
To start, we're going to build off the basic model of a supercell that you learned previously. A classic supercell displays a hook echo on images of radar reflectivity [60], which occurs as precipitation wraps around the mesocyclone (the rotating updraft), and if a tornado forms, it does so within the hook echo. But, supercells have unique characteristics when it comes to their updrafts and downdrafts compared to other types of thunderstorms, thanks in large part to strong vertical wind shear. Precipitation particles swept upward in the rotating updraft are rapidly carried downstream away from the updraft by strong upper-level winds (air movement within the storm is traced out by tan arrows on the cross-section of a supercell below).

As a result, precipitation particles fall earthward well northeast (or east-northeast) of the updraft typically (note that the highest reflectivity is displaced from the updraft and mesocyclone [60]). This cascade of precipitation particles promotes a downdraft (falling precipitation particles drag air down with them) called the forward-flank downdraft (FFD). Formally, the FFD is the main region of downdraft in the forward (leading) part of a supercell. The FFD is also where most of the heavy precipitation is located within a supercell. Because the precipitation particles have been swept away from the main updraft thanks to strong vertical wind shear, the FFD does not interfere with the updraft, and since updraft and the FFD are separated, the stage is set for supercells to be long-lived.
But, many supercells actually have two distinct areas of precipitation, and therefore, two distinct downdrafts, as demonstrated by this radar cross-section of a supercell [61] (from a supercell near Rapid City, South Dakota on July 13, 2009). In addition to the FFD, there's another downdraft associated with precipitation called the rear-flank downdraft (RFD). How can supercells have two distinct areas of precipitation? Well, some falling precipitation actually gets caught in the mesocyclone's circulation and wraps around to form the hook echo on radar. The RFD develops when dry winds in the middle and upper troposphere (typically southwesterly or westerly) encounter the back side of the updraft, where that precipitation is wrapping around the mesocyclone. The interaction with this dry air promotes evaporation and associated cooling, which, in turn, promotes negative buoyancy and downward accelerations. Some other complex factors (beyond the scope of the course) also contribute to the formation of the RFD, but the bottom line is that a separate rear-flank downdraft exists in supercells. The RFD even comes with its own gust front, as the leading edge of rain-cooled air spreads out laterally from the splashdown point of the RFD.
To help you visualize and locate the various parts of a supercell, including the updraft, mesocyclone, RFD, and FFD, check out the short video "tour" of a supercell below (2:47). In the video, I discuss where these various parts of a supercell appear on idealized radar reflectivity, but also show that not all supercells take on a "classic" look with a hook echo.
We're going to take a short tour of a supercell thunderstorm, starting with the basic pieces you learned about previously. This is idealized radar reflectivity of a classic supercell moving toward the northeast. Air flows into the storm and rises in the updraft region, which coincides with the rotating mesocyclone. Because of vertical wind shear, the precipitation doesn't fall into the updraft, and the storm ends up with separate downdraft regions. Some precipitation wraps around the mesocyclone, forming the hook echo, and if the storm spawns a tornado, it usually forms near the hook echo, near the "T" on this graphic.
Now, let's add some more pieces to our model of a supercell. This idealized image shows radar reflectivity and the cloud outline associated with a classic supercell moving toward the northeast. You can see the storm's inflow traced by these arrows racing in and then ultimately rising in the rotating updraft, but most of the storm's precipitation actually falls on the forward, or leading, flank of the storm. This precipitation forms the forward-flank downdraft, which spreads out at the ground, forming a gust front along its leading edge.
There's another distinct region of precipitation in the storm that forms the rear-flank downdraft, which spreads out along the ground, forming its own gust front. Some of the precipitation in the rear-flank downdraft wraps around the mesocyclone to form the hook echo.
But, not all supercells are this classic. Depending on the upper-level winds, sometimes supercells don't display a hook echo at all. Sometimes, supercells take on more of a pendant shape, where you can see all of the precipitation falling in the forward-flank downdraft, but the rear-flank downdraft isn't very prominent, and contains little or no precipitation. These supercells can still produce a tornado, which would occur near the "T" in the mesocyclone, even though they don't display a hook echo on radar.
On the other hand, if the upper-level winds are just right, sometimes the rear-flank downdraft is really prominent, and contains lots of precipitation. In such cases, there's not an obvious hook echo, and the supercell's radar reflectivity ends up looking more like a kidney bean. Despite the lack of a hook echo, these supercells can still produce a tornado, which would occur again near the "T", although from the ground these tornadoes can be hard to see because they're often masked by precipitation wrapping around them.
So, not all supercells are created equal, which sometimes makes them hard to spot with radar reflectivity. Fortunately, today, meteorologists have Doppler radar with dual polarization capabilities to help them better identify supercells that may be spawning tornadoes.
If and when a tornado is going to form, it forms out of the mesocyclone, and sometimes a supercell will give off a visual warning that a tornado may form, even before the appearance of a funnel cloud. The visual clue is called a wall cloud [62] (credit: NOAA Photo Library), which is a local lowering of the cloud base in the mesocyclone. Wall clouds form when air from the forward-flank downdraft region of the storm, which has been cooled via evaporation, gets drawn back into the updraft. Because this air has been cooled by evaporation, its relative humidity is already fairly high, so when it rises into the updraft (and cools further), net condensation occurs more quickly than it does in surrounding air parcels, causing the cloud base to form at a lower altitude (as seen in the schematic below). Occasionally, a "tail cloud" traces the rain-cooled air from the forward-flank downdraft region into the updraft.

Because the wall cloud is part of a mesocyclone, it often visually displays rotation, and if enough vertical stretching occurs, a funnel cloud may start to descend from the wall cloud. The formation of a wall cloud, however, does not guarantee that a tornado will form, and some tornadoes form without being preceded by a prominent wall cloud. Still, a wall cloud is a visual clue that a supercell might spawn a tornado, and it gives a storm observer on the ground an idea of where a tornado may form in a supercell.

On radar imagery, forecasters look for the classic hook echo [63] to spot the area of a supercell where a tornado may form. But, the presence of a hook echo does not guarantee that a tornado will form. If only it were that simple! To further complicate matters, some tornadoes form in supercells that don't display a hook echo at all. For example, check out the radar reflectivity image from Warner Robbins, Georgia at 0136Z on March 15, 2008 (on the left). This storm doesn't display any obvious hook echo. In fact, there's really nothing about its appearance that clearly indicates it was a supercell. But, it was a supercell that produced a tornado that did damage to the Georgia Dome in Atlanta [64], while an SEC Tournament basketball game was in progress. Forecasters, fortunately, were able to detect rotation in this storm using Doppler velocities, and issued a timely tornado warning for downtown Atlanta.
Tornadoes certainly challenge weather forecasters because it's not always clear which supercells will produce a tornado and which supercells won't. Tornadoes also challenge public readiness because pinpointing the location where a tornado may form is rarely possible more than 20 or 30 minutes in advance, and sometimes its much less than that! Increasing warning lead time and reducing the number of tornado warnings that are false alarms are certainly major goals in the meteorological community because of the incredible danger and potential for damage associated with tornadoes. Up next, we'll turn our attention to the dangers of tornadoes and cover tips (and myths) about tornado safety. Read on.
Tornado Damage, Safety, and Myths
Prioritize...
Upon completion of this section, you should be able to describe the Enhanced Fujita Tornado Damage Scale (EF-Scale). You don't need to memorize the specifics of the scale itself, but you should be able to describe how it's used and distinguish between the weak and violent ratings. You should also be able to discuss:
- the frequency of weak tornadoes versus violent tornadoes
- safety tips for what to do when a tornado approaches (in various situations and structures)
- tornado myths (regarding "exploding houses," intermittent damage, and avoidance of mountains and cities)
Read...
Once upon a time, tornadoes almost seemed somewhat mysterious. Photographs or videos of tornadoes were a rare commodity because few people had cameras (or video cameras) handy when a tornado was nearby. But, in the era of cellphone pictures and videos, tornado pictures and videos are a dime a dozen! If you search for tornado videos on YouTube, you'll find tons (many with "colorful" language)! Some footage by professional storm chasing teams [65] is really jaw-dropping, and shows the raw, destructive power of tornadoes. If you see enough pictures (or videos) of tornadoes, it becomes clear that they come in all shapes and sizes (from less than 100 feet wide to more than two miles wide). So, not surprisingly, the damage done by tornadoes can vary widely.
Meteorologists can't yet reliably estimate the intensity of a tornado in real-time (although some methods are being developed using advances in radar technology), and we have no way of making precise wind speed measurements of most tornadoes. Therefore, meteorologists assess the strength of a tornado based on an visual assessment of the damage it leaves in its aftermath. This effort was pioneered by Dr. Ted Fujita in the 1970s, and the "Fujita Scale" (F-Scale) became the standard for rating tornado intensity based on damage. Further studies by meteorologists and engineers, however, refined the relationships between wind speeds and specific types of damage, so the scale was revised and updated in 2007. The updated scale, called the Enhanced Fujita Scale (EF-Scale) rates tornadoes from EF-0 (weakest) to EF-5 (strongest) based on 28 damage indicators that represent various types of structures or objects that could be damaged by a tornado. The final rating is based on the most severe damage that occurs at any point along the tornado's path.
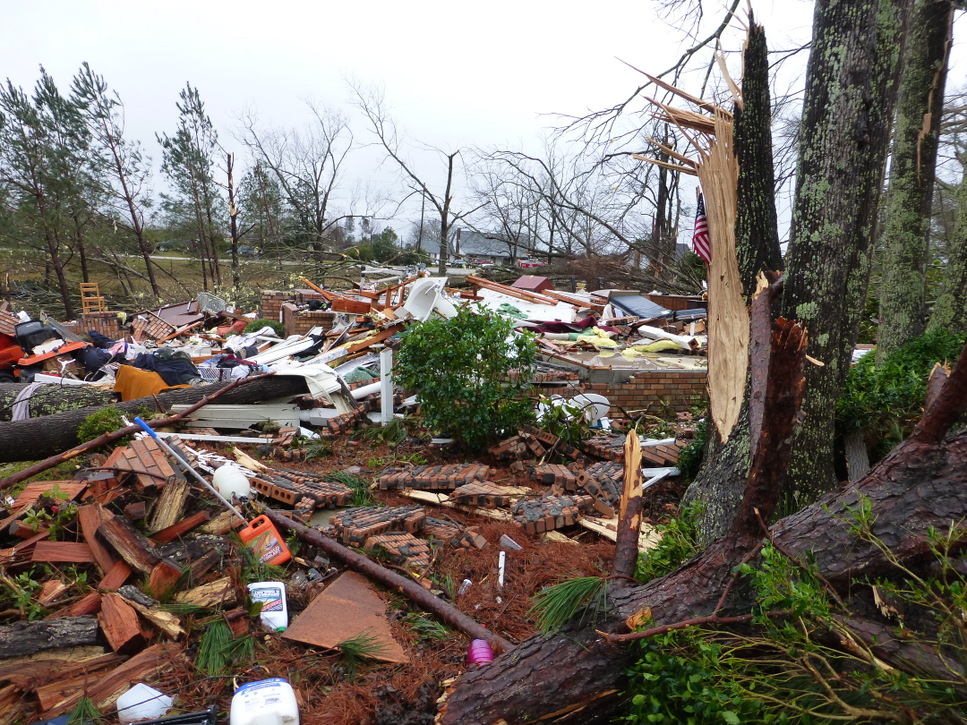
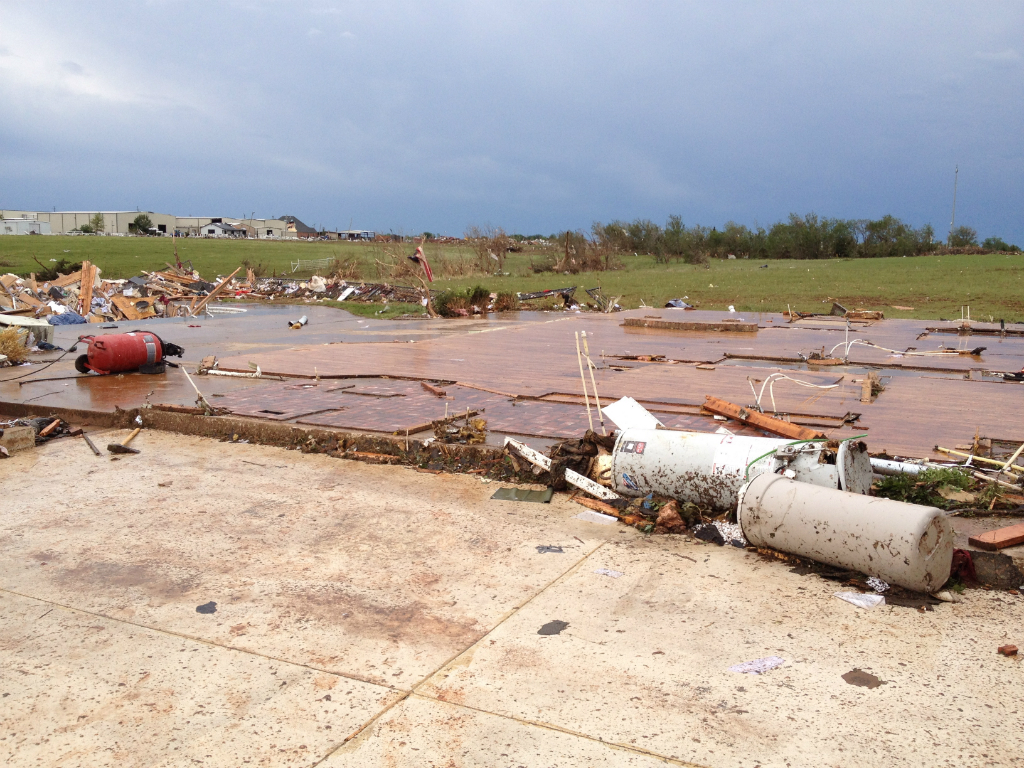
The EF-Scale is listed in the table below, along with the estimated wind speeds for each rating level and a description of the damage. Keep in mind that these wind speeds are estimates based on damage (not actual wind-speed measurements taken during the tornado). On the low end of the scale, an EF-0 tornado typically causes minor damage (loss of roof shingles, perhaps downed branches or small trees, etc.). Higher ratings become increasingly more damaging, and at the top end of the scale, EF-5 tornadoes cause incredible damage. Well-built homes can be completely removed from their foundations and swept away, and larger buildings (schools, shopping malls, etc.) sustain critical damage. Automobiles can be lifted off the ground and thrown hundreds or thousands of feet. If you click on each damage description in the table, you'll see a sample photograph to give you an idea of the type of damage associated with each EF rating (credit for all photos: National Weather Service).
| EF Rating | Estimated Wind Speed (mph) | Damage Description |
|---|---|---|
| 0 | 65 - 85 | Minor [66] |
| 1 | 86 - 110 | Moderate [67] |
| 2 | 111 - 135 | Considerable [68] |
| 3 | 136 - 165 | Severe [69] |
| 4 | 166 - 200 | Devastating [70] |
| 5 | More than 200 | Incredible [71] |
Most tornadoes in the United States (somewhere around 80 percent) are considered weak (EF-0 or EF-1), and about 95 percent of all tornadoes are EF-2 or lower on the scale. A little less than one percent of all tornadoes are considered violent (EF-4 or EF-5). From 1950 through 2013, just 59 F5 / EF-5 tornadoes occurred in the United States (their locations are plotted on this map [72] -- note that they're all in the Plains, Midwest, and Southeast U.S.), which is about one per year, on average. So, violent tornadoes (EF-4 and especially EF-5) are relatively rare, but they are responsible for nearly two-thirds of all tornado-related fatalities.

Tornado Safety
What can you do to keep yourself safe if a tornado approaches? The first step is to have a reliable source of tornado watches and tornado warnings, and make sure to take immediate action if a tornado warning is issued for your area. What actions should you take if a tornado is imminent? I've included some key safety tips below (for more information, I encourage you to check out The National Weather Service tornado safety site [73]):
- If you're inside, go to the lowest level of the building (a basement or underground shelter is ideal), and get under something sturdy (a table, work bench, mattress, etc.) that can provide some protection if the building collapses.
- If you're in a building that has no basement, go to an interior room on the lowest level, and get under something sturdy if possible. An interior bathroom can be a good choice because the metal pipes in the walls can provide some extra strength. Stay away from exterior doors and windows!
- If you're in a large building (like a school, church, or shopping mall), avoid rooms with large ceiling areas (auditoriums, gymnasiums, etc.) because they have a higher chance of collapsing partially or entirely.
- Mobile homes typically do not withstand tornadoes well, so if you're in a mobile home, leave immediately and try to seek shelter in a well-constructed building.
- If you're in a vehicle and the tornado is a good distance away (and traffic allows), the best option might be to just drive away from the tornado. If that's not an option because traffic is too heavy and / or you're too close to the tornado, get out of your vehicle and seek shelter in a building, if possible. If not, try to seek shelter in a ditch or other low spot and protect your head as much as possible. Being in a vehicle in close proximity to a tornado is NOT safe. Vehicles are easily lifted and thrown by stronger tornadoes. Also, do NOT seek shelter under an overpass. Tornadic winds can actually accelerate as they get "funneled" under a bridge.
- Injury or death from flying debris is the greatest risk in any tornado, so if you're stuck outside and have absolutely no recourse for seeking shelter, get as low as you possibly can, cover your head, and hope for the best.
Despite the ferocity of tornadoes, the United States has fewer than 100 tornado-related deaths per year, on average, thanks in part to improved detection and warning in the Doppler radar era. But, the number of tornado-related deaths fluctuates wildly from year-to-year, as this graph of tornado fatalities in the U.S. from 1940 through 2011 [74] shows. Several years have huge spikes in the death toll (more than triple the average) because of particularly vicious tornado outbreaks (like the “Super Outbreak” of 1974 [20] and the “Super Outbreak” of 2011 [75], for example).The unfortunate reality is that, if you're in a building with no basement, and you're forced to remain above ground when an EF-4 or EF-5 tornado srikes, you're at substantial risk of severe injury or death even with accurate and timely tornado warnings. So, outbreaks that involve violent tornadoes still usually come with fatalities simply because not everyone can get underground.
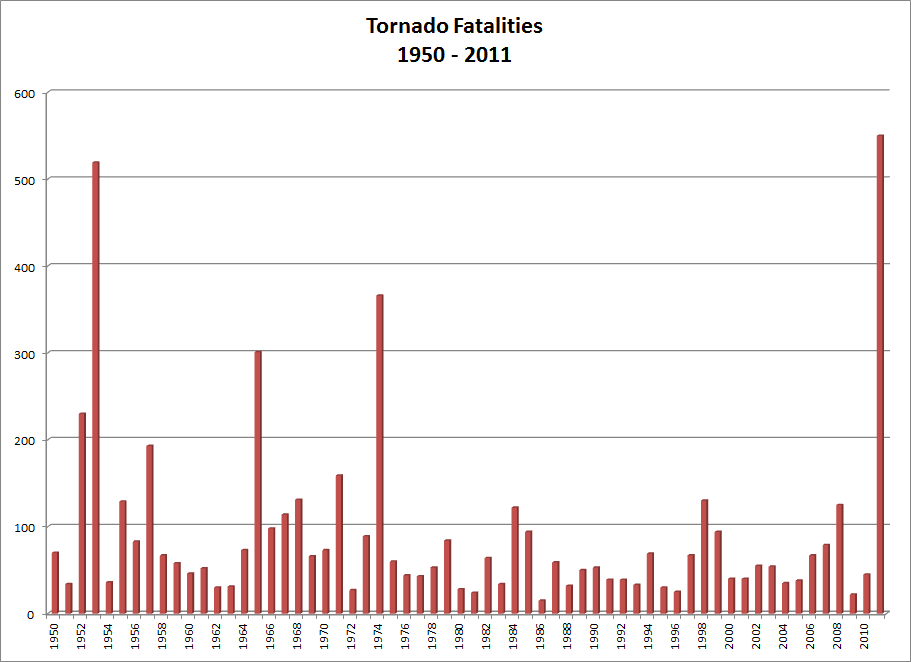

Tornado Myths
We've learned a lot about how tornadoes work in the last few decades (although there's still more to learn). Still, several myths about tornadoes are still common, and most of them stem from an earlier era when tornadoes were more mysterious. Let's break down three myths that still linger:
Myth 1: If a tornado approaches your house, you should quickly open the windows to equalize the pressure between inside your house and outside to prevent the house from exploding.
This myth stems from the idea that pressure decreases dramatically outside a house as a tornado approaches, and that the large pressure-gradient force between the outside and inside of a house could cause it to explode. The idea that pressure decreases outside of a house as a tornado approaches is certainly true, but a massive pressure-gradient force that causes houses to explode never occurs because houses aren't perfectly sealed. They have vents and lots of crevices that allow air to flow in and out of the structure, so a giant pressure gradient never has a chance to develop. The destruction of a house is due entirely to the extreme forces associated with tornadic winds. This security camera footage [76] shows a house being destroyed by an EF-5 tornado in Parkersburg, Iowa in 2008. Winds literally rip the house apart piece by piece. It does not explode.
This myth is particularly dangerous because you certainly don't want to rush around opening windows if a tornado is approaching. Doing so only wastes time that could be spend seeking shelter in a basement or interior room and increases your risk of being hit by flying debris or glass. Stay away from windows!
Myth 2: Tornadoes can skip over one house and completely destroy the next.

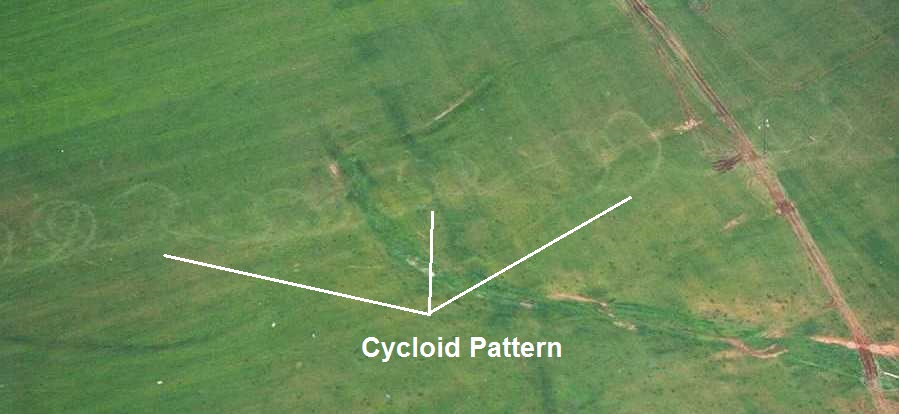
It's true that damage in a tornado's path can be somewhat irregular, so this myth can appear to be true. But, it's not because a tornado skips or hops over one house only to demolish the next. This myth stems from the fact that some tornadoes actually have tiny "suction vortices" that rotate around the main tornado. Such tornadoes are called "multi-vortex" tornadoes and the suction vortices can cause damage in a cycloid pattern (check out the photo on the right) as the tornado moves along. Damage from suction vortices can be tremendous, and given their looping path, it's easy to see how one house might get missed by a tornado, while another takes a direct hit.
Myth 3: Tornadoes don't form in mountainous areas or hit big cities.
It's true that tornadoes are less common in mountainous areas, in large part because mountains and hills can sometimes disrupt favorable air flow into thunderstorms. But, tornadoes can certainly happen in mountainous areas and can travel up and down mountains. In fact, the strongest and longest-tracked tornadoes in Pennsylvania history tracked for miles across the mountainous northwest and north-central parts of the state [78] on May 31, 1985, for example.
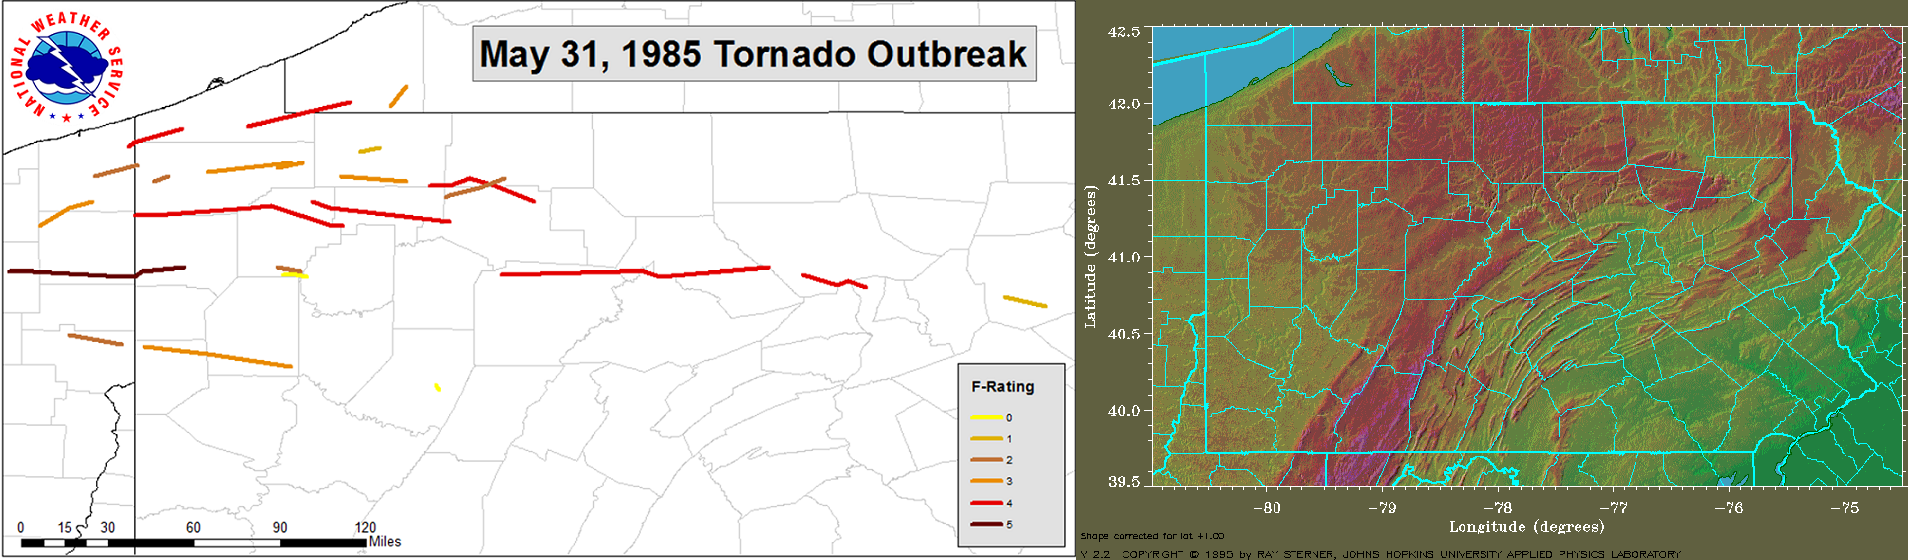
You've already seen that tornadoes can strike big cities (remember the tornado that did damage to the Georgia Dome in Atlanta [64] during a basketball game). Another famous example of a tornado striking a big city occurred on August 11, 1999, when a tornado struck Salt Lake City, Utah [79] (Salt Lake City is also surrounded by mountains, which obviously did nothing to "protect" the city). Other cities that have been hit by tornadoes in the past few decades include Miami, Nashville, and Oklahoma City (just to name a few). Tornadoes hitting cities might seem rare (which is why some people think that cities are immune), but that's only because in the scheme of the entire United States, the area covered by cities is tiny, so a tornado finding a major city is somewhat like finding a needle in a haystack. But, it does happen!
Our entire discussion about tornadoes, so far, has focused on tornadoes spawned by supercells. But, sometimes tornadoes and other whirlwinds form without supercells in the picture. We'll explore those next!
Other Whirlwinds
Prioritize...
After completing this section, you should be able to describe waterspouts and landspouts, dust devils, fire whirls, and gustnadoes, and discuss the dangers they pose.
Read...
While supercells spawn the vast majority of tornadoes, they aren't the cause of all tornadoes. In this section, I'm going to briefly summarize a handful of other whirlwinds, some of which are formally classified as tornadoes and some of which aren't. As you'll see, most of them have some common characteristics, namely that they tend to form in environments with horizontal wind shear [80] (a horizontal change in wind direction or speed) that induces some spin and where the low-level air is very warm and buoyant (to favor vertical stretching of the air column).
Waterspouts and Landspouts
Waterspouts are basically tornadoes over water, and there are essentially two types. The first type is a regular tornado that occurs with a severe (supercell) thunderstorm over the water (these are called "tornadic waterspouts"). The second type of waterspout (usually called a "fair-weather waterspout") forms a bit differently. They're called "fair-weather" waterspouts because they typically form beneath cumulus or cumulus congestus clouds (not full-blown thunderstorm clouds). Fair-weather waterspouts often owe their development to uneven heating of land and water surfaces, because uneven heating results in boundaries where low-level air converges, and the edges of such boundaries can be areas ripe for creating low-level spin [81].
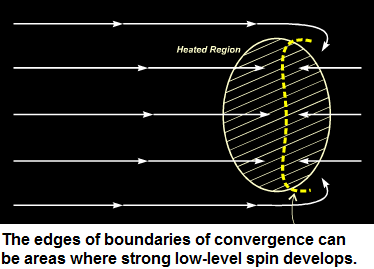
Fair-weather waterspouts tend to form in humid air masses over very warm water. When the environment becomes very unstable, and a circulation develops along any boundary of low-level convergence, the strong positive buoyancy of air parcels can lead to vertical stretching and the development of a waterspout from the ground up. Because of the importance of warm water, the shallow waters near the Florida Keys are a prime area for waterspouts (hundreds of waterspouts form per year in this area), with the peak months being August and September because that's when the waters are warmest. Waterspouts can also form on smaller bodies of water, like the Great Lakes, when cool air masses flow over the relatively warm lake waters in late summer and early fall. The photograph below, for example, shows a family of four waterspouts that formed on Lake Huron on September 9, 1999.

Fair-weather waterspouts can be visually stunning [82] (credit: NOAA Library), but the winds in fair-weather waterspouts typically don't exceed about 70 miles per hour (on par with an EF-0 tornado). Still, such waterspouts are a hazard to boaters. Indeed, fair-weather waterspouts can capsize boats, so boaters should keep their distance from waterspouts (or perhaps refrain from going out on the water if waterspouts are likely). Waterspouts can also occasionally come onshore and cause minor damage (although there's greater potential for damage if a tornadic waterspout that forms from a supercell moves onshore).
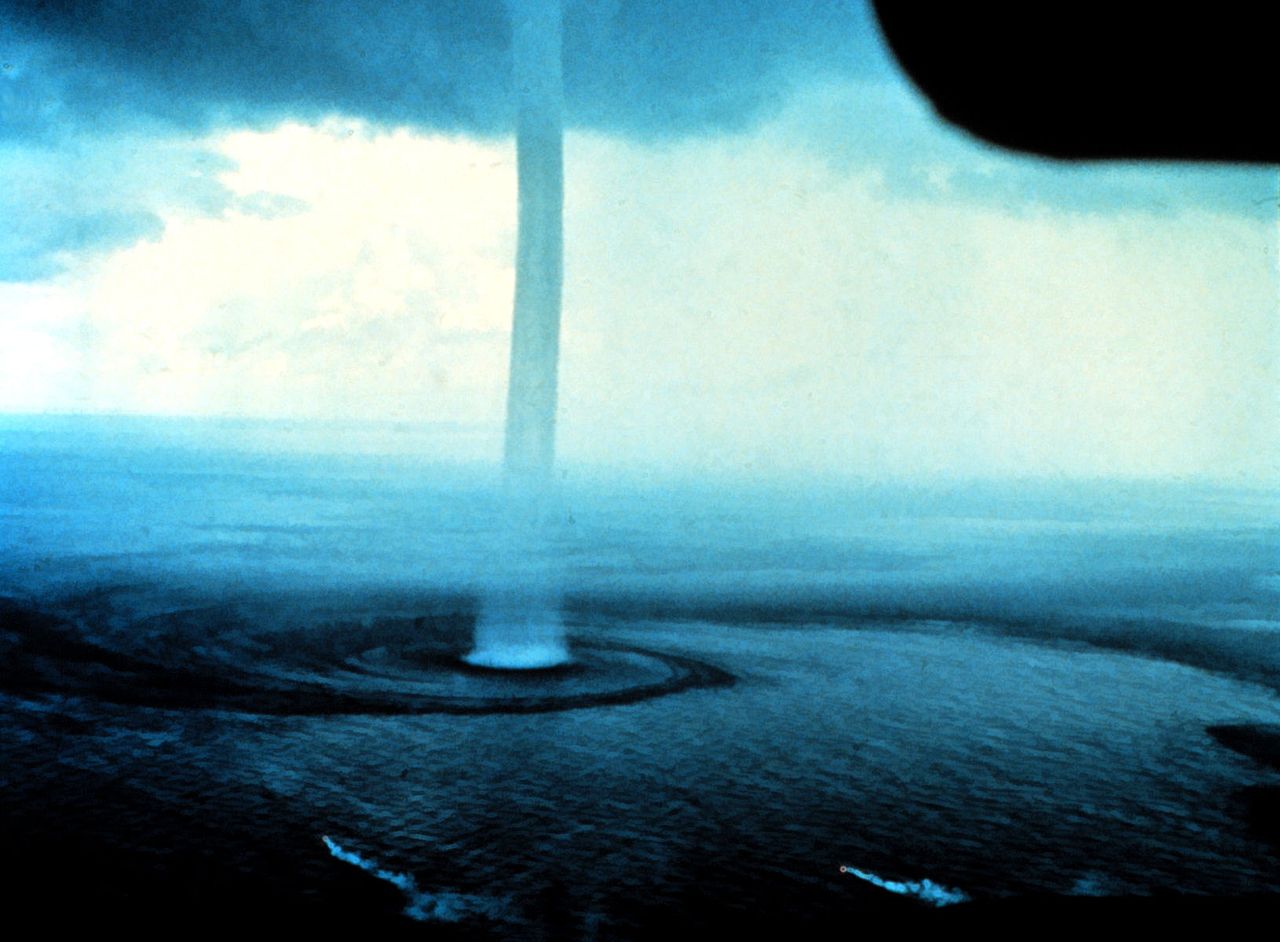
I should also add that waterspouts have a continental cousin, called a landspout. Landspouts form in a similar fashion to waterspouts. First, a low-level circulation forms along a boundary of converging air before any deep convective clouds develop. Second, a growing cumulus cloud sprouts over the pre-existing spin and the circulation builds upward in concert with buoyant, rising air. The associated vertical stretching of the air column then paves the way for a tornado (landspout) to form. A zone just east of Denver, Colorado is naturally ripe for landspout formation because air flowing over the local rugged terrain can lead to the low-level convergence and circulation needed for landspout formation. The frequency of landspouts in eastern Colorado is evident on the map showing the average number of tornado days per year from 2003 - 2012 [83]. Note that the area with three to four tornado days per year in eastern Colorado has more tornado days per year (on average) than most of tornado alley, and it's largely because of landspouts!
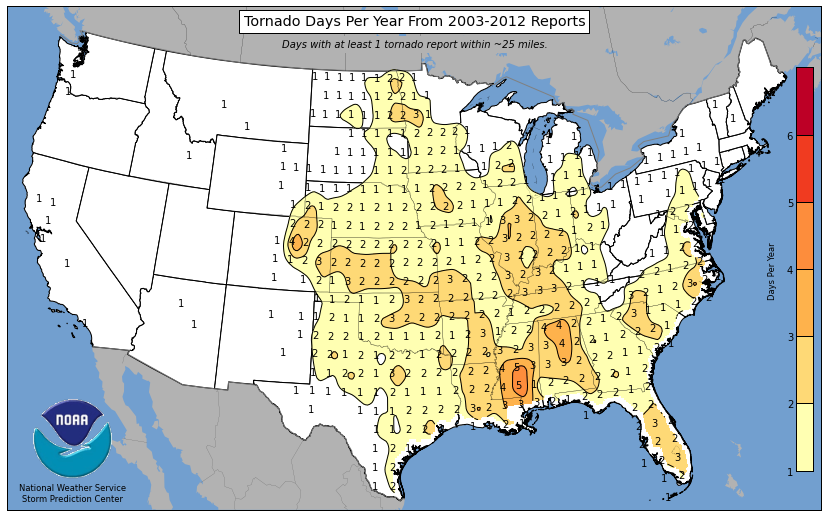
Dust Devils
A dust devil is a rotating column of air near the ground that kicks up lots of dust and dirt. Dust devils are not formally classified as tornadoes because they do not connect to a cloud base, although intense dust devils can look kind of like tornadoes from the ground, as evidenced by this amazing video of a dust devil invading a soccer game in Bolivia in 2021 [84]. Dust devils are short-lived (lasting a few minutes or less), and are usually harmless (although I'm not sure I'd run through one like the kids in the video). Dust devils only rarely cause minor damage, as their peak winds speeds are usually less than 50 miles per hour, but on rare occasion they can reach the intensity of an EF-0 tornado.
Dust devils form on hot, sunny days over dry landscapes. Solar heating promotes strong positive buoyancy and rising currents or air near the ground, and the wind's interaction with terrain (hills or mountains), or even buildings or moving vehicles can impart some spin on the air. If you've ever seen a whirl of leaves kick up [85] as the wind blows past the corner of a building, you've seen the mechanism that can help create a dust devil. Since they're so small and short-lived, dust devils can rotate either clockwise or counterclockwise in the Northern Hemisphere, depending on the direction of the spin induced by horizontal wind shear (the Coriolis Force does not have a noticeable effect). That's in contrast to real tornadoes; almost all real tornadoes rotate counterclockwise in the Northern Hemisphere (but there are a few rogue ones that rotate clockwise).

I should also note that dust devils aren't purely an earthly phenomenon. Indeed, the Curiosity Mars Rover has captured dust devils traversing the Martian landscape, like the one captured above on February 1, 2017. To my knowledge, there is no footage of Martian children running through a dust devil, however. :-)
Fire Whirls

A fire whirl is essentially a tornado of fire that can form in a wildfire. Fire whirls form because of temperature contrasts between the fire itself and its cooler surroundings (which haven't been burned yet). The resulting temperature gradients can be very large and create large pressure gradients, complete with small areas of low pressure that form over the hottest spots in the fire. In response, air swirls in and blows strongly around the wildfire, which can actually cause the fire to spread by increasing its oxygen supply, fanning the flames, and tossing burning embers around. If updrafts of rising air are strong enough within the hot fire as air swirls inward, a tornado of fire can spin up (check out the photo on the right). Fire whirls are very dangerous to firefighters and make the fire more difficult to battle.
Gustnadoes
Sometimes along gust fronts, small, transient whirlwinds, called gustnadoes (a mash-up of gust front and tornadoes), can spin up. Storm chasers typically detect gustnadoes when they kick up dust in open areas [87] (credit: Rick McCoy via the National Weather Service). Even though they can cause damage (the gustnado in the linked photograph knocked down several trees and broke a car window in Van Wert, Ohio on June 6, 2008), meteorologists do not classify gustnadoes as tornadoes because gustnadoes do not connect to a cloud base, and they are typically so short-lived that there would be little benefit in the National Weather Service issuing tornado warnings. If we considered gustnadoes to be true tornadoes, virtually all supercells would then be tornadic because gustnadoes almost always spin up along their gust fronts. Thus, forecasters would have to issue tornado warnings for practically every supercell that erupts, even though the gustnadoes it spawns would come and go in very short periods of time (likely before people could act on a warning) and sometimes cause little, if any, damage.
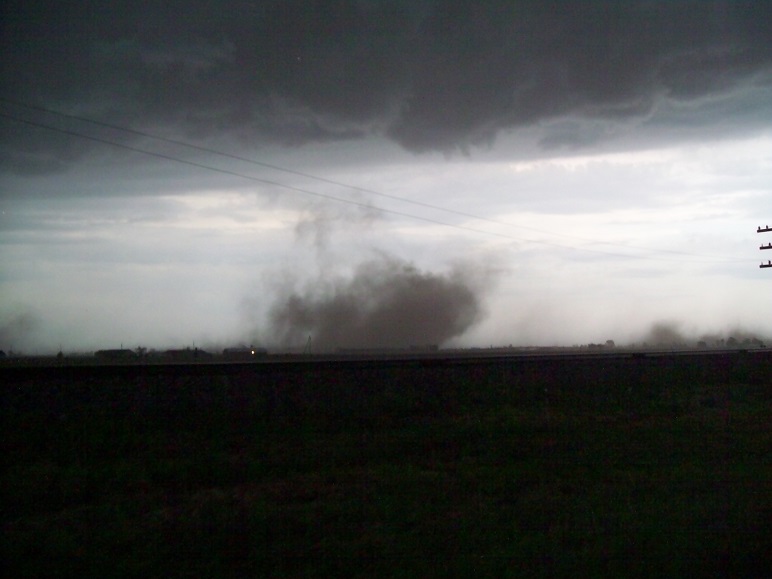
There's no doubt that the weather hazards associated with thunderstorms are numerous. From flash floods, to hail, to a variety of wind-related hazards, it's important to be on your toes when severe thunderstorms are in the forecast! I hope the information in this lesson helps you be more aware of the risks of severe weather and can help you prepare and stay safe should you encounter severe weather in the future.