Lesson 12: Hurricanes
Motivate...

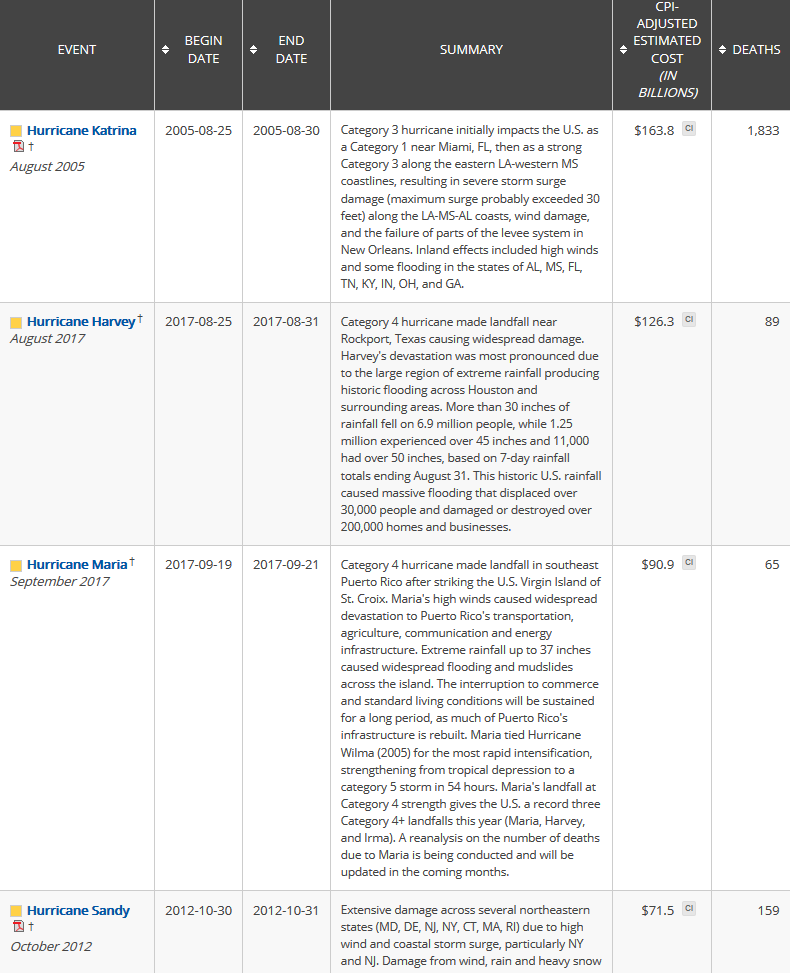
The mid-latitude cyclones (low-pressure systems) that you learned about previously can certainly bring fierce weather, ranging from raging snowstorms to outbreaks of severe thunderstorms with damaging winds, hail, or tornadoes. But the "kings" of all low-pressure systems are hurricanes, which are strong low-pressure systems that form in the tropics or subtropics. But, such "tropical cyclones" (the generic name for intense low-pressure systems like hurricanes that form in the tropics) are quite a bit different than mid-latitude cyclones, not only meteorologically, but also in terms of impacts. Indeed, the list of costliest U.S. weather disasters from 1980 through 2017 [1] is dominated by hurricanes.
The names of hurricanes that populate the top of the list of costliest U.S. weather disasters may be familiar to you -- Katrina (2005), Harvey (2017), Maria (2017), and Sandy (2012) are just a handful of headline-making, devastating storms that have impacted the United States in recent years. But, hurricanes don't just impact the United States. These storms, which go by other names around the globe like "typhoon" or "severe cyclonic storm," roam several ocean basins and threaten countries around the world. In fact, the deadliest tropical cyclone on record occurred in 1970 in Bangladesh. This "Great Bhola Cyclone" killed somewhere between 300,000 and 500,000 people.
There's no doubting the dangers and immense power of hurricanes and other strong tropical cyclones. Although very strong winds often take top headlines when a hurricane approaches land, a hurricane's most dangerous weapon is water, in the form of flooding along coasts and inland from heavy rain. Thanks to modern technology, and the ability to record and broadcast video with just a cell phone, dramatic footage from hurricane landfalls has flooded the Internet in recent years. The ferocity that the core of a hurricane can bring is on full display in this video of Super Typhoon Haiyan (2013) making landfall in the Philippines [2] and this video of Hurricane Katrina (2005) making landfall in Gulfport, Mississippi [3] (this video, in particular, shows the dangers from water). And, yes, if you watched the videos, "hurricane chasing" is a real thing that a handful of (possibly crazy) people do. It's certainly not something I recommend!
Meteorologists work hard to give the public as much advance notice as possible about the dangers that hurricanes may bring, and have greatly improved the quality of hurricane forecasts in recent decades (although there's still room for improvement). As a prime example, at 10:11 A.M. on August 28, 2005 (24 hours before Hurricane Katrina made landfall), the National Weather Service (NWS) office in New Orleans issued this chilling public bulletin [4] which describes in graphic detail the conditions that would likely occur as the storm came ashore. This bulletin marked a watershed moment in NWS history, in that no public bulletin had ever been so explicit in describing the danger faced by those choosing not to evacuate. In hindsight, it was an ominous foreshadowing of what was to come. Unfortunately for those who didn't or couldn't evacuate ahead of time, by the time the storm rolled in, it was too late.
In this lesson, we're going to learn all about tropical cyclones, including the basics of tropical cyclone climatology, naming conventions, the ingredients needed for a tropical cyclone to form and strengthen, the vertical structure of a mature hurricane, and hazards associated with tropical cyclone landfalls. There's a lot of action-packed material to cover, so let's get started!
Classifying Tropical Cyclones
Prioritize...
When you've finished this section, you should be able to discuss classification schemes for tropical cyclones, including associating the proper criteria and thresholds for the terms hurricane, tropical storm, tropical depression, typhoon, and super typhoon. You should also able to describe the Saffir-Simpson scale and define the term subtropical cyclone.
Read...
Although I imagine most everyone is familiar with the term "hurricane", before we study the nuts and bolts of these storms, we've got to cover some terminology that helps scientists (and the public) classify tropical cyclones. After all, not all tropical cyclones are hurricanes! For starters, formally, a tropical cyclone is the generic name given to low-pressure systems that form over warm tropical or subtropical seas.
As I mentioned previously, tropical cyclones are meteorologically different than the mid-latitude cyclones (also called "extratropical cyclones") that you learned about earlier. For starters, tropical cyclones have a "warm core," meaning that temperatures throughout most of the troposphere are higher at the center of a tropical cyclone compared to its surroundings. Mid-latitude cyclones, on the other hand, are "cold core." Another big difference is that mid-latitude cyclones rely on the presence of large temperature gradients to strengthen (mid-latitude cyclones are associated with fronts). Tropical cyclones, conversely, usually form in environments with small temperature gradients (in other words, environments without fronts).
Instead of relying on large temperature gradients, organized thunderstorms around the center of a tropical cyclone are key to its livelihood (for reasons we'll investigate later in the lesson). Mid-latitude cyclones, on the other hand, often have thunderstorms well displaced from their centers (if they have any thunderstorms associated with them at all). This difference leads well-developed tropical cyclones and mid-latitude cyclones to appear very differently on satellite imagery. For example, check out this color-enhanced water vapor loop from July 9, 2018 [5]. The loop shows two cyclones marked by distinct counterclockwise swirls. The cyclone closer to the U.S. coast a tropical cyclone (Tropical Storm Chris), which has lots of tall, thunderstorm clouds near its center. The cyclone farther northeast is a mid-latitude cyclone, which lacks thunderstorms near its center. The side-by-side visible satellite images below also highlight the visual contrasts between tropical and mid-latitude cyclones. On the left, a large mid-latitude cyclone centered near Lake Michigan demonstrated a familiar comma shape on May 11, 2003, thanks to the conveyor-belts and fronts that you learned about previously. On the right, however, Hurricane Rita lacks the comma shape of a mid-latitude cyclone, and has thick, tall thunderstorm clouds surrounding its center.

The visual differences between mid-latitude and tropical cyclones provide a clue that they operate a bit differently, and we'll see how as the lesson unfolds. But, first, let's break down the types of tropical cyclones to see how meteorologists classify and keep track of them. For starters, forecasters often have their eyes on clusters of showers and thunderstorms across the tropics (often called "tropical disturbances"). Tropical disturbances do not have closed circulations and are not formally tropical cyclones; however, by convention in the U.S., tropical disturbances that have the potential to develop into tropical cyclones are dubbed "invests." But, if a tropical disturbance with organized thunderstorms develops a closed circulation around its surface center of low pressure (counterclockwise in the Northern Hemisphere; clockwise in the Southern Hemisphere), a tropical cyclone is born! Meteorologists then use the following labels to classify the cyclone:
- Tropical Depression: a tropical cyclone with maximum sustained wind speeds less than 34 knots (39 miles per hour). "Sustained" is a key word there because definitions of what a "sustained" wind is vary across the globe (it could mean anywhere from a 1-minute average wind speed to a 10-minute average wind speed). So, classifications of tropical cyclones can vary across the globe based on different definitions of "sustained." Also note that to be classified as a tropical depression, a tropical disturbance must develop a closed surface circulation, organized thunderstorms, and wind speeds less than 34 knots (39 miles per hour).
- Tropical Storm: a tropical cyclone with maximum sustained wind speeds of at least 34 knots (39 miles per hour). When a tropical storm is identified, it formally receives a name (we'll talk more about naming conventions later in the lesson). Tropical cyclones retain their tropical storm status as long as their maximum sustained winds remain between 34 knots and 63 knots.
- Hurricane: a tropical cyclone with maximum sustained winds of at least 64 knots (74 miles per hour).
Typically, a developing tropical cyclone will evolve from a tropical depression to a tropical storm before becoming a hurricane (if conditions are favorable for strengthening). It's important to note that tropical cyclones are classified by their maximum sustained wind speed (an average wind over a length of time ranging from 1 to 10 minutes, depending on the region of the globe). They are not classified by maximum wind gusts (short bursts of wind lasting a few seconds). The most intense tropical cyclones are called hurricanes, but they only go by that name in some parts of the world (including the United States). Indeed, in other parts of the world, tropical cyclones go by other names. For example, in the Northwest Pacific Ocean, forecasters use the word typhoon instead of hurricane. In parts of the Indian Ocean, such storms are called "severe cyclonic storms," while in other parts of the Indian Ocean, they're called "severe tropical cyclones." So, don't be confused when you hear a terms like typhoon, severe cyclonic storm, or severe tropical cyclone. They all describe storms that are the same as hurricanes (tropical cyclones with maximum sustained winds of at least 64 knots).
At times, I may generically refer to "hurricanes," but keep in mind that such references also include strong tropical cyclones that go by various labels in ocean basins around the world. Of course, all "strong" tropical cyclones (hurricanes, typhoons, etc.) are not created equal. Some are much more intense than others. In the Atlantic and Northeast Pacific basins, forecasters use the Saffir-Simpson Hurricane Wind Scale to further classify a given hurricane. Hurricanes classified as Category 3, Category 4, or Category 5 (all hurricanes with maximum sustained winds of at least 96 knots, or 111 mph) qualify as major hurricanes.
| Category | Maximum Sustained Wind | Description |
|---|---|---|
| 1 | 64-82 knots (74-95 mph) | Minor wind damage (to roofs, shingles, siding, gutters, large tree branches, etc.). Damage to power lines and poles may result in power outages that could last several days. |
| 2 | 83-95 knots (96-110 mph) | Extensive wind damage (major roof and siding damage, shallow-rooted trees snapped or uprooted). Power outages may last several days to weeks. |
| 3 | 96-112 knots (111-129 mph) | Devastating wind damage (major damage to, or complete loss of roofs, many trees snapped or uprooted). Electricity and water likely unavailable for several days to weeks. |
| 4 | 113-136 knots (130-156 mph) | Catastrophic wind damage (complete loss of roofs and major damage to exterior walls of some homes, most trees snapped or uprooted and power poles downed). Power outages may last weeks or months, making hardest-hit areas uninhabitable. |
| 5 | 137+ knots (157+ mph) | Catastrophic wind damage (a high percentage of framed homes destroyed, residential areas isolated by fallen trees and power poles). Power outages will last for weeks or months, making hardest-hit areas uninhabitable. |

Although major hurricanes make up only 21 percent of the hurricanes that hit the United States, these fierce storms account for over 83 percent of all the damage from landfalling hurricanes. Other ocean basins also have different descriptors for extremely intense tropical cyclones. In the Northwest Pacific Basin, for example, the particularly descriptive classification of "super typhoon" is used once a typhoon's maximum sustained wind speed reaches at least 130 knots (more than twice the minimum wind-speed criteria for a typhoon). Super typhoons are the equivalent of a at least a high-end Category 4 hurricane on the Saffir-Simpson Scale.
Like the basic classification scheme for tropical cyclones (tropical depression, tropical storm, hurricane), the categories of the Saffir-Simpson Scale and other descriptors like "major hurricane" and "super typhoon" are all based on the maximum sustained wind speed within the storm. These winds are usually confined to a relatively small area of the storm somewhere near the center, so the types of wind damage described by, say, a Category 3 hurricane on the Saffir-Simpson Scale, typically occur only in areas that take a "direct hit" from the storm (the center passes nearby). Areas farther from the center may also experience wind damage, but it's typically less severe than what's described by the storm's Saffir-Simpson rating. Winds, however, are only one hazard posed by tropical cyclones. Indeed, a tropical cyclone need not even reach hurricane status to cause devastating effects (flooding in southeast Texas from Tropical Storm Allison in 2001 [6] is a prime example). So, just because a tropical cyclone doesn't have strong enough winds to be a hurricane doesn't mean it can't be catastrophic!
You also may have heard of another storm classification, called a subtropical cyclone, which is a "hybrid storm" of sorts. A subtropical cyclone has characteristics of both tropical cyclones and mid-latitude cyclones, meaning that it may have a warm core through a small part of the troposphere only while being embedded in a region of large temperature gradients. So, you may hear meteorologists use the terms "subtropical depression" or "subtropical storm" to describe these hybrids. Such classifications help meteorologists diagnose a storm's structure and keep historical records, but most people might not notice a difference in impacts between, say, a subtropical depression and a tropical depression (their weather impacts would be similar). In case you're wondering, subtropical cyclones can transition into tropical cyclones if they can fully develop a warm core and organized thunderstorms around their center, and exit regions of large temperature gradients.
Now that we've covered some basic terms and classifications, we're going to talk about the climatology of tropical cyclones. In particular, we'll focus on where, when, and why they tend to form around the world. Read on.
Tropical Cyclone Climatology
Prioritize...
When you've completed this section, you should be able to describe where tropical cyclones do (and don't) form globally, and the primary reason why. You should also be able to identify the most active tropical basins and describe the "seasons" (when tropical cyclones are most likely to form) in the North Atlantic, Northeast Pacific, and Northwest Pacific Basins.
Read...
Although we generically defined tropical cyclones as low-pressure systems that form over warm tropical seas, do they just form anywhere in the tropics? Not really. As you can see from the image below, the breeding grounds and regions where tropical cyclones typically track can be boiled down to seven areas:
- Atlantic Basin (the northern Atlantic Ocean, the Gulf of Mexico, and the Caribbean Sea)
- Northeast Pacific Basin (from Mexico to the International Dateline)
- Northwest Pacific Basin (from the International Dateline to Asia, including the South China Sea)
- North Indian Basin (includes the Bay of Bengal and the Arabian Sea)
- Southwest Indian Basin (from Africa to about 100 degrees east longitude)
- Southeast Indian/Australian Basin (100 degrees east longitude to 142 degrees east longitude)
- Australian/Southwest Pacific Basin (142 degrees longitude to about 120 degrees west longitude)

Of these seven areas, the Northwest Pacific and Northeast Pacific basins tend to be the busiest, as this frequency plot for tropical cyclones [7] suggests. It shows the average number of occurrences (from 1972 to 2001) that the center of a tropical cyclone occupied an area with dimensions of one degree latitude by one degree longitude. The dark red color indicates the highest average of such occurrences, and thus marks the core of these breeding basins for tropical cyclones. Meanwhile, some areas in the tropics are nearly entirely free of tropical cyclones. While tropical cyclones can form outside of the seven areas listed above, it happens relatively infrequently. For example, the southern Atlantic Ocean (south of the equator) is rarely home to tropical cyclones. Note also that tropical cyclones do not form near the equator, for reasons that we'll discuss later in the lesson.
Why do tropical cyclones typically form in these areas and not elsewhere in the tropics? Well, for starters, tropical cyclones are driven by thunderstorms which require warm, moist air to flourish. Sufficiently warm, moist air is most often found where ocean waters are warm, having sea-surface temperatures of at least 26.5 degrees Celsius, or about 80 degrees Fahrenheit. Other factors are required for tropical cyclone development, too, and these ingredients most commonly come together with warm ocean waters in the seven areas described above.
Although we'll soon cover all of the ingredients needed for tropical cyclones, their reliance on warm ocean waters explains quite a bit about where and when tropical cyclones form. The image below shows the running tally of the average number of named storms, hurricanes, and major hurricanes over the North Atlantic. Although "official" hurricane season runs from June 1 to November 30, tropical systems have been observed during "non-official" months. So there is nothing magical about the start and end dates of the Atlantic hurricane season. Still, the official hurricane season historically captures 97% of all tropical cyclone activity in the Atlantic, so "official" carries some weight in this situation.

Why do the vast majority of tropical cyclones form between June and November in the Atlantic? One big reason is that's the time of year when large expanses of the ocean are favorably warm for fueling tropical thunderstorms, which can develop into tropical cyclones. When we look at long-term average sea-surface temperatures in the North Atlantic Ocean from June to November [8], we see a broad corridor of surface water with temperatures of at least 26.5 degrees Celsius extending from the western coast of Africa across the tropical and subtropical Atlantic. And, if you refer back to the figure showing typical breeding grounds for tropical cyclones [9], you'll see that this warm swath of water lines up pretty well with the common area for tropical cyclone activity in the North Atlantic basin.
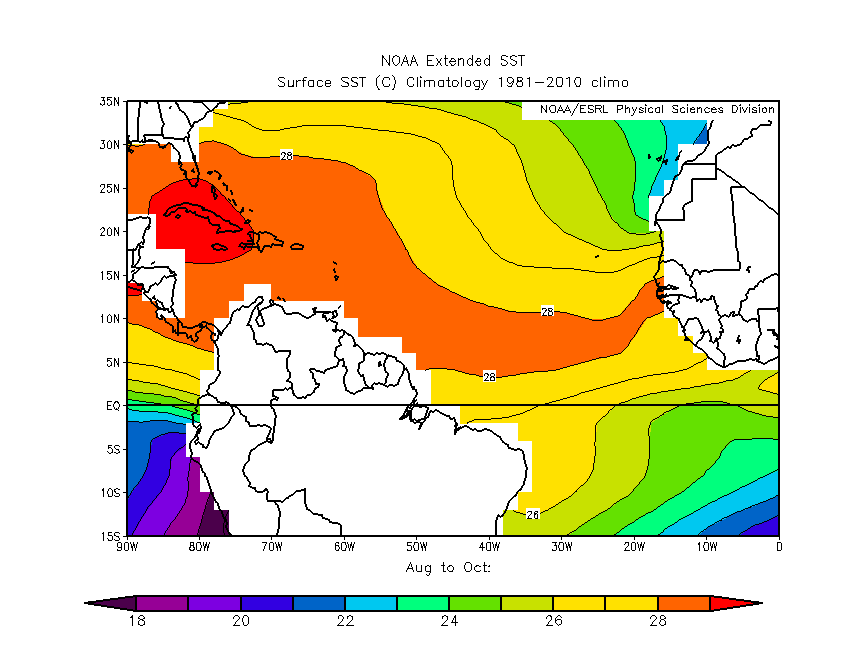
The running tally of the average number of storms during a typical Atlantic hurricane season (above) also indicates that there is a fairly sharp increase in named storms between August and October. Some forecasters refer to this as the "real" hurricane season within the official hurricane season because, historically, August-October contains 78 percent of the days when at least one tropical storm was observed over the Atlantic basin (sometimes referred to as "tropical-storm days"). Moreover, this period contains 87 percent of the "hurricane days" and 96 percent of the "major-hurricane days". Not surprisingly, higher sea-surface temperatures [10] prevail over a larger area during this highly active period.
Statistically, the most active time in the North Atlantic Basin is early to mid-September. To drive home my point, check this plot showing the daily occurrence of tropical storms, minor hurricanes (Category 1 or 2), and intense (major) hurricanes [11] using data spanning from 1886 to 1991. Not surprisingly, early to mid-September corresponds to the time when ocean temperatures peak. The climatological spike in sea-surface temperatures also helps explain why September has the highest probability of major hurricanes developing over the tropical Atlantic. Of course, I should remind you that about three percent of the tropical cyclone activity in the North Atlantic occurs outside of hurricane season, and tropical cyclones have been observed in the Atlantic basin in every month of the year, with January through April being the least active.
Needless to say, sea-surface temperatures govern hurricane seasons in the other basins, as well. In the eastern North Pacific [12], hurricane season runs from May 15 to November 30. This basin gets off to a faster start than the North Atlantic, owing largely to the pool of warmer water along the west coast of Central America (check out the long-term means of sea-surface temperatures from May 15 to May 31 [13]), and really ramps up from July through October.
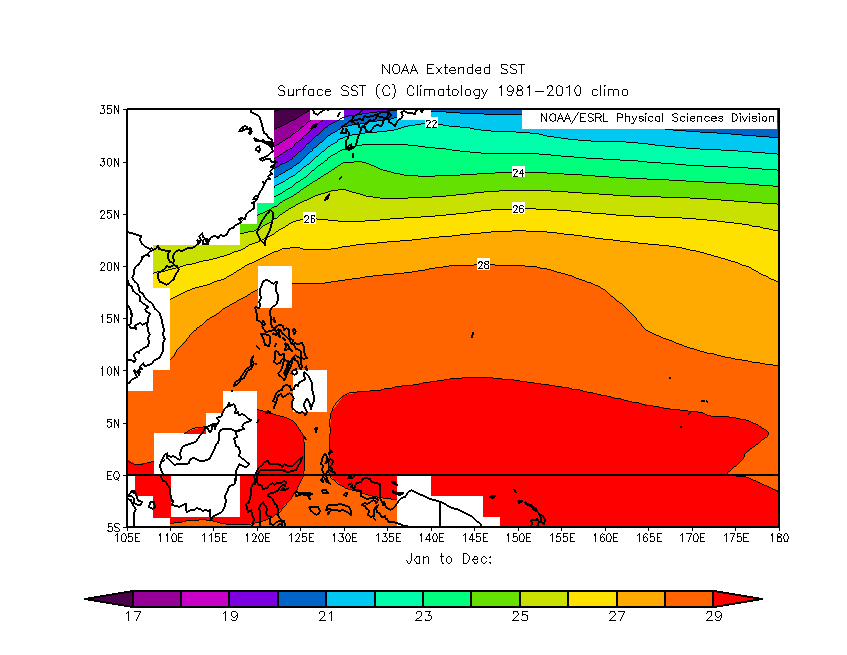
The Northwest Pacific basin is unlike other tropical basins in that it "never sleeps." Its tropical cyclone season spans the entire year, which makes sense since annual sea-surface temperature averages [14] clearly support year-round activity. The Northwest Pacific is the most active basin in the world, with an annual average of more than 30 named storms (see image below).

The Northwest Pacific does tend to be less active during the first half of the year, with the greatest flurry of activity occurring between mid-July and mid-October, on average (when sea-surface temperatures are even higher). So, even though the season technically spans the entire year, most of the activity occurs from July through October, with a peak in August and September.
I won't go into the detailed climatologies of the other tropical basins because I hope you get the basic idea by now. The bottom line is that the climatological statistics clearly show the link between high sea-surface temperatures and the development of tropical cyclones. However, I do want to emphasize the point that high sea-surface temperatures are necessary, but not sufficient by themselves, to guarantee the development of tropical cyclones. Other ingredients must be present in order to create a tropical cyclone (which we'll cover shortly).
Ultimately, between 80 and 90 named tropical cyclones (meaning at least tropical-storm strength) form across the globe, on average, each year. Of these, about 60 percent become hurricanes, on average. But, why exactly do tropical storms and hurricanes receive names in the first place? We'll investigate up next.
What's in a Name?
Prioritize...
When you've completed this page, you should be able to describe how tropical cyclones are named in the Atlantic and Northeast Pacific Basins, and use a storm's name to draw conclusions about how many named storms have occurred in a given season.
Read...
Katrina. Sandy. Harvey. Irma. Maria, Michael. Do any of these names ring a bell? They're all names of devastating hurricanes that have ravaged parts of the United States since 2005. The names of impactful tropical cyclones often become forever linked to the death and destruction that a storm causes, and for some folks, these names may conjure up memories of personal hardships.
It turns out that the convention for naming tropical cyclones has quite a long (and in some cases, humorous) history, and each ocean basin has its own unique history of naming tropical cyclones. In the Atlantic, the earliest practice of naming Atlantic hurricanes goes back a few hundred years to the West Indies [15]. Indeed, islanders named hurricanes after saints (when hurricanes arrived on a saint's day, locals christened the storm with the name of that saint). For example, fierce Hurricane Santa Ana struck Puerto Rico on July 26, 1825, and Hurricane San Felipe (the first) and Hurricane San Felipe (the second) hit Puerto Rico on September 13, 1876 and September 13, 1928, respectively.
During World War II, Navy and Army Corp forecasters informally named Pacific storms after their girlfriends or wives (who may not have been happy if they had known). That apparently started the ball rolling in the United States. From 1950 to 1952, meteorologists named tropical cyclones in the North Atlantic Ocean according to the phonetic alphabet (Able, Baker, Charlie, etc.). Then, in 1953, the U.S. Weather Bureau switched the list to female names. In 1979, the World Meteorological Organization and the National Weather Service (NWS) amended their lists to also include male names.
Conventions developed differently in other parts of the world. For example, an Australian forecaster named Clement Wragge began to name tropical cyclones after politicians he disliked just before the start of the nineteenth century. Forecasters in the Australian and South Pacific regions (east of longitude 90 degrees East, and south of the equator) formally started to christen tropical storms with female names in 1964. They beat the United States to the punch and began to use both male and female names in the mid 1970s.
Despite the checkerboard history behind the naming of tropical cyclones in the various basins around the world, the reason why tropical cyclones get named is pretty straightforward. The practice of naming tropical cyclones ensures clear, unambiguous communication between forecasters and the general public when forecasts, watches, and warnings are issued. At any given time across the globe (or even within a single tropical basin) there can be multiple tropical cyclones present at any one time. For example, the satellite image from September 2, 2008 (below) shows a whopping four named storms present in the Atlantic Basin!

Without the practice of naming tropical storms, deciphering forecasts with four active storms in the basin could have been a real mess -- sifting through coordinates or other technical descriptions of a storm's location. In the end, using names is much simpler for the general public, so let's get to the business of how storms are named. For starters, before reaching tropical-storm intensity, a tropical depression in the Atlantic or Northeast Pacific simply gets assigned a number in chronological order (so the first tropical depression in a season is known as "Tropical Depression 1," the second is known as "Tropical Depression 2," etc.). For storms that reach tropical-storm intensity in the Atlantic and Northeast Pacific, the World Meteorological Organization and National Weather Service (NWS) have used lists of alternating male and female names in alphabetical order to christen storms since 1979. Here are the lists currently in use [16]. Note that each basin has six alphabetized lists of names, which get reused (so the list of names for 2023 was previously used in 2017, for example).
The exception is when a particular tropical storm or hurricane is especially damaging or deadly. Such storms have their names retired from the list, never to be used again. When a name gets retired, the World Meteorological Organization chooses a new name as a replacement. For example, the names Harvey, Irma, Maria, and Nate from the 2017 list were retired and replaced with Harold, Idalia, Margot, and Nigel (respectively) for the 2023 season. It's fairly typical for a couple of names to get retired each year. The four name retirements from the 2017 Atlantic Hurricane season is a lot for a single year, and is a testament to the destructiveness of the season.
So, each year, the first tropical storm gets a name starting with "A," then the second tropical storm gets a name starting with "B", the third gets a name starting with "C", and so on (although the letters Q, U, X, Y, and Z are skipped). I should point out that any year that the alphabetical list of male and female names is not long enough to accommodate all the named storms in a season, the National Hurricane Center turns to a supplemental list of names [16]; however, prior to 2021, the standard was to use letters of the Greek Alphabet (Alpha, Beta, Gamma, Delta, etc.) to name storms once the original list of names had been exhausted. Use of the Greek Alphabet to name storms only occurred twice (2005 and 2020).
The name game is a bit more complicated in other ocean basins. In the Northwest Pacific, for example, since the year 2000, the World Meteorological Organization has used names which are, for the most part, not male or female names. Instead, most names on the list refer to flowers, animals, birds, trees, or even foods, etc. Others are simply descriptive adjectives. Each name on the list is contributed by a participating nation within the basin. The names are not used in alphabetical order like in the Atlantic and Eastern Pacific, however. Instead, the contributing nations are listed in alphabetical order and this ranking determines the order that the names are assigned.

It's important to note, however, that the established lists from the World Meteorological Organization are not universally used for storms in the Northwest Pacific. The Philippine Atmospheric, Geophysical and Astronomical Services Administration (PAGASA) assigns Filipino words as storm names when storms threaten the Philippines so that locals can easily remember them and communicate about the storm. For example, in November 2013 Super Typhoon Haiyan [17] made landfall in the Philippines as one of the strongest tropical cyclones on record at the time of landfall. But, in the Philippines, Haiyan (which is from the Chinese for "petrel" -- a type of seabird) was known as "Yolanda." So, tropical cyclones in the Northwest Pacific basin can actually have two valid names at once.
If you want to see the lists of names for tropical cyclones in all tropical basins (including the North Indian Ocean and other basins not covered here), check out the World Meteorological Organization's page of tropical cyclone names [18]. While the naming conventions can get a bit complicated in some basins, they're pretty straightforward in the Atlantic and Northeast Pacific basins. Make sure to remember the key points below about the naming conventions in these basins.
Key Points
In the Atlantic and Northeast Pacific Basins...
- tropical cyclones receive a name when they attain tropical-storm intensity (sustained winds of 34 to 63 knots, or 39 to 73 miles per hour)
- names are assigned in alphabetical order from a list of alternating male and female names (the first tropical storm of the season gets the "A" name, the second gets the "B" name, and so on)
- if the season is so active that the alphabetical list of male and female names isn't long enough, forecasters use a supplemental list of names (although they used the Greek Alphabet prior to 2021)
- names of particularly damaging or deadly storms get retired, never to be used again. The World Meteorological Organization replaces retired names on the list
Now that we've covered what tropical cyclones are, where, when, and why they form, and how they get named, let's start looking at just how they develop. What ingredients are needed for tropical cyclone development? We'll start answering that question in the next section. Read on.
Tropical Cyclone Ingredients: Part I
Prioritize...
Upon completion of this section, you should be able to identify the first three ingredients listed for tropical cyclone formation (typical sea-surface temperatures, location at least five degrees latitude away from the equator, and a pre-existing disturbance with favorable low-level spin and convergence), as well as be able to discuss how and why these ingredients are important for tropical cyclone formation and / or maintenance. Furthermore, you should be able to identify common sources of seedling tropical disturbances that can develop into tropical cyclones.
Read...
Any chef knows that having the right ingredients is critical for cooking a delicious meal. Have you ever tried to cook something when you were missing necessary ingredients? It's pretty hard (or perhaps impossible)! The tropical atmosphere is no different: "cooking up" a tropical cyclone requires the right ingredients. So, just what ingredients are required for a tropical cyclone to form and thrive? Check out the list below:
Tropical Cyclone Ingredients
The six basic ingredients for tropical cyclone formation are:
- Sea-surface temperatures of at least 26.5 degrees Celsius or 80 degrees Fahrenheit (usually). A deep warm layer of water beneath the ocean surface (of at least 50 meters or so) can be helpful, but is not necessarily required.
- A location (usually) at least five degrees of latitude (roughly 300 nautical miles) away from the equator.
- A pre-existing disturbance (cluster of showers and thunderstorms) with favorable low-level spin and convergence in the lower half of the troposphere.
- Low values of vertical wind shear between roughly 5,000 and 38,000 feet (generally less than 10 meters per second, or 20 knots).
- A middle troposphere (roughly from about 10,000 to 20,000 feet) that is relatively moist (has moderate to high relative humidity).
- A troposphere that is neutrally stable or unstable with respect to rising moist air parcels (environmental lapse rates must not be too stable such that thunderstorm development is greatly inhibited).
In this section, we'll focus on the first three ingredients on the list.
Sea-Surface Temperatures
As we've already covered, weather records are filled with evidence that sea-surface temperatures play an integral part in the formation, development, intensification and decay of tropical cyclones. Indeed, tropical cyclones are ultimately driven by large evaporation rates, which moisten the air and fuel thunderstorms. All else being equal, evaporation rates increase with increasing sea-surface temperatures, so tropical forecasters look for sea-surface temperatures of 80 degrees Fahrenheit (26.5 degrees Celsius) or higher for tropical cyclones to form, develop, and intensify. Of course, exceptions exist (a small percentage of tropical cyclones have formed with lower sea-surface temperatures), but 26.5 degrees Celsius works well as a general guideline for the sea-surface temperatures typically needed to create sufficient evaporation rates.
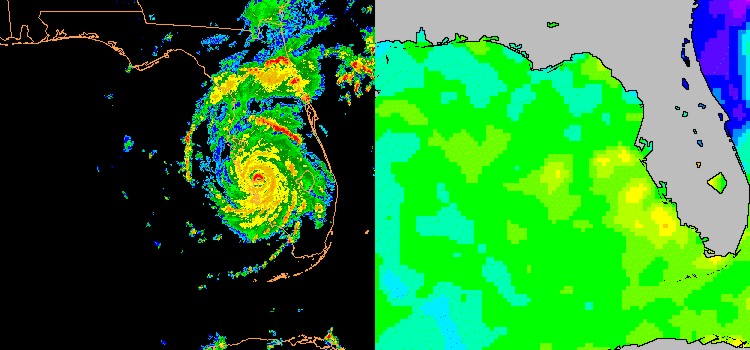
Once a tropical cyclone has formed, as long as other environmental factors are favorable, the storm may intensify if it passes over warmer patches of ocean water. Take Hurricane Charley (2004) as an example. Charley rapidly intensified from a Category 2 to a Category 4 storm as it passed over very warm water along the west coast of Florida in August, 2004 (marked by the yellow and orange shaded areas on the map of sea-surface temperatures on the right [19]). On the flip side, strong tropical cyclones actually play a role in lowering sea-surface temperatures in the waters over which they travel. The powerful winds of strong tropical cyclones really churn up the ocean water beneath them, which causes cooler water from beneath the surface to mix to the top (a process called "upwelling").

To see what I mean, check out the side-by-side images above. The image on the left shows Hurricane Bonnie and sea-surface temperatures on August 22, 1998. The image on the right (from August 28) shows the cool trail left by Bonnie (in blue) while Hurricane Danielle passed to the north of the Caribbean Islands on a northwestward track toward the Atlantic Coast. The darker blue shadings that mark Bonnie's cool wake represent sea-surface temperatures less than 80 degrees Fahrenheit (26.5 degrees Celsius). It turns out that Danielle passed right over Bonnie's cool wake between August 29th through the 31st [20]. Bonnie's cool wake helped prevent Danielle from strengthening during this time, despite other environmental conditions that were largely favorable. A hurricane passing over another hurricane's cool wake is a relatively rare occurrence, but more commonly, a strong tropical cyclone can contribute to its own demise if it stalls or moves very slowly over shallow warm water. The upwelling of cooler water beneath the ocean surface reduces sea-surface temperatures beneath the storm, which reduces evaporation rates, stabilizes the atmosphere somewhat, and weakens thunderstorms.
Latitude
When we looked at tropical cyclone climatology [7], I mentioned that tropical cyclones generally don't form within about 5 degrees latitude of the equator. Why is that? The answer lies in the Coriolis Force. It's the Coriolis Force that paves the way for embryonic tropical cyclones to "spin up". Recall that the magnitude of the Coriolis Force is zero at the equator and increases with increasing latitude. That means the Coriolis Force is relatively weak throughout the tropics, and less than five degrees from the equator, it's generally too weak to impart a circulation on a developing area of low pressure.
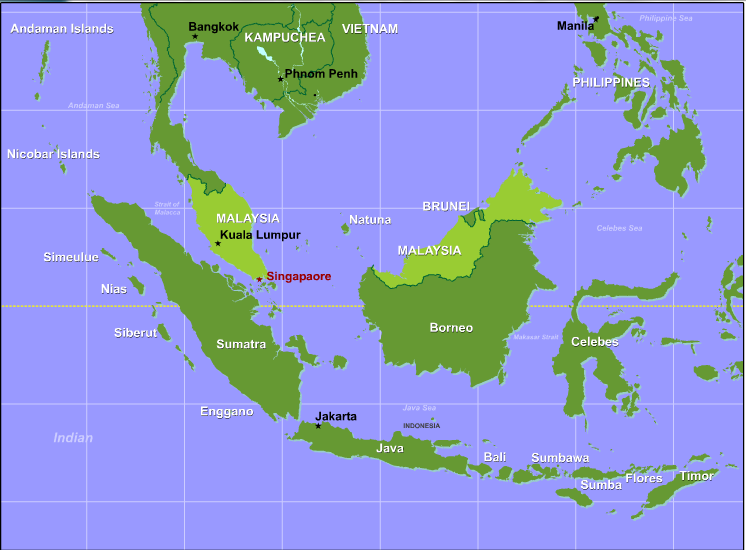
In rare circumstances, tropical cyclones have formed within 5 degrees of the equator. In these cases, the spin for the system must originate from some other source since the Coriolis Force is too weak. In perhaps the most striking example, on December 26, 2001, a tropical cyclone named Vamei [21] formed at approximately 1.5 degrees North latitude near Singapore (on the southern tip of Malaysia [22]). Astonishingly, Vamei intensified into a typhoon in less than 24 hours while it was less than two degrees latitude away from the equator! Vamei spun up so close to the equator that its winds howled in both hemispheres simultaneously.
In this particular case, the lay of the land and water helped impart some spin on the air. Prior to the formation of Vamei, persistent north-northeasterly winds blew over the narrow, southern South China Sea. The funneling of the air into the South China Sea led to a strengthening of the wind. Moreover, the Malaysian Peninsula channeled the air into a counterclockwise pattern of winds, creating a background source of low-level spin (follow the arrows in the image of satellite derived winds below). This background of low-level spin, in tandem with a timely cluster of showers and thunderstorms that migrated over this region, set the stage for an unusual storm that defied all the textbooks.

The bottom line is that developing tropical cyclones require a sustained circulation, and typically that requires them to be at least 5 degrees from the equator so that the Coriolis Force can provide a sufficient contribution. Cases like Typhoon Vamei are the exception, and they get their circulation from other sources. Note that the presence of a cluster of showers and thunderstorms was a key ingredient in Vamei's development, which leads us to our next tropical-cyclone ingredient.
A Pre-Existing Disturbance
Even in areas with very warm sea-surface temperatures located suitably far from the equator, tropical cyclones have no chance to form without another crucial ingredient. Tropical cyclones simply will not form unless there is a tropical disturbance (cluster of showers and thunderstorms) that moves into an environment with favorable low-level spin. You might find it helpful to think of low-level spin and the cluster of showers and thunderstorms as the match and the fuel (respectively) that "ignite" the "heat engine" of a tropical cyclone. Keep in mind that on average, 80 to 90 tropical cyclones form each year -- a number that pales in comparison to the annual mob of extratropical cyclones that parade across the middle and high latitudes. So, although tropical cyclones can grow to be quite fierce, they can also be fragile in the sense that any of the ingredients discussed in this lesson can be missing or added in a way that's unfavorable for formation. And, lacking a seedling disturbance with favorable low-level spin is a non-starter for the entire process.
So, what are the more common sources of tropical disturbances with favorable spin that help incite tropical cyclone formation? In short, different tropical basins have different sources of favorable low-level spin, but in general, we can identify several common sources. Here, I'm going to focus on two:
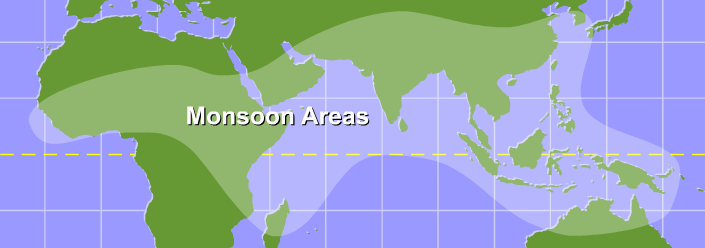
- monsoon troughs -- particularly in the western Pacific, eastern Pacific, western Caribbean, Indian Ocean, and south Pacific
- easterly waves (clusters of showers and thunderstorms with a low-level circulation originating over northern Africa) -- primarily in the Atlantic and eastern Pacific in the Northern Hemisphere
Worldwide, the most prominent source of tropical disturbances with favorable low-level spin for tropical cyclones are monsoon troughs that form in the various monsoonal regions [23]. In the western Pacific, for example, roughly 70-80 percent of tropical cyclones form out of disturbances originating in a monsoon trough. So, what makes monsoon troughs such hot spots for activity? As you know, surface troughs of low pressure are regions of low-level convergence (favorable for thunderstorm formation), but monsoon troughs are also naturally regions of favorable low-level spin, as the schematic below shows.

Because the monsoon trough marks a region where the trade winds and cross-equatorial westerlies come together, it's naturally a region of low-level convergence and favorable spin. The enhanced pre-existing low-level spin helps initially disorganized disturbances to develop well-defined low-level circulations. Besides the northwest Pacific, this mechanism is responsible for providing the seedling disturbances for most tropical cyclones in the Indian Ocean and south Pacific basins, but it can also be a factor occasionally in the eastern Pacific and western Caribbean.
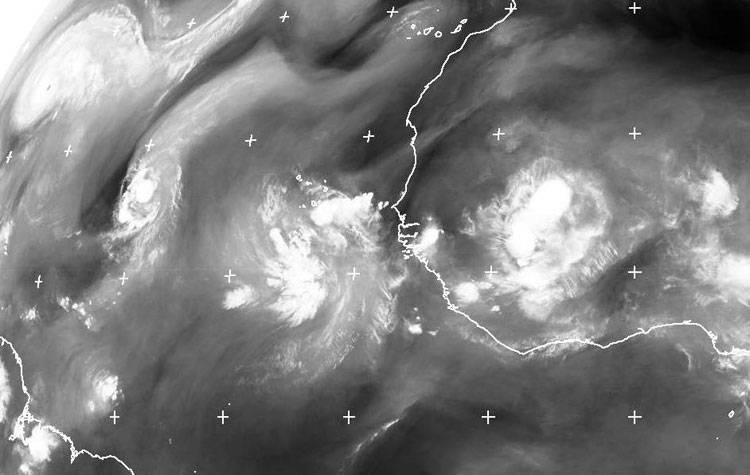
In the Atlantic and eastern Pacific, easterly waves (sometimes generically called "tropical waves") are common sources of seedling disturbances. To demonstrate how important easterly waves are in acting as seedling disturbances for tropical cyclones, consider these stats: Easterly waves initiate approximately 60 percent of the Atlantic tropical storms and minor hurricanes (Categories 1 and 2 on the Saffir-Simpson Scale), and nearly 85 percent of all the major Atlantic hurricanes (Category 3 or higher). Easterly waves are fairly common from June through October -- one exits the west coast of Africa about once every three or four days, so most easterly waves don't go on to become hurricanes. As an example, this water vapor image from 00Z on August 27, 2010 [24] shows a parade of easterly waves on their westward trek across the Atlantic. At the upper-left of the image, you can see Hurricane Danielle, which had formed from an easterly wave.
Other sources for clusters of thunderstorms with favorable low-level spin exist, too. For example, cold fronts that penetrate into the fringes of the tropics (in the Gulf of Mexico, for example), often become stationary and can linger for extended periods of time. As you know, fronts are regions of low-level convergence and directional wind shifts, which can generate low-level spin. If thunderstorms drift over these areas (or develop over them), they can eventually seed the development of a tropical cyclone; however, tropical cyclones that develop from these fronts are often not completely tropical in nature initially (they're initially classified as "subtropical"). Regardless of the source of the disturbance, to assess whether a tropical cyclone may form and thrive, we have to examine conditions in the middle and upper troposphere to see if the environment is favorable for sustaining thunderstorms. We'll start doing that in the next section as we explore the rest of our ingredient list. Read on.
Tropical Cyclone Ingredients: Part II
Prioritize...
At the completion of this section, you should be able to define and describe the eye and eye wall of a tropical cyclone (including how the eye forms). You should also be able to identify and explain the importance of the remaining three ingredients needed for tropical cyclones to form and thrive (weak vertical wind shear, a moist middle troposphere, and a neutrally stable or unstable troposphere).
Read...
In order to understand the importance of the remaining tropical-cyclone ingredients, we have to talk a bit about the "warm core" of these storms. As I mentioned previously, tropical cyclones are warm core systems -- tropospheric temperatures in and around the center of the storm are warmer than their surroundings (in contrast to mid-latitude cyclones, which are cold-core systems).
How does the warm core of a tropical cyclone develop? Organized thunderstorms around the center are the key. Simply put, the air parcels rising in thunderstorm updrafts are initially very warm and moist (due to evaporation from warm tropical seas). But, as these parcels rise and cool to form thunderstorm clouds, net condensation occurs, which releases energy to the surrounding air (called "latent heat of condensation"). So, air parcels cool as they rise, but the release of latent heat keeps them warmer than they otherwise would be, which keeps the air within a hurricane warmer than air at the same altitudes outside of the influence of the hurricane.
The release of latent heat is one important contributor to the warm core of a tropical cyclone, but it's not the only contributor. As air in thunderstorm updrafts reaches the top of the troposphere, it spreads out and flows outward from the center of the storm, creating divergence aloft, which as you may recall, reduces the weight of air columns near the center of the storm, and reduces the sea-level pressure. But, not all of the air near the top of the storm flows outward. Some drifts over the center and sinks. As the air sinks over the center of the storm, it warms (recall that the warming occurs as air parcels compress in environments of higher pressure as they sink). This sinking and warming air over the center of the storm contributes to the tropical cyclone's warm core, of course, but it also makes the tropical cyclone more intense because warmer air columns in the center of the storm are less dense, which further reduces sea-level pressure.
But, the consequences of sinking air over the center of a healthy tropical cyclone don't stop there! As air sinks and warms, relative humidity decreases as evaporation rates increase, which causes clouds to dissipate over the center of a healthy tropical cyclone. Indeed, sinking air over the center results in the formation of a tropical cyclone's "eye." For the record, the eye is a roughly circular, fair-weather zone at the center of a hurricane. By "fair weather", I mean that little or no precipitation occurs in the eye and an observer looking upward in the eye can often see some blue sky or stars. The visible satellite image of Hurricane Isabel from 1404Z on September 11, 2003 (below) shows a good example of a hurricane's eye. In general, a "healthier" hurricane has a very well-defined eye, and a deterioration of the eye (becoming obscured by high clouds) is often a sign of weakening.

The diameter of the typical eye ranges from approximately 30 to 60 kilometers (about 16 to 32 nautical miles across), but eye diameters as small as four kilometers (approximately two nautical miles) and as large as 200 kilometers (approximately 110 nautical miles) have been observed. Immediately surrounding the eye is the eye wall, which is a ring of tall thunderstorms that typically contains the worst weather in a hurricane (most violent winds, etc.). So, the most violent weather in a hurricane typically surrounds the relative calm of the eye itself.
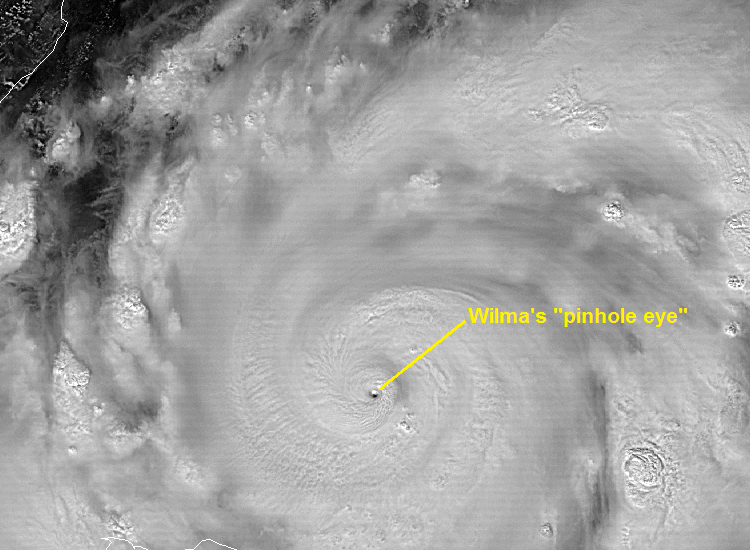
The combination of upper-level divergence and sinking, warming air over the center of tropical cyclones allows them to become the "kings of all low-pressure systems," attaining sea-level pressure values much lower than those of mid-latitude cyclones (assuming favorable environmental conditions, of course). For the record, Hurricane Wilma's "pinhole eye" [25] was the smallest recollected by forecasters at the National Hurricane Center (two nautical miles) as the storm deepened to 882 millibars (the lowest on record in the Atlantic Basin) in 2005. For comparison, recall that most sea-level pressure values are greater than 950 millibars (even those in very strong mid-latitude cyclones). So, the organization of thunderstorms around the center is absolutely critical to the overall "health" of a tropical cyclone. With that in mind, let's explore the rest of our ingredients.
Weak Vertical Wind Shear
For starters, as a reminder, vertical wind shear is simply a change in wind direction and / or speed with increasing height. Weak vertical wind shear favors the development and maintenance of tropical cyclones, while strong vertical wind shear is detrimental. The reason that strong vertical wind shear (particularly wind shear directed in the opposite direction of the storm's motion) spells the kiss-of-death for tropical cyclones is that it disrupts convection around the center of the storm. In a worst-case scenario, large differences in wind direction and / or speed with increasing height can push the thunderstorms away from the center, exposing the low-level center of circulation, as happened with Tropical Storm Nicholas in 2003 (below).

Note the swirl of yellowish low clouds that marks the low-level circulation of Tropical Storm Nicholas. Also note that the thunderstorms associated with Nicholas (bright white clouds) lie well to the southeast of the tropical storm's center. Given the lack of thunderstorms around the center of the storm, Nicholas was doomed and was downgraded to a tropical depression a few days later. Even when the impacts of shear aren't as dramatic as they were with Nicholas, at the very least the release of latent heat in thunderstorms and warming from nearby sinking air gets removed from the central region of the storm, which tends to increase surface pressure near the center of the storm and reduce the pressure gradient across the storm (which reduces the tropical cyclone's wind speeds).
For tropical cyclones, forecasters typically assess vertical wind shear in the layer between about 5,000 feet and 38,000 feet (often called "deep-layer shear" because the layer spans most of the depth of the troposphere). As a general rule, vertical wind shear values less than 10 meters per second (roughly 20 knots) between 5,000 feet and 38,000 feet are typically considered favorable for tropical cyclones to form and thrive. An important caveat regarding this threshold is in order, however. Like most meteorological thresholds, 10 meters per second isn't a magic value of wind shear at which the environment becomes unfavorable for all tropical cyclones. The impacts of wind shear depend on a few other factors, too, such as storm size. A small tropical cyclone, for example, may be "bothered" by shear even if it's a little less than 10 meters per second. A larger storm may not feel negative impacts from shear even if it's a bit higher than 10 meters per second. Think of 10 meters per second as a rough guideline, and not an absolutely firm threshold. The relative humidity in middle troposphere surrounding a storm can also help determine how resilient it is to vertical wind shear, which brings us to our next ingredient.
A Moist Middle Troposphere
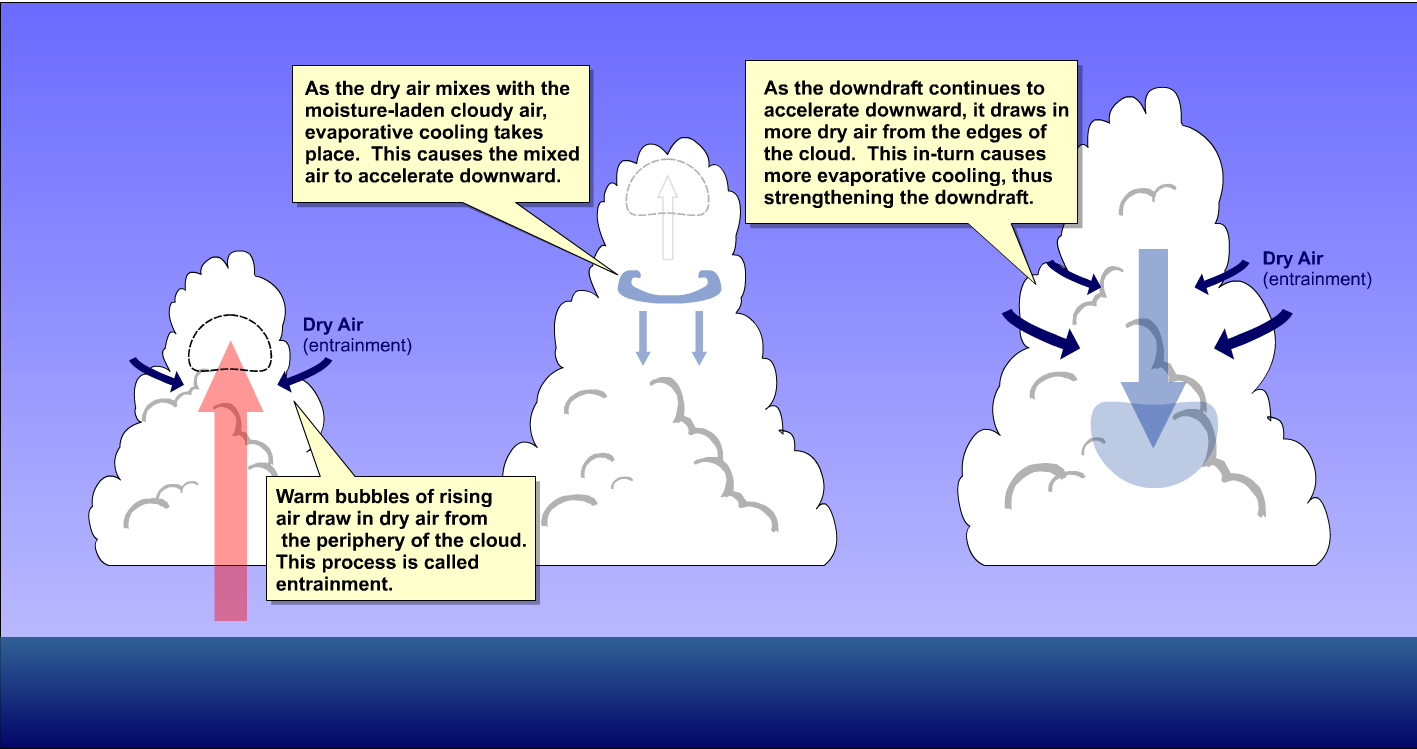
Tropical cyclones tend to form and flourish in regions where there's high relative humidity in the middle troposphere. Conversely, middle tropospheric air with low relative humidity is like poison to tropical cyclones because of the process of dry entrainment [26], which you learned about previously. Recall that dry air gets drawn into cloudy air parcels during dry entrainment, which leads to net evaporation and cooling of the air parcel. Therefore, dry entrainment reduces positive buoyancy within thunderstorm clouds and encourages downdrafts, which stifles convection. Developing tropical cyclones are quite fragile, and when a developing disturbance entrains relatively dry air in the middle troposphere, it's unlikely to become a tropical cyclone. Indeed, mid-level dry air entrained into the central-core thunderstorms causes strong downdrafts to develop, which snuffs out new convection in the vicinity of the central core.
Strong, mature tropical cyclones have some limited resistance to environmental dry air because it "eats away" at thunderstorms on the periphery of the system at first, but once the drier air wraps into the storm's circulation, it deals a major blow to even strong tropical cyclones. Meteorologists sometimes use water vapor imagery to help them track regions of dry air in the middle and upper troposphere around tropical cyclones, and the two water vapor images below give an example. The image on the left shows Hurricane Isabel at 12Z on September 14, 2003. At the time, Isabel was a Category-5 storm, with maximum sustained winds of 135 knots. A little more than two days later (right image), Hurricane Isabel had weakened to a Category-2 storm (90 knots) after having ingested dry air in the middle troposphere. To watch the evolution, check out this loop of water-vapor images [27] to get a better sense of how the dry air weakened Isabel. Note the dark splotch of relatively dry air over the Bahamas that erodes Isabel's western periphery and eventually wraps into the circulation of a noticeably weakening Isabel.

I should also point out that mid-tropospheric air with low relative humidity originating over land can also take its toll on a fully developed tropical cyclone as it approaches land. For example, on June 4, 2007, Super Cyclonic Storm Gonu in the Arabian Sea had maximum sustained winds that peaked at 140 knots. But, as dry mid-level air over the Middle East [28] circulated into the storm, the storm fizzled to a Category 1 storm in a little more than 24 hours. So, ultimately, tropical cyclones will weaken if they draw in mid-tropospheric air with low relative humidity as they approach land (or are out over open water).
A Neutrally Stable or Unstable Troposphere
When tropical cyclones form, the background environment is usually neutrally stable or has some weak "conditional instability," meaning that "moist" air parcels (in which net condensation is occurring) are unstable. In other words, the environment must not be so stable that air parcels can't become positively buoyant (because that would inhibit thunderstorm development).
The presence of a neutrally stable or unstable atmosphere ties back somewhat to sea-surface temperatures. Over oceans where sea-surface temperatures are less than 26 degrees Celsius, the troposphere is typically too stable for thunderstorm development, but at higher sea-surface temperatures (26.5 degrees Celsius or more), a deep layer in the troposphere typically becomes neutrally stable or slightly unstable for moist air parcels. So, in addition to favoring high evaporation rates, high sea-surface temperatures also environmental favor lapse rates that are sufficient for tropical thunderstorms to develop and flourish.
As with many of the other ingredients, if sufficient lapse rates are lacking, thunderstorm development suffers (and so, too, does the tropical cyclone). Now that we've covered the ingredients needed for a tropical cyclone, let's see what happens when we mix all of the ingredients together to "cook up a storm." Read on!
Cooking Up A Storm
Prioritize...
After completing this section, you should be able to describe the process by which a tropical cyclone intensifies, including the air flow through a tropical cyclone (known as the "secondary circulation"). You should also be able to describe why tropical cyclones weaken over land, and define "stadium effect."
Read...
Over the past couple of sections, we've covered the ingredients needed for tropical cyclones to form and thrive. Here they are again, as a reminder:
Tropical Cyclone Ingredients
The six basic ingredients for tropical cyclone formation are:
- Sea-surface temperatures of at least 26.5 degrees Celsius or 80 degrees Fahrenheit (usually). A deep warm layer of water beneath the ocean surface (of at least 50 meters or so) can be helpful, but is not necessarily required.
- A location (usually) at least five degrees of latitude (roughly 300 nautical miles) away from the equator.
- A pre-existing disturbance (cluster of showers and thunderstorms) with favorable low-level spin and convergence in the lower half of the troposphere.
- Low values of vertical wind shear between roughly 5,000 and 38,000 feet (generally less than 10 meters per second, or 20 knots).
- A middle troposphere (roughly from about 10,000 to 20,000 feet) that is relatively moist (has moderate to high relative humidity).
- A troposphere that is neutrally stable or unstable with respect to rising moist air parcels (environmental lapse rates must not be too stable such that thunderstorm development is greatly inhibited).
So, what exactly happens when all of these ingredients get mixed together and the atmosphere cooks up a storm? In other words, how does a tropical cyclone go from a rather disorganized cluster of thunderstorms (like in the enhanced infrared image on the left below), to a highly organized, powerful hurricane (like in the image on the right below)?

The image above on the left shows the tropical disturbance -- a somewhat disorganized area of showers and thunderstorms -- that would eventually develop into Hurricane Irma, as seen on enhanced infrared imagery on August 28, 2017. A week later (above on the right), Irma had developed into a well-organized, powerful Category 5 hurricane with a distinctive eye. How did Irma go from a cluster of showers and thunderstorms to a monster hurricane?
Well, for starters, the six ingredients listed above all were obviously present in a favorable fashion. But, let's explore how a tropical cyclone actually strengthens. I'll cover the process as a series of steps, and you'll see that the idea of feedback is very important. Assuming we're starting with a tropical disturbance over sufficiently warm water, far enough from the equator in a neutrally stable or unstable environment...
- as low-level air converges into the region of thunderstorms, it flows over the warm ocean, which increases evaporation from the water below (spray from turbulent waves evaporates, etc.) and moistens the low-level air.
- In this way, the interaction between the atmosphere and ocean actually makes the environment more favorable for thunderstorms within the developing tropical cyclone by creating and sustaining an area where the low-level air is locally more moist than its surroundings. As air rises in thunderstorm updrafts near the center of the storm, it cools, but releases latent heat along the way. The release of latent heat makes the air near the core of the storm warmer than its surroundings.
- As air parcels reach the tops of thunderstorms at the tropopause, most flow outward, creating upper-level divergence which reduces the weight of central air columns and reduces surface pressure. Some lofty air parcels also sink into the center and warm. This warming also works to reduce surface pressure because these warmer air columns are less dense than their surroundings.
- Lower surface pressures at the center of the storm work to increase the pressure gradient across the storm, which increases surface wind speeds. Faster winds blowing over the ocean further increases evaporation rates of warm ocean waters (further moistening the low-level air toward the center of the storm), which favors more thunderstorms, and so on.
- If thunderstorms can remain organized and flourish around the center of the storm for long enough, the sinking, warming air over the center of the storm evaporates clouds and the eye forms, signifying a healthy tropical cyclone. Surface pressures continue to fall as upper-level divergence and warming from sinking air over the center continue.
To help you visualize this process, check out the short video (2:37) I created below, which shows a cross-section through a hurricane, and highlights way air parcels flow through a tropical cyclone, helping it to strengthen. Keep in mind that in reality, air spirals inward toward the center of a tropical cyclone in the lower troposphere (remember, air flows counterclockwise around low-pressure systems in the Northern Hemisphere), but the schematic shown in the video shows a simpler picture and emphasizes the storm's "secondary circulation," tracing air parcels as they flow in toward the center of the storm at low altitudes, then rise in thunderstorms, and then flow outward at the top of the storm (they ultimately sink around the periphery of the tropical cyclone).
To see how a hurricane intensifies, we're going to look at a cross-section of a developing hurricane and follow the paths of air parcels through the storm. In reality, air parcels spiral inward toward the center of low pressure at the surface as a hurricane swirls along, but we're not going to worry about the storm's rotation, and instead we're going to focus on the secondary circulation to see how tropical cyclones intensify.
To start, we'll assume that we have a minimal hurricane with a minimum central pressure of 985 millibars. Air flows toward the center of low pressure at the surface, and on its path in toward the center of the storm, evaporation of warm ocean water moistens the low-level air, making it more favorable to rise in thunderstorm clouds in the eye wall. Air parcels rise in tall thunderstorms in the eye wall, and most of the air parcels flow outward at the top of the storm, creating upper-level divergence that acts to reduce surface pressure by reducing the weight of air columns near the center of the storm. But, some air parcels sink into the eye and they warm up as they sink. This warming also helps reduce surface pressure because warmer air columns over the center of the storm are less dense.
As the surface pressure drops, now at 966 millibars in our example, the pressure gradient across the storm increases, which causes wind speeds to increase. So, low-level air rushes in toward the center of the storm even faster. Faster moving air over the warm ocean water increases evaporation rates, which fuels more intense thunderstorms in the eye wall. More air then flows outward at the top of the storm, creating stronger upper-level divergence, while sinking air in the eye increases too, causing surface pressure to decline even more.
Our example hurricane here now has a central pressure that has dropped to 949 millibars, and we have a really formidable hurricane now. An extremely strong pressure gradient causes air to race in toward the center of the storm at an even faster rate, and high evaporation rates and strong-low level convergence cause eye wall thunderstorms to continue to intensify. The greater upward transport of air in the eye wall leads to more air sinking into the eye and warming, which maximizes the storm's warm core, and also leads to stronger upper-level divergence, both of which favor additional declines in surface pressure.
This feedback loop can continue if a hurricane remains in an environment with favorable ingredients, but if one or more of the ingredients for tropical cyclones becomes unfavorable, thunderstorms near the center either weaken or become disrupted, which ultimately leads to increasing surface pressure and a weakening tropical cyclone.
This basic sketch of how tropical cyclones strengthen should emphasize the importance of evaporation of warm ocean waters feeding organized thunderstorms around the center of the storm. The upper-level divergence that occurs at the top of these thunderstorms as air spreads out, along with the sinking, warming air over the center of the storm act to reduce surface pressures, intensifying the storm as feedback processes support the development of more thunderstorms. But, if the storm moves into an environment where one or more of the ingredients are unfavorable (say, vertical wind shear is strong, the middle troposphere has low relative humidity, or sea-surface temperatures are less than 80 degrees Fahrenheit), then the thunderstorms become less intense and / or less organized, which interferes with the feedback processes needed to strengthen the storm. In such cases, tropical cyclones typically weaken.
The fact that tropical cyclones rely on evaporation of warm ocean waters to fuel thunderstorms also helps explain why they typically weaken when they travel over land. Without the high evaporation rates offered by warm ocean water, thunderstorm activity inevitably weakens, and the feedback processes break down. Interestingly, some weaker tropical cyclones (tropical depressions and tropical storms, in particular) can actually sustain themselves for a time over land if they travel over a warm area with extremely wet soils (called the "Brown Ocean Effect [29]"). Still, eventually these storms fizzle out over land, too.
But, if favorable ingredients come together for long periods of time over the ocean, the atmosphere can cook up some monster tropical cyclones. For example, check out this 10-day enhanced infrared satellite time-lapse [30] showing the development and intensification of Hurricane Irma from September 1 through September 10, 2017, as it raged through the Caribbean, Cuba, and eventually the United States. At its peak, Irma was a Category 5 hurricane with maximum sustained winds of 180 miles per hour. The time-lapse also shows Hurricane Jose developing right on Irma's heels. Jose peaked briefly as a Category 4 storm, but couldn't maintain that intensity for long because of less favorable environmental conditions.

When tropical cyclones become very powerful, they can make for some visually stunning satellite imagery (to meteorologists, anyway). Occasionally, the eye of a powerful tropical cyclone actually takes on the shape of a stadium [31] (credit: Steve Seman) in that it's wider at the top than at the bottom. This so-called stadium effect often signifies an extremely intense tropical cyclone. You can get a sense of the stadium effect from the zoomed-in loop of Hurricane Irma's eye (on the right) from the evening of September 5, 2017. The shadows cast on the eye from the tall clouds surrounding it created a remarkable effect as the sun was setting. The eye of Super Typhoon Lan (2017) [32] gives another good example of the stadium effect.
The complex and turbulent processes around the eye of tropical cyclones are on full display in this loop of visible satellite images of Hurricane Maria's eye [33] (credit: NASA / Dakota Smith) from September 21, 2017. Note the chaotic and turbulent motions going on around the eye of the storm in the eye wall. For what it's worth, these small-scale, turbulent processes in tall eye-wall thunderstorms may hold the keys to some aspects of tropical cyclone intensification that aren't yet well understood. Ultimately, the processes described earlier in this section give a good basic idea of how tropical cyclones intensify, but they can't fully explain the very rapid intensification that some tropical cyclones exhibit. Such rapidly intensifying storms pose huge challenges for forecasters, and recent research suggests the turbulent processes in eye-wall thunderstorms may hold the keys to explaining rapid intensification. Research is ongoing, and hopefully will lead to forecasting improvements.
While meteorologists are often in awe of powerful tropical cyclones, these storms are also very dangerous, and public safety relies on accurate forecasts. How do forecasters know whether tropical cyclones are headed for a particular town? We'll answer that question next!
Tropical Cyclone Steering
Prioritize...
When you've finished this section, you should be able to describe the main steering factors for tropical cyclones, including the role of subtropical highs. You should also be able to interpret the tropical cyclone "forecast cone of uncertainty" from the National Hurricane Center.
Read...
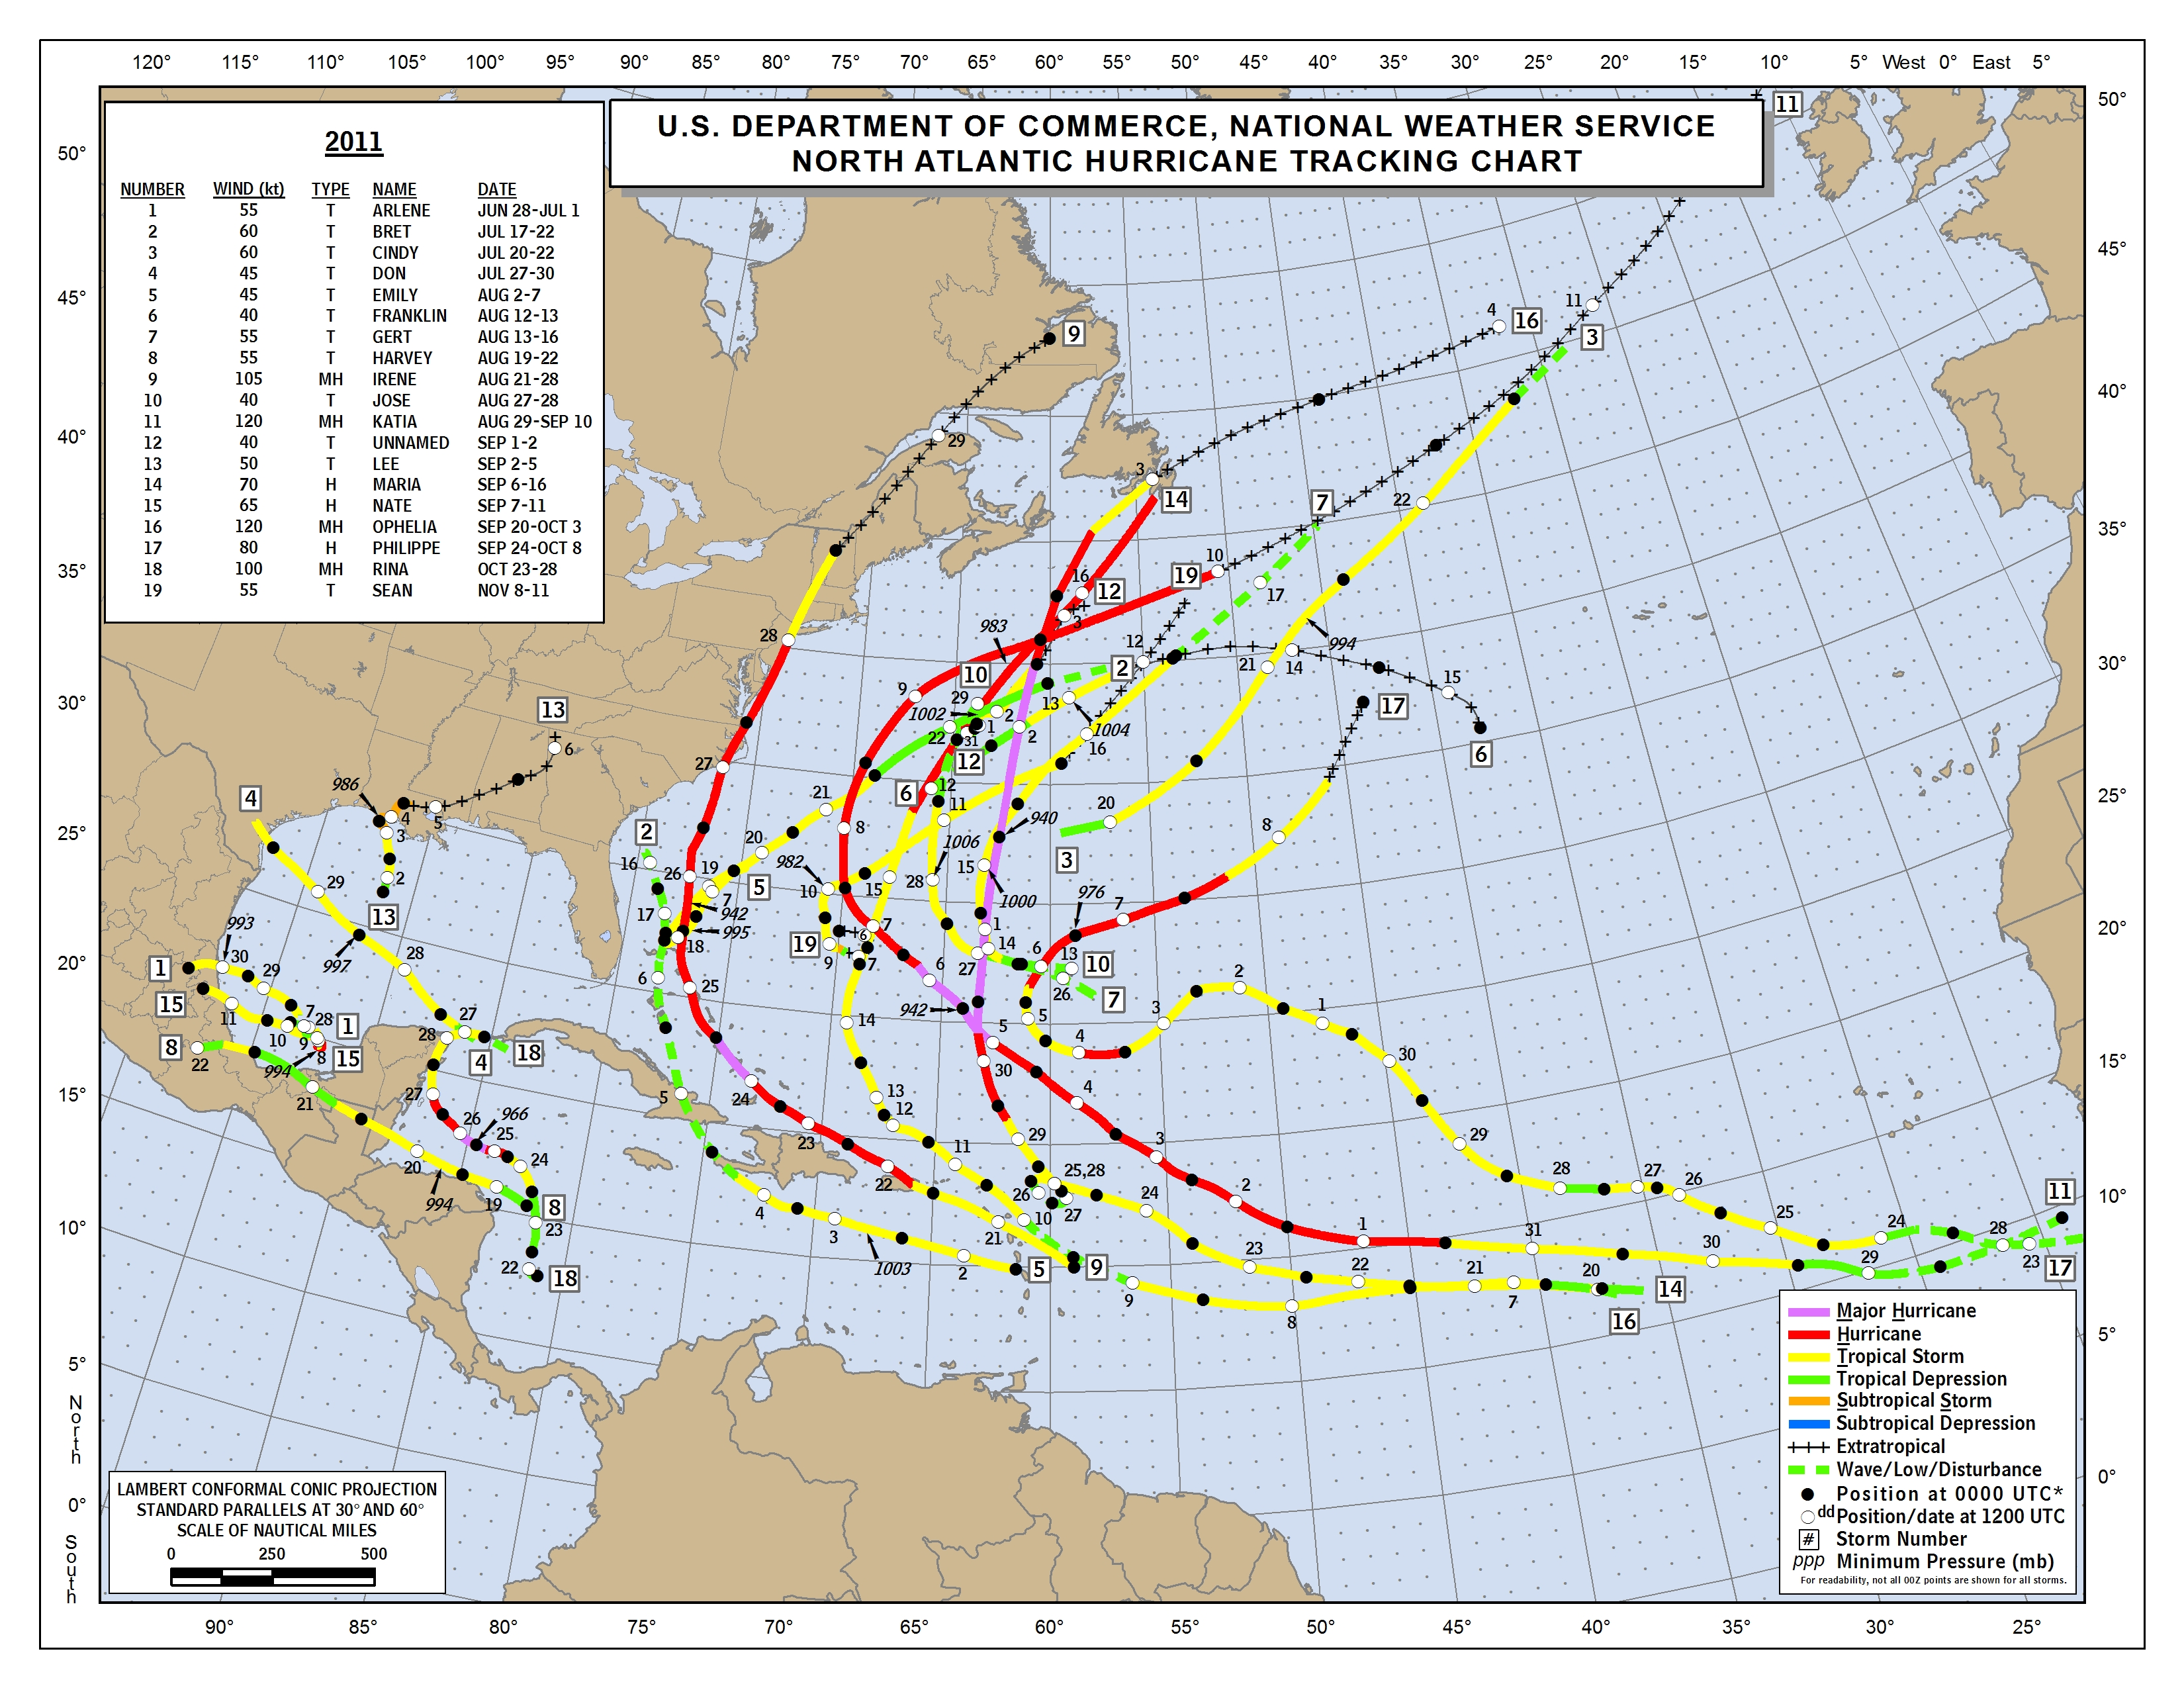
If you look at a seasonal track map from an Atlantic hurricane season containing several storms that trekked across the Atlantic from Africa toward North America, you'll note a common theme to many of the tropical cyclone tracks. To see an example, take a look at the track map for the 2011 Atlantic hurricane season [34]. The gracefully clockwise-curving tracks of many storms in the Atlantic mirror the broad clockwise circulation of the Bermuda High. That's not a coincidence! Generally speaking, subtropical high-pressure systems (which you learned about previously) provide the mid-tropospheric steering winds for many tropical cyclones. Indeed, their clockwise curving tracks coincide with the clockwise circulation associated with the Atlantic subtropical high, as indicated by the schematic below.

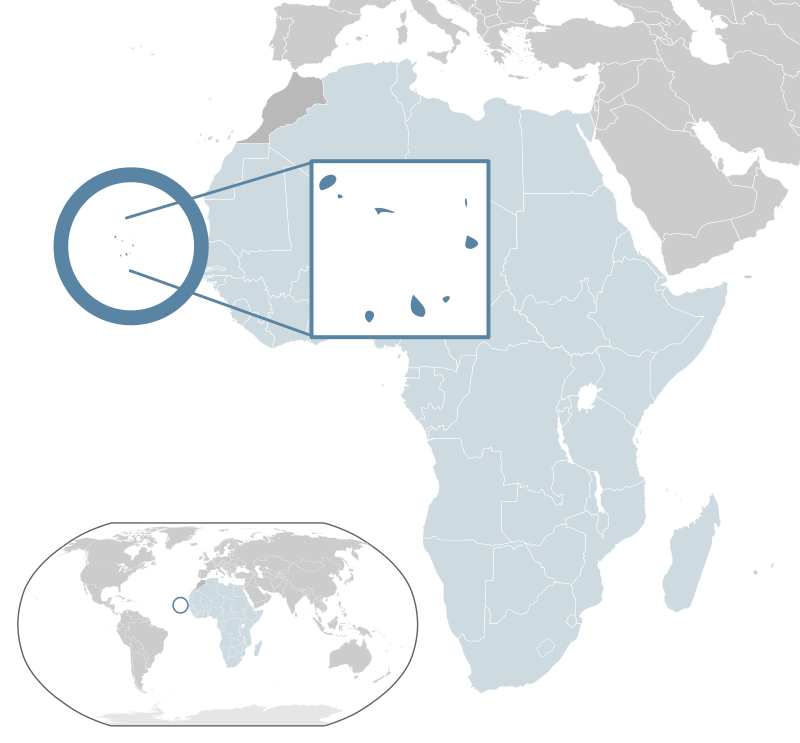
For the record, tropical cyclones that make the long trek across the Atlantic are often called "Cape Verde storms" because they often form within 1000 kilometers of the former Cape Verde Islands [35] off the west coast of Africa. In 2013, these islands formally changed their name to the Cabo Verde Islands, but the name "Cape Verde storm" still lives on in meteorological circles. Old habits die hard!
While the mid-tropospheric winds around subtropical high-pressure systems play an important role in the steering of tropical cyclones (especially Cape Verde storms), they're not the only features that steer tropical cyclones. If only it were that simple! Indeed, when tropical cyclones head toward the middle latitudes, mid-latitude weather systems (particularly upper-level troughs and ridges) can also steer tropical cyclones as they move poleward from the tropics. To further complicate matters, tropical cyclones can actually impact their own steering environments (especially when steering currents are weak) as well as the steering environments of other nearby tropical cyclones.
But, when it comes to forecasting the movement of tropical cyclones, years of experience and research have shown that the average winds in various atmospheric layers are the dominant steering forces for tropical cyclones. Research has shown that the relevant atmospheric "steering layer" for a given tropical cyclone depends on the intensity of the storm. And, while there seem to be slight differences between ocean basins, the following theme holds true everywhere: The depth of the steering layer for a tropical cyclone increases with increasing cyclone intensity. More specifically:
-
Weak tropical cyclones (tropical depressions and tropical storms) tend to move in concert with the mean wind in a relatively shallow steering layer residing in the lower half of the troposphere (roughly 5,000 to 18,000 feet is a good proxy).
-
Strong tropical cyclones (hurricanes) tend to move with the mean wind in a much deeper layer that spans most of the troposphere (forecasters commonly look at the layer between roughly 5,000 and 35,000 feet).
The main takeaway is that stronger tropical cyclones are steered by the mean winds through a deep layer of the troposphere, while weak tropical cyclones tend to be steered by the mean winds in a much shallower layer in the lower half of the troposphere. To see an example of how forecasters assess a tropical cyclone's steering environment, let's look at Hurricane Irene, which brushed the East Coast of the United States in 2011. Here's a plot of Irene's track [36], and at 12Z on August 24, 2011, Irene was moving northwestward through the Bahamas. At the time, Hurricane Irene’s minimum central pressure was 957 millibars, so it was a fairly intense tropical cyclone, which would have been largely steered by the mean winds through a deep layer of the troposphere. If we look at the analysis of deep-layer steering winds (average winds through a deep layer of the troposphere) below, the reasons for Irene's northwest movement at this time were pretty clear, if you account for the fact that Irene's own circulation leaves a footprint in the wind field right in the storm's vicinity.

I've marked the center of the Bermuda High with a white "H", and the pattern of steering winds shows that Irene was following along with the clockwise flow around the high's periphery, as many Atlantic hurricanes do. But, sometimes assessing the steering environment for a tropical cyclone isn't so straightforward. Occasionally, steering winds are weak and don't provide a clear message about storm motion. In these cases, weak steering currents over the tropics, subtropics and middle latitudes can pave the way for slow, erratic movement of tropical cyclones (often a few knots or less), the details of which can be really hard to predict.
Tropical cyclones themselves actually account for some of the erratic drifts and turns in the tracks of slow-moving storms. While the physics of how tropical cyclones can alter their own steering environments is beyond the scope of this course, research has shown that this effect accounts for about 10 to 20 percent of a tropical cyclone's movement (the other 80 to 90 percent is controlled by mean winds in a specified steering layer, as I just discussed). These "storm-induced" steering forces are difficult to model as storms move and evolve, which makes forecasting in situations with weak steering winds particularly difficult.
Fortunately, steering winds are often robust enough to send a clear message about hurricane motion (at least for short term forecasts), and the average forward speed of tropical cyclones is about 15 knots (17 miles per hour). At the extreme, one legendary hurricane that raced along its path was the 1938 "Long Island Express." [37] This storm made landfall as a Category-3 hurricane over Long Island, New York, and has been a subject of fascination ever since. The Long Island Express got its nickname because its forward speed approached 70 miles per hour as it streaked from 160 kilometers (100 miles) east of Cape Hatteras, North Carolina, at 7 A.M. on September 21, 1938, to Connecticut by 4 P.M. Although such a forward speed is exceptionally fast by hurricane standards, most tropical cyclones do speed up once they traverse into the middle latitudes because steering currents are often stronger there.
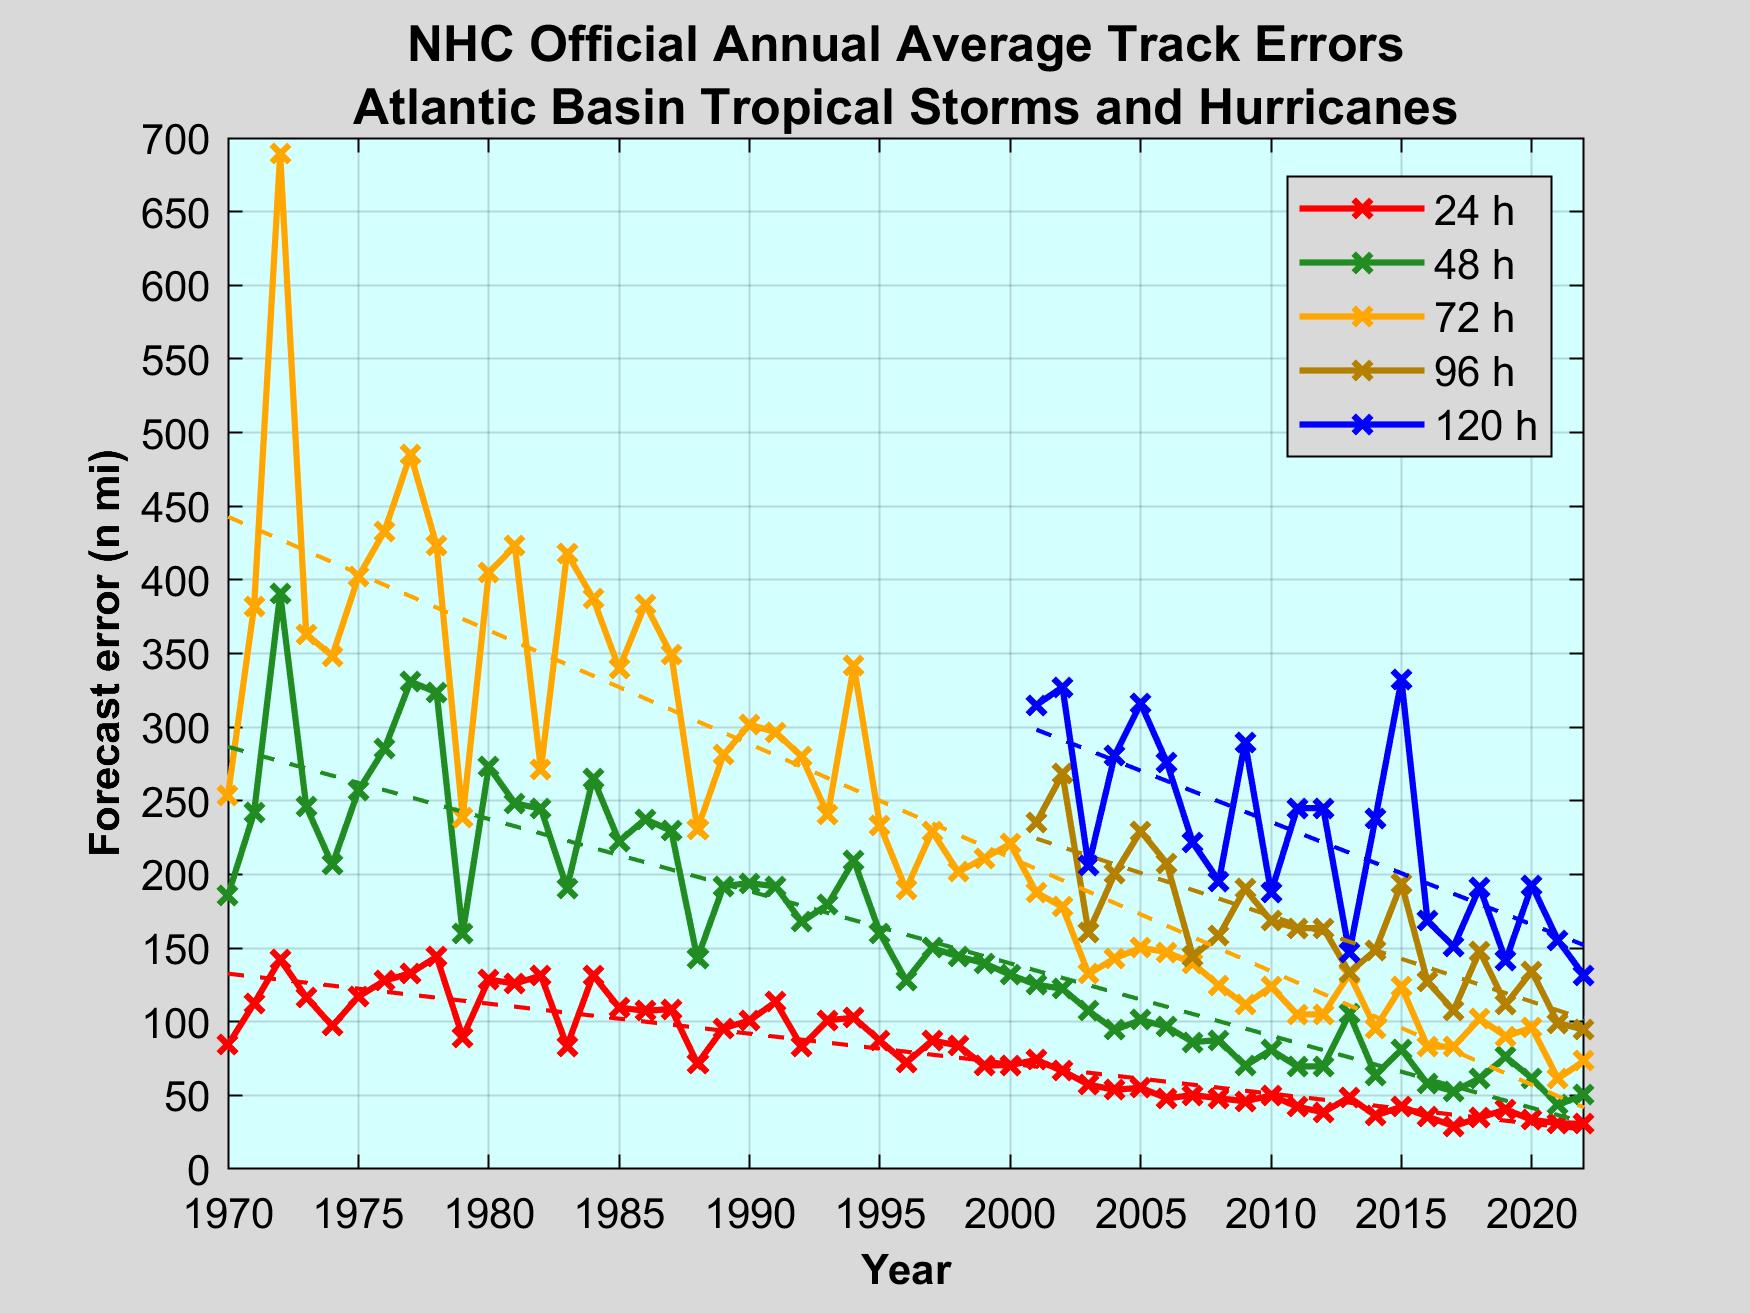
Even when a hurricane's track forecast appears rather straightforward, given the lack of upper-air observations and data over the tropical ocean basins, our ability to perfectly measure the steering environment over the oceans is imperfect; therefore, computer models that provide forecasters guidance for movement and intensity are flawed. Still, computer model guidance has improved over the years, resulting in better hurricane track forecasts, as shown on this graph of the average track forecast errors [38] for National Hurricane Center forecasts of tropical storms and hurricanes since 1970. For the record, the National Hurricane Center is the branch of the National Weather Service responsible for providing tropical cyclone forecasts for 24 countries in the Americas and the Caribbean Islands, as well as maritime interests in the North Atlantic Ocean, Gulf of Mexico, Caribbean Sea, and Eastern Pacific (north of the Equator). A three-day forecast of a tropical cyclone's track from the National Hurricane Center today (average error less than 100 nautical miles) is more accurate, on average, than a one-day forecast was in the early 1970s!
Still, given our inability to perfectly measure the steering environments over data-sparse oceans, and the fact that tropical cyclones can modify their own steering environments (which is hard to model as storms move and evolve), hurricane track forecasts have uncertainties associated with them. To account for this, the most common presentation of forecasts for the track of a tropical cyclone's center are the National Hurricane Center's "cone of uncertainty." When a tropical cyclone threatens land, you'll find versions of their "cone of uncertainty" commonly on the Web and television news broadcasts. Below is the National Hurricane Center's "cone of uncertainty" for Hurricane Irma, issued at 5 A.M. EDT on September 7, 2017.

The position of Irma's center at the time the graphic was issued is marked by the black "X." The series of black dots indicate the successive predicted positions of Irma's center in the "official" National Hurricane Center Forecast. The letters within each dot indicate Irma's predicted intensity at each forecast time ("H" = Hurricane; "M" = Major Hurricane). The white shaded area reflects the cone of uncertainty through Day 3, while the cone for Days 4 and 5 is marked by the white-stippled area. Note how the cone of uncertainty widens with time, reflecting the growing uncertainty as forecast lead time increases.
The width of the cone is based on the National Hurricane Center's historical forecast errors for the previous five years, so the actual width of the cone changes a bit every year. To see what I mean, compare the width of the forecast cone for Hurricane Katrina in 2005 to how wide the cone would have been had Katrina occurred in 2015 [39]. The fact that the Katrina's cone would have been narrower had it occurred in 2015 reflects the average improvement in hurricane track forecasts.
Data suggest that the five-day path of a tropical cyclone's center will remain entirely within the five-day forecast cone approximately 60 to 70 percent of the time, which means that 30 to 40 percent of the time, a storm's center may travel outside the cone. Regardless, you should note hurricanes are not "points". They are storms with horizontal breadth, with wind fields that can span hundreds of miles. The forecast cone of uncertainty is based on probable paths of the center of the storm, and as a result, tropical-storm and hurricane conditions may occur outside the cone, even if the center of the storm always remains within the forecast cone of uncertainty. To help make that point, the National Hurricane Center includes a depiction of the current wind extent around the center of the storm (brown and orange shading show the extent of hurricane and tropical-storm force winds, respectively).
So, keep in mind that the forecast "cone of uncertainty" that you may see as a storm approaches land is meant to send the message that the storm's exact path is not certain. If you live in a tropical cyclone-prone area in or around North America, I urge you to keep tabs on National Hurricane Center [40] official forecast products for updated forecasts. They can help you prepare for the many hazards that tropical cyclones may bring when they make landfall (and afterward), which we'll explore in the next section. Read on.
Tropical Cyclone Hazards
Prioritize...
Upon completing this section, you should be able to discuss the wind-related hazards (in the eye wall and spiral bands) and water-related hazards (storm surge and inland flooding) associated with tropical cyclones. You should also be able to identify which areas of a tropical cyclone are most prone to specific hazards.
Read...
As the "kings of all low-pressure systems," hurricanes can cause immense damage. Recall that the top of the list of costliest weather disasters in the United States [1] is dominated by hurricanes. So, exactly what are the hazards associated with tropical cyclones? When it comes do diagnosing their hazards, the discussion basically comes down to two things -- wind and water. Let's investigate.
Wind-Related Hazards
Overall, the area of a tropical cyclone with the worst weather tends to be the eye wall. The eye wall of a hurricane or typhoon (especially a major hurricane or Super Typhoon) can be a really violent place, as evidenced by this chaser video of conditions in the eyewall of Super Typhoon Haiyan (2013) [2] I referenced previously (it's worth a watch now if you didn't watch it before). The eye wall usually contains the fiercest winds in the storm, which is an important point to remember because the Saffir-Simpson Scale uses maximum sustained wind speed to classify hurricanes. Therefore, typically hurricanes are classified by the maximum sustained winds in the eye wall. So, if a hurricane is rated as a Category 4 storm on the Saffir-Simpson Scale, that means Category-4 sustained winds (130-156 miles per hour) are likely located somewhere in the eye wall.

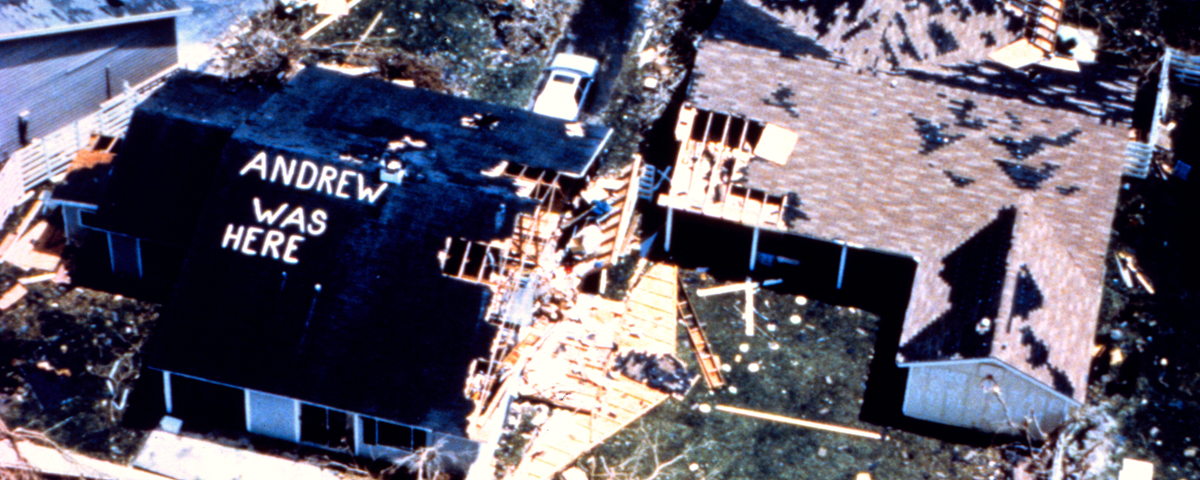
But, while only a small area experiences the maximum winds a storm produces, the wind damage in that area can be catastrophic. Hurricane Andrew (1992) is one of only a few Category 5 hurricanes on record to hit the United States, and provides a good example. Andrew's eye wall passed directly over Homestead, Florida (just south of Miami) and completely destroyed 99 percent of the mobile homes in town. Furthermore it stripped some frame-built houses right off their foundations. A 164-mile per hour wind gust was measured at the headquarters of the National Hurricane Center (located in nearby Coral Gables, Florida) before their wind-measuring equipment broke. Indeed, the damage from violent horizontal and vertical air motions in the eye wall [42] looked much like that of a violent tornado.
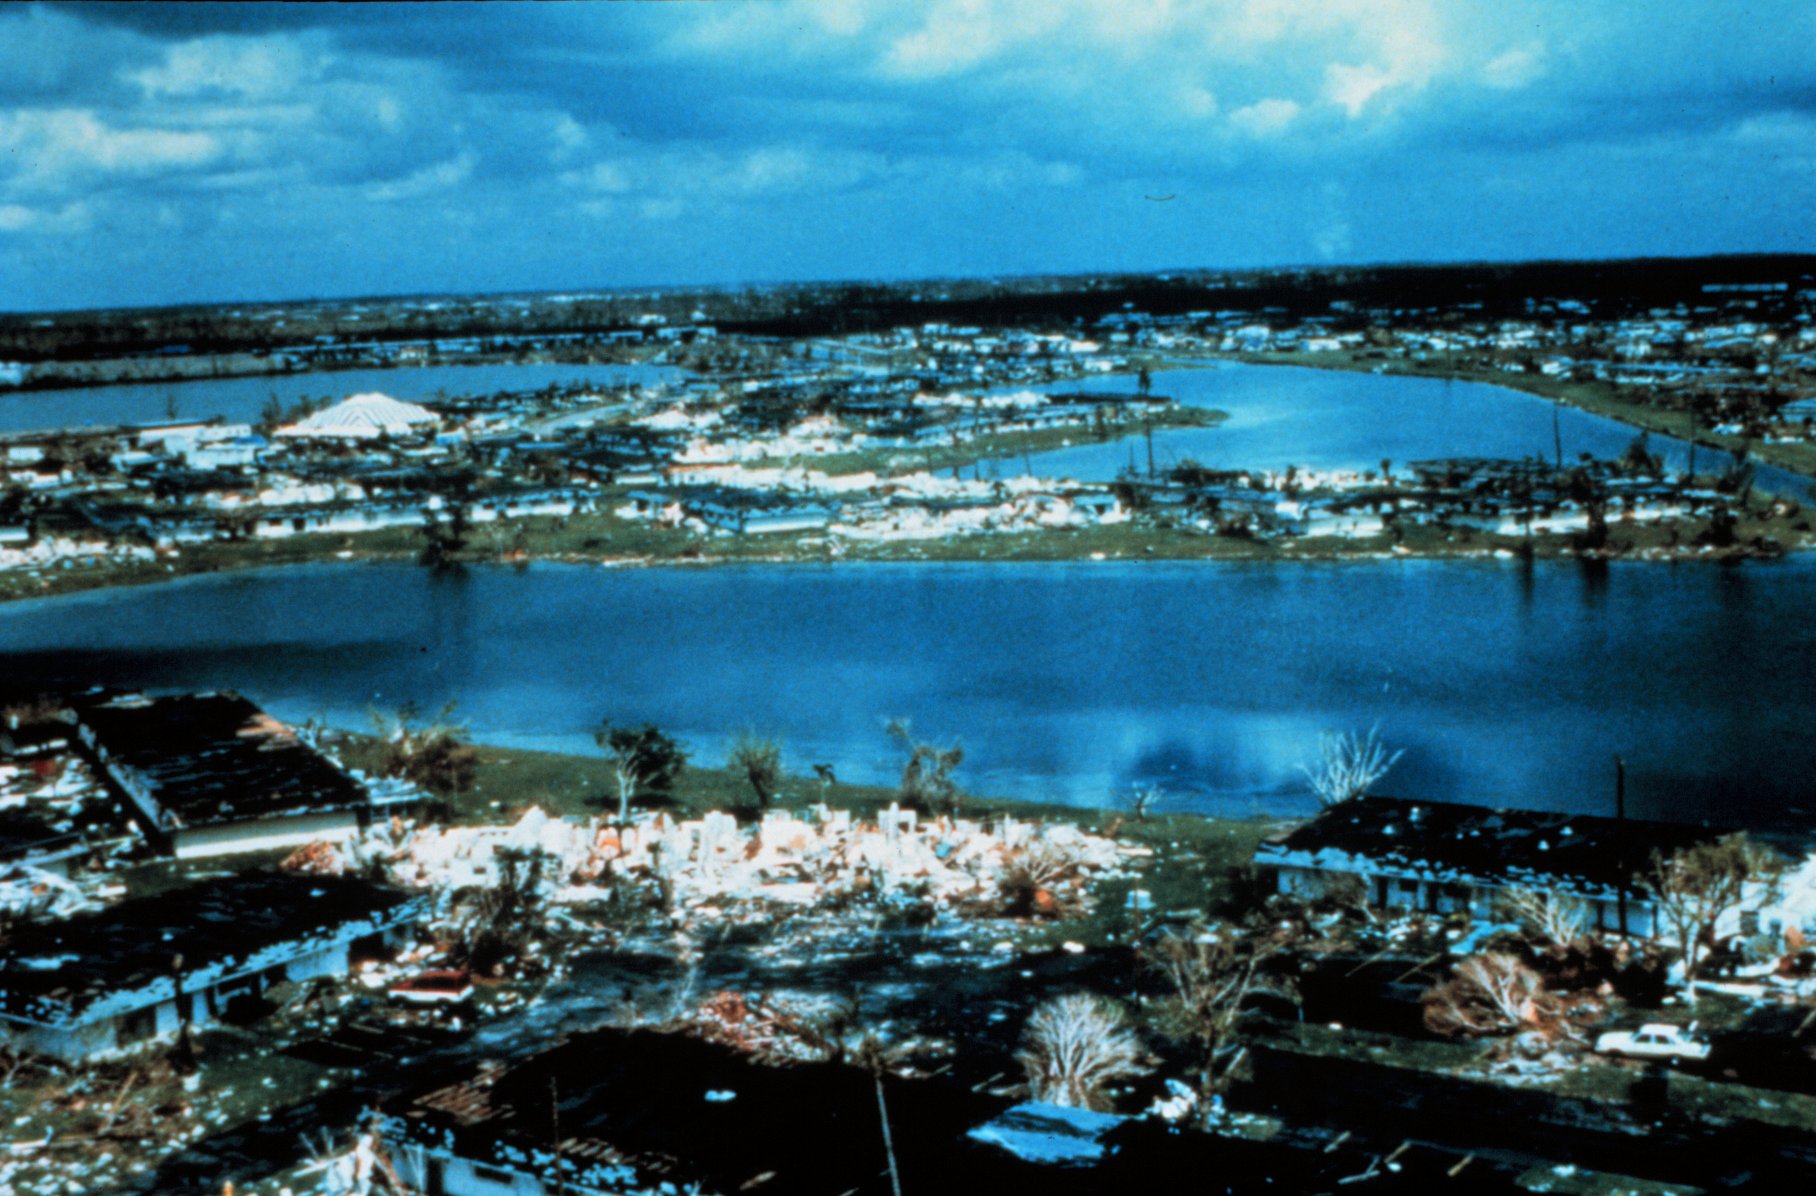
To get a feel for the size of the area impacted by Andrew's worst winds, check out this analysis of the storm's wind field from 09Z on August 24, 1992 [43] (credit: Hurricane Research Division). The contours near the center of Andrew are hard to read, but the hurricane-force sustained winds (at least 64 knots, or 74 miles per hour) are confined to the ring of yellow and purple shadings immediately surrounding the eye. That area coincides with the ring of powerful thunderstorms in the eye wall, as seen on this radar image of Andrew as it made landfall [44] (credit: Hurricane Research Division). So, the area that experienced the fastest sustained winds (100 miles per hour or more) was, indeed, pretty small (confined to roughly 10 to 15 miles from the center).
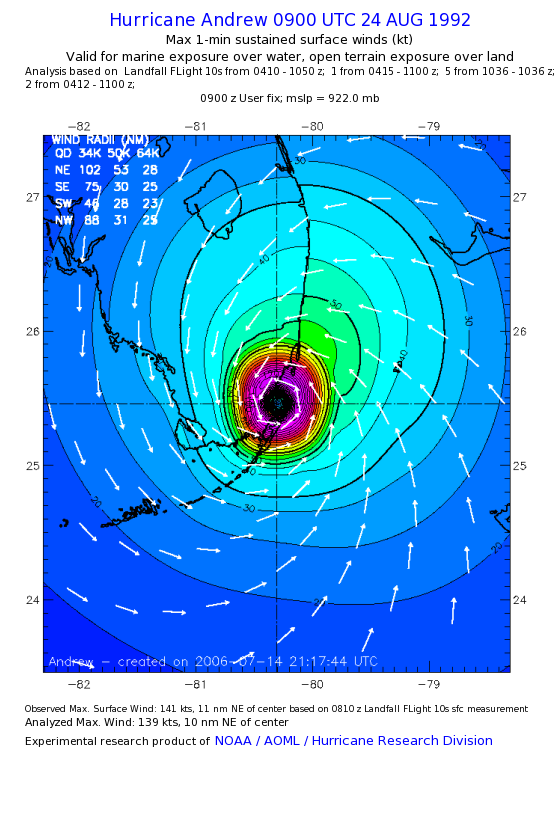
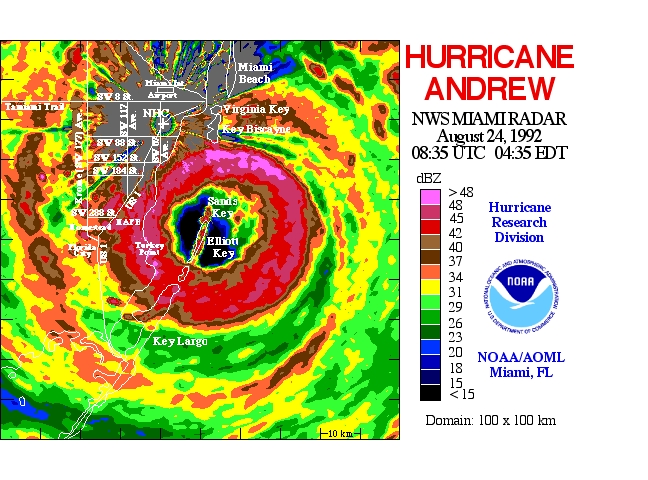
However, while the worst of the wind is typically located in the eye wall of a hurricane, the wind threats don't stop there. Indeed, squalls of heavy, fitful rains and strong gusty winds can occur relatively far from the center of the storm. These squalls, which form away from the eye wall, are called spiral bands. If you're wondering why they're called "spiral" bands, it's because they are relatively long, narrow curves of showers and thunderstorms oriented in the same direction as the wind, which spiral from the periphery of the storm inward toward the core region. This radar image of spiral bands in Hurricane Ivan (2004) [45] is a good example (credit: Hurricane Research Division). The width of spiral bands can vary from five to 50 kilometers, accounting for the abrupt transitions from cloudy, breezy conditions to squally, fitful weather and then back to cloudy, breezy conditions as they pass.
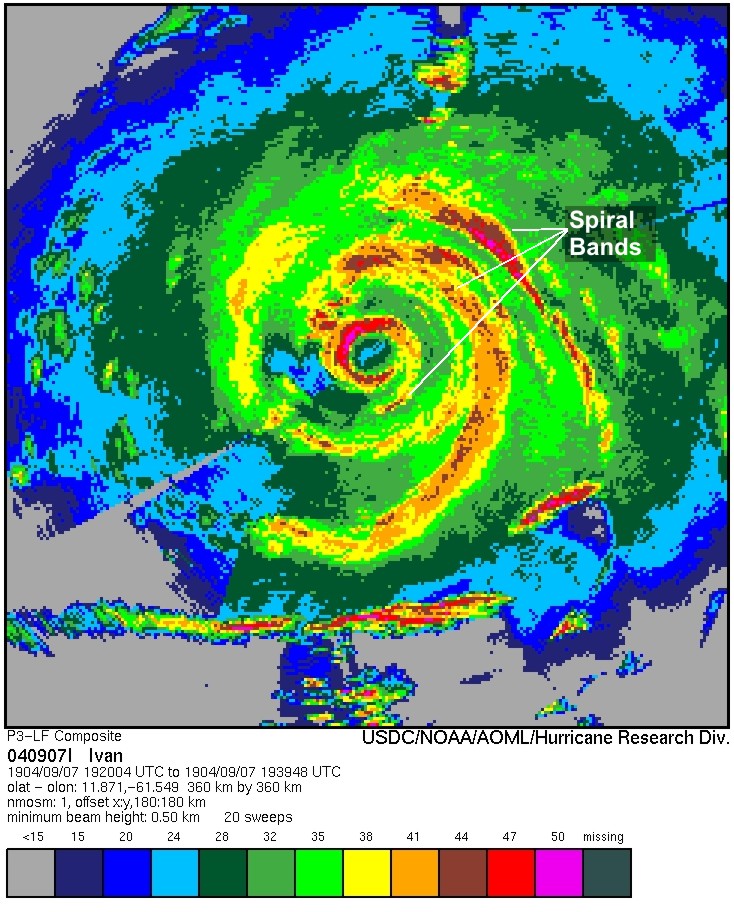
Spiral bands can produce severe wind gusts capable of damage similar to that of a severe thunderstorm, and in stronger hurricanes, can produce wind gusts well over 75 miles per hour. But, damaging straight-line winds aren't the only threat in spiral bands. Meteorologists pay close attention to spiral bands because they play a pivotal role in spawning tornadoes during landfall. Tornado outbreaks are common with landfalling hurricanes (about half of all landfalling tropical cyclones spawn twisters), and most of the tornadoes form in the spiral bands away from the center of the storm.
A good example of a tropical cyclone that was a prolific tornado producer as it made landfall was Hurricane Ivan (2004) [46]. The storm reports for September 15, 2004 from the Storm Prediction Center [47] show that Ivan spawned 29 tornado reports in Florida and Georgia as it approached the coast. The tornado threat tends to diminish once the tropical cyclone weakens over land, but Ivan was a bit unusual in that it continued to spawn tornadoes well inland. Indeed, just a couple of days later on September 17, Ivan's remnants produced 59 tornado reports [48] (37 of them in Virginia alone) as they moved northeastward over the Mid-Atlantic States [49].
Research has shown that most tornadoes with landfalling tropical cyclones occur in the right-front quadrant of the storm (with respect to its direction of motion). For example, the 29 tornado reports in Florida and Georgia from Ivan's landfall all occurred in the storm's right-front quadrant [50] (the storm was moving toward the north). Why the preference for the right-front quadrant? For starters, the forward speed of the hurricane adds marginally to the overall speed of the wind in the right-front quadrant (although the effect is greater if the storm is moving relatively quickly). Given that the rougher land exerts greater friction on lower-level winds, the environment in the right-front quadrant of landfalling hurricanes boasts very strong vertical wind shear in the lowest one kilometer or so. The strong vertical shear in the right-front quadrant tends to produce horizontal rolls (see schematic below). In areas where upward motion is strongest, horizontal rolls are then tilted vertically, setting the stage for supercell thunderstorms, which as you know, can spawn tornadoes.
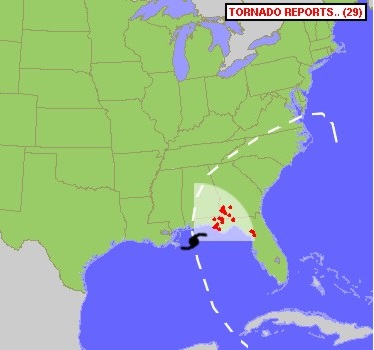

I should point out that the supercells that form in spiral bands are small compared to the monsters that erupt over the Great Plains in spring. As a result, tornadoes that spin up in concert with landfalling hurricanes tend to be "mini tornadoes" (EF-0 or EF-1), and not "maxi tornadoes" (EF-4 or EF-5). Research also suggests that strong vertical shear through deeper layers tends to increase the number and intensity of hurricane-spawned tornadoes. Moreover, faster moving tropical cyclones tend to produces more tornadoes. Given the threat from tornadoes, the Storm Prediction Center often issues tornado watches for the right-front quadrant of all landfalling tropical cyclones, particularly where winds blow onshore within about 500 kilometers of the storm's center.
Water-Related Hazards
While hurricane winds often take the top headlines, the greatest threat to life and property from a hurricane often comes from water, namely storm surge and inland flooding. For the record, the storm surge is a dramatic rise in sea level, primarily as a result of fierce onshore winds pushing water toward shore, where it piles up and then surges inland. Battering waves atop the storm surge exacerbate the damage. The severity of the storm surge at any given location depends on the orientation of the coastline with respect to the storm's track, the intensity, size, and forward speed of the storm, and the layout of the ocean floor near the coast.
As an extreme example of the destruction that storm surge can bring, check out this photograph of damage in Gulfport, Mississippi [51] (credit: FEMA / Mark Wolfe) from Hurricane Katrina (2005). The storm surge in parts of Gulfport reached levels nearly 30 feet high, which was more than enough to completely destroy many buildings along the coast. For a first-hand look at the dangers of storm surge, I recommend this video taken in Gulfport [52] on the day that Katrina made landfall (it's worth a look if you didn't watch it when I referenced it at the beginning of the lesson). The greatest threat from storm surge often occurs in the right-front quadrant as a storm makes landfall, where onshore winds are the strongest and can most effectively push ocean water onshore.
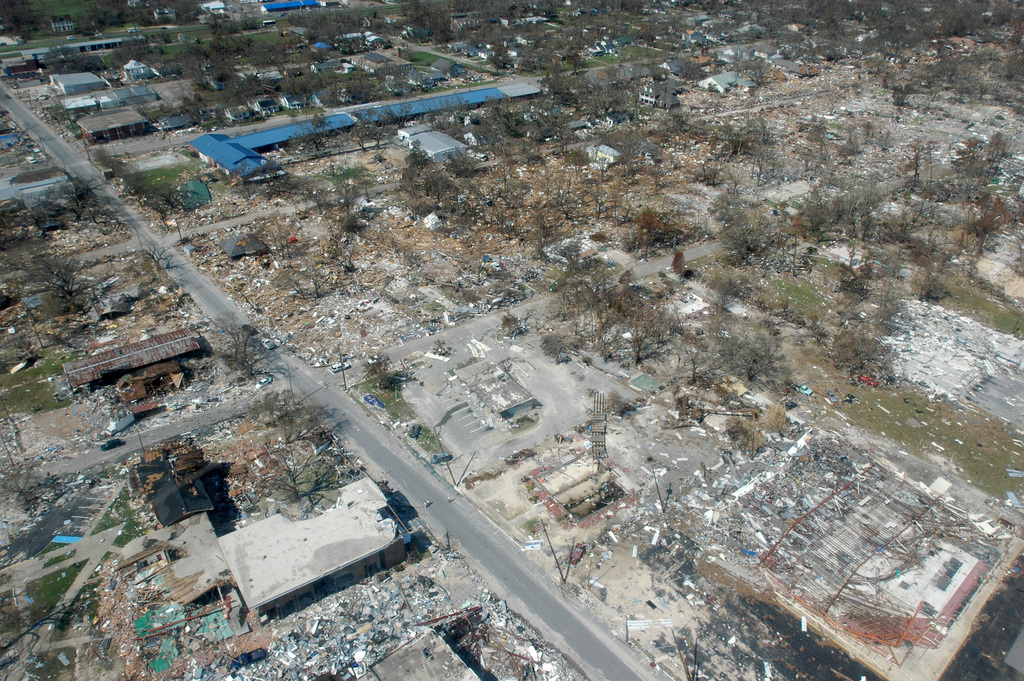
But, storm surge isn't the only water-related threat associated with tropical cyclones. Another water-related hazard exists well inland after a tropical cyclone makes landfall -- flooding from persistent heavy rain. Perhaps the best example of flooding from a tropical cyclone's heavy rainfall is from Hurricane Harvey (2017). Harvey made landfall near Corpus Christi, Texas on August 25, 2017 as a Category 4 hurricane, but stalled and meandered over southeast Texas. Several days of relentless heavy rain [53] in the Houston and Beaumont areas led to unprecedented flooding. As shown in the rainfall analysis below, as much as 40 to 60 inches of rain fell in parts of southeast Texas, causing widespread, catastrophic flooding (check out a photo gallery from the National Weather Service [54]).

But, don't fall into the trap of automatically assuming that only the strongest tropical cyclones (hurricanes and typhoons) cause serious inland flooding. Between June 5, 2001 and June 9, 2001, Tropical Storm Allison approached, made landfall, and lingered over eastern Texas as a tropical depression. During that time, sections of Harris County (which contains Houston), received over 35 inches of rain [55] (credit: National Weather Service) and that's from a storm that was never a hurricane. Despite the fact that Allison was "only" a tropical storm, its impacts were devastating [56] (credit: NOAA photo library). Whenever a tropical cyclone moves slowly, the risks for flooding increase. The flooding risk also increases if the storm makes landfall in a mountainous area, as orographic lifting can increase rainfall totals and runoff, and / or if conditions have been wet previously, leading to wet soil and high water levels in rivers, streams, lakes, etc., even before the rain associated with a tropical cyclone arrives.
Given the dangers posed by water in tropical cyclones, does classifying storms using the Saffir-Simpson Scale (which is based solely on maximum sustained winds) adequately communicate the threats posed by an approaching hurricane? We'll discuss that topic in the next section.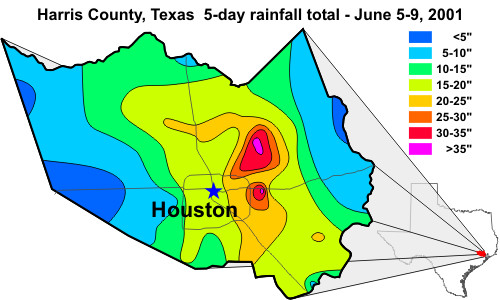
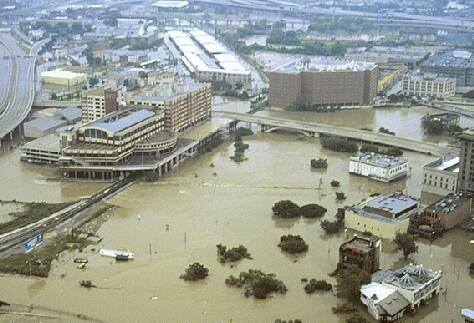
Tropical Cyclone Destructive Potential
Prioritize...
From this page, you should be able to describe strengths and limitations of the Saffir-Simpson Scale, and be able to discuss why the Saffir-Simpson Scale is sometimes not an adequate descriptor of a hurricane's destructive potential.
Read...
Of all the landfalling hurricanes in U.S. history, Hurricane Camille (1969) [57] holds legendary status. Camille was a Category-5 storm on the Saffir-Simpson Scale that slammed into the central Gulf Coast near the mouth of the Mississippi River [58] around midnight on August 18 with a monstrous storm surge, and was one of only a handful of landfalling hurricanes in the United States to have wind gusts at or above 190 miles per hour.
Camille's storm surge was accentuated by the fact that much of the Gulf Coast is quite vulnerable to larger storm surges because of the characteristics of the sea floor near the coast. Indeed, Camille's storm surge exceeded 30 feet along the Mississippi Coast, and flattened everything in its path (these infamous before and after photographs of the Richelieu Apartments [59] in Pass Christian, Mississippi tell the story).
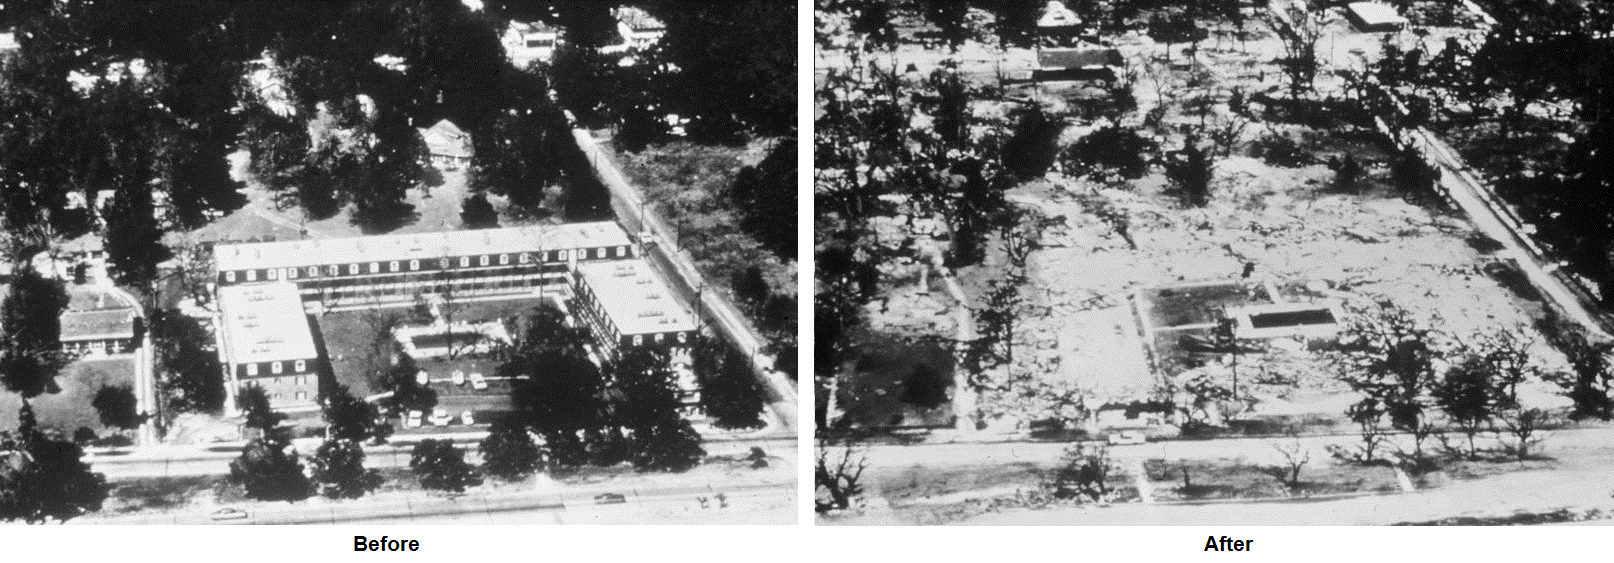
Yet, despite Camille's impressive meteorological statistics (it's one of only a few Category-5 storms to make landfall in the U.S.) and devastation along its path, Camille is not even in the top-10 most destructive hurricanes in U.S. history. Why? By most standards, Camille was a small, compact hurricane. The reanalysis of the wind field around Hurricane Camille at 0430Z on August 18, 1969 (below) indicates that hurricane-force winds were confined to less than 60 nautical miles (about 69 miles) from the storm's center in all directions. In other words, Camille was a violent, but tiny hurricane. The hardest hit areas in the eye wall and nearby were decimated, but that area was relatively small.

Compare Camille's compact wind structure to the landfalling Hurricane Katrina at 12Z on August 29, 2005 [60], which had hurricane-force winds extending out to 117 nautical miles (about 135 miles) in the storm's southeast quadrant. While Katrina's maximum sustained winds were less than Camille's, Katrina was a larger, much more destructive storm, killing more than 1,500 people in Louisiana and Mississippi and inflicting 106 billion dollars in damage (adjusted for inflation to 2010). By comparison, Camille killed 259 people and caused 9.3 billion dollars in damage (adjusted for inflation to 2010).
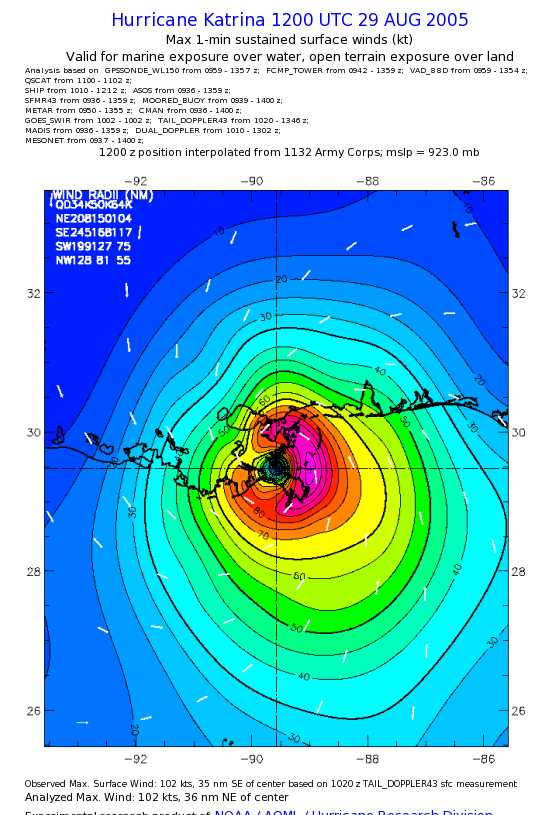
So, Hurricane Katrina (a Category-3 storm at landfall) was more than ten times as costly compared to Hurricane Camille (a Category-5 storm), and was responsible for many more deaths. Granted, to a large extent, the number of people killed by tropical cyclones depends on the population of the area in the vicinity of landfall as well as the risk perceived by coastal residents (whether or not they choose to evacuate). Indeed, Katrina was rated as a Category-3 storm as it approached the central Gulf Coast, and there were likely coastal residents who did not evacuate because they didn't perceive Katrina to be as great a threat as a Category-5 storm like Camille. Despite its Category-3 rating, Katrina remains one of the most devastating natural disasters to ever occur in the United States. So, did Katrina's Category-3 rating adequately convey the dangers of the storm to the public?
Evidence shows that a tropical cyclone's maximum sustained wind speed and Saffir-Simpson Scale rating are not necessarily reliable indicators of the destructive potential of the landfalling storm. Moreover, it's pretty clear that the size of the storm really matters in the overall damage inflicted by a landfalling tropical cyclone. Indeed, while the Saffir-Simpson Scale is the "standard" way that hurricanes are rated and their threats communicated to the public, it's pretty clear that the scale has some shortcomings. To better understand these shortcomings, we have to briefly discuss a little about the history of the scale.
Shortcomings of the Saffir-Simpson Scale
As it turns out, the Saffir-Simpson Scale originally included guidelines for more than just the maximum sustained winds in a hurricane. In 1969, a civil engineer, Herbert Saffir, who was inspired by the Richter earthquake magnitude scale, created a hurricane scale designed to indicate hurricane intensity and the damage potential associated with a tropical cyclone. Robert Simpson, then the acting director of the National Hurricane Center, also incorporated storm-surge data in order to indicate the potential for flooding. In the most basic sense, the Saffir-Simpson Scale originally attempted to cover the bases for emergency hurricane response for damage based on winds and surge flooding, although the scale never accounted for potential flooding from heavy rain.
But, Hurricane Katrina's nearly 30-feet of surge into Mississippi was more than twice that indicated for a Category-3 storm in the Saffir-Simpson Scale (and was on par with the surge from Camile, a Category-5 hurricane). Just three years later in 2008, history repeated itself with Hurricane Ike (see the infrared satellite image near landfall below). Like Katrina, Ike was a large storm. The surface wind analysis at 0730Z on September 13, 2008 [61] indicated that the radius of Ike's hurricane-force winds extended out nearly 100 miles in both eastern quadrants near landfall. But, with maximum sustained winds around 89 knots, Ike only qualified as a Category-2 storm on the Saffir-Simpson Scale. Still, Ike created a storm surge of up to 17 feet on the Bolivar Peninsula near Galveston, Texas [62], which greatly exceeded the storm-surge guidance included in the Saffir-Simpson Scale for a Category-2 storm. Accordingly, damage from Ike along the Bolivar Peninsula was immense, as these before and after photographs [63] (credit: USGS) indicate.
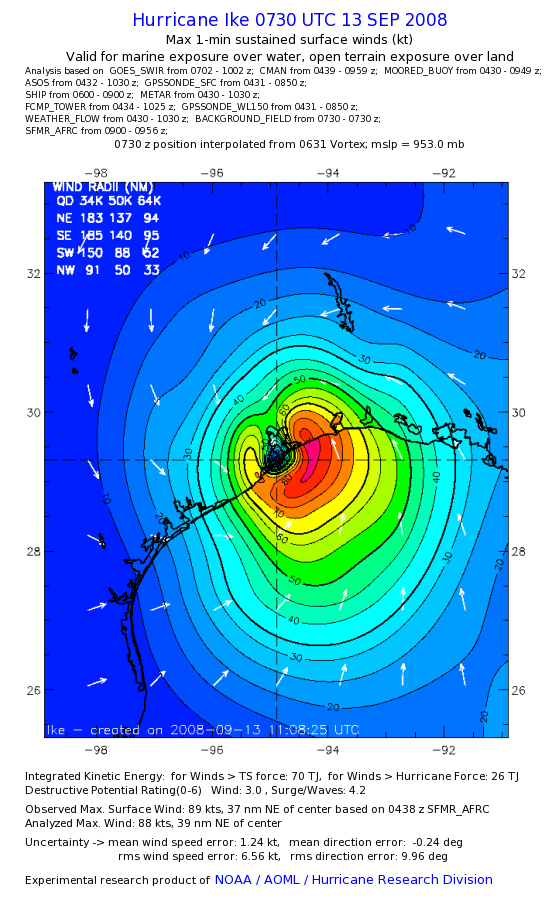
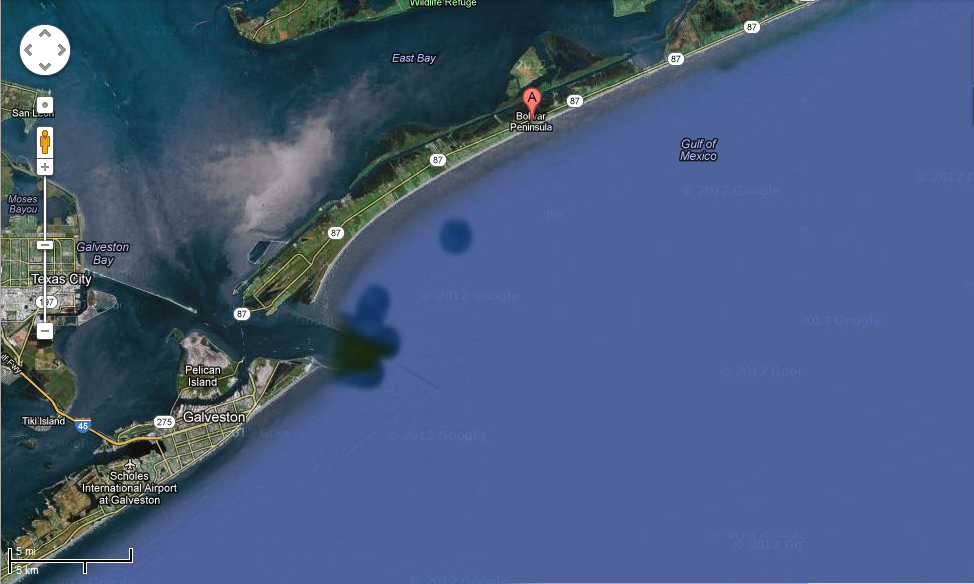
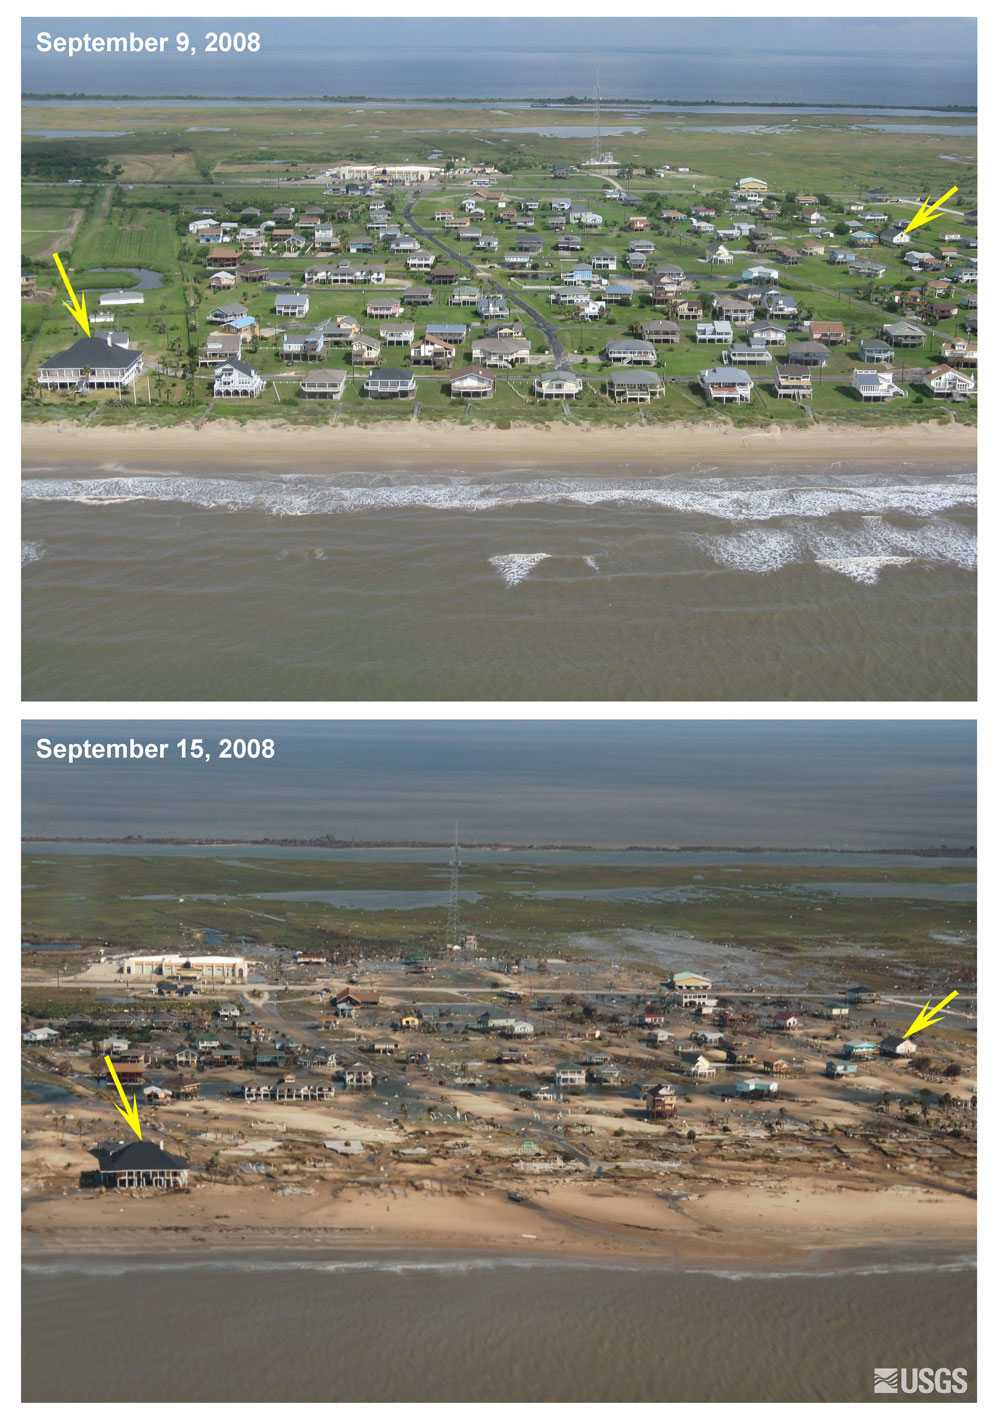

After the storm surges and resulting damage from Ike and Katrina failed to remotely align with the storm surge guidelines in the Saffir-Simpson Scale, the National Hurricane Center formally decided to drop storm surge potential from the scale in 2009, making it the purely wind-based scale we have today. So, the Saffir-Simpson scale rating of a storm really tells us nothing about its damage potential from storm surge (a big limitation). Another issue is the public perception of Saffir-Simpson categories and their impacts. A reduction of one mile per hour below the threshold of a Category-4 storm, for example, would cause the storm to be downgraded to a Category-3 hurricane. The perception might be that the "weakened" storm poses less of a threat (because it's "only" a Category 3), when in reality, the risk remains just as great. Yes, forecasters try to compensate by using expressions such as a "strong Category-3 hurricane," but there's a lot of room for misinterpretation by the general public.
So, it's pretty clear that a particular hurricane's destructive potential includes much more than the Saffir-Simpson Scale rating alone can convey. In the last couple of decades, it's become clear that when it comes to hurricane damage, size does matter! Wind damage depends on the kinetic energy of the moving air, which means that it depends on the wind speed squared. The consequence is that larger hurricanes with larger wind fields pack a lot more wind energy, which leads to more severe damage over a larger area. Furthermore, hurricanes with larger wind fields can push more ocean water onshore, worsening storm surge damage.
With these ideas in mind, researchers have developed several scales and indices to more comprehensively convey a hurricane's destructive potential, but none of them have really caught on with the general public. One calculation to assess a hurricane's damage potential is called Integrated Kinetic Energy (IKE), which essentially uses the surface wind field to add together the kinetic energy of tiny pieces of the storm into total value (the "Integrated Kinetic Energy"). Of course, by adding up all the kinetic energy over the storm's domain, a proxy for storm size is built into the calculation (all else being equal, a larger storm will have more IKE).
On the plot below, compare the IKE for Hurricane Katrina at landfall in Louisiana (seventh storm from the right) with Hurricanes Andrew and Camille (fourth and sixth storms from the left). Both of these Category-5 hurricanes had much lower IKE values than Katrina at landfall in Louisiana because they were much smaller storms. How would the public have judged the risks from Katrina differently if they knew that its damage potential was significantly higher than past Category-5 storms like Camille and Andrew?

Ultimately, IKE gives a better indication of a storm's damage potential, especially from storm surge, since the size and intensity of the wind field are both included in the calculation. While there's some debate among meteorologists about the best ways to communicate the damage potential from any given storm to the general public (IKE and other alternative damage potential scales haven't caught on), in the meantime, the Saffir-Simpson Scale likely isn't going anywhere because of its simplicity and the public's familiarity with it. However, it's pretty clear that for large tropical cyclones, the Saffir-Simpson rating might not accurately convey the potential for wind and surge damage. Keep that in mind if a hurricane is approaching your area.
Summary
- The Saffir-Simpson Scale only depends on the maximum sustained wind speed in a hurricane (usually in a small area within the eye wall). It provides no information about the size of the storm, about potential damage from storm surge, or about potential for flooding from heavy rain.
- All else being equal, larger hurricanes generally have greater damage potential because their larger wind fields pack much more energy and can help create greater storm surge. Thus, Saffir-Simpson Scale ratings for particularly large hurricanes often don't convey the true damage potential.
- The hard cut-offs of the Saffir-Simpson Scale categories can be misinterpreted by the public (in reality there's very little difference between a "strong Category-3 hurricane" and a hurricane that barely meets the Category 4 wind-speed threshold, for example).
- Alternative metrics (like Integrated Kinetic Energy), which include storm size and total energy from the storm's wind field, better assess the true damage potential from the winds and storm surge of a tropical cyclone, but the public is not very familiar with them.
If you live in a hurricane-prone area, or ever find yourself facing the prospects of dealing with a landfalling tropical cyclone, I urge you to pay close attention to the weather forecast (not just from your weather app), and follow the directives of local authorities any time a tropical cyclone threatens. If a mandatory evacuation is issued for your area, it's for a good reason. By staying, you're putting your own life at great risk, as well as the lives of any first responders who may have to rescue you. If you're looking for more information about tropical cyclones that may impact the Americas, the National Hurricane Center [40] website is a good resource, where you can get forecasts and read discussions written by forecasters at the National Hurricane Center (for some "behind the scenes" thoughts). I hope this lesson helps you better understand tropical cyclones, how they work, and how to stay safe should one affect your area.
Links
[1] https://www.e-education.psu.edu/meteo3/sites/www.e-education.psu.edu.meteo3/files/images/lesson10/costliest_disasters.png
[2] https://www.youtube.com/embed/133F6-5qi2w?rel=0
[3] https://www.youtube.com/watch?v=-Kou0HBpX4A&t?rel=0
[4] http://en.wikipedia.org/wiki/National_Weather_Service_bulletin_for_New_Orleans_region#Bulletin_text
[5] https://www.e-education.psu.edu/meteo3/sites/www.e-education.psu.edu.meteo3/files/images/lesson12/chris_et_cyclone.gif
[6] https://en.wikipedia.org/wiki/Tropical_Storm_Allison
[7] https://www.e-education.psu.edu/meteo3/sites/www.e-education.psu.edu.meteo3/files/images/lesson12/pac_basin0104.gif
[8] https://www.e-education.psu.edu/meteo3/sites/www.e-education.psu.edu.meteo3/files/images/lesson12/jun_nov_sst.png
[9] https://www.e-education.psu.edu/meteo3/sites/www.e-education.psu.edu.meteo3/files/images/lesson12/tc_regions0104.gif
[10] https://www.e-education.psu.edu/meteo3/sites/www.e-education.psu.edu.meteo3/files/images/lesson12/aug_oct_sst.png
[11] https://www.e-education.psu.edu/meteo3/sites/www.e-education.psu.edu.meteo3/files/images/lesson12/activity0702.gif
[12] https://www.e-education.psu.edu/meteo3/sites/www.e-education.psu.edu.meteo3/files/images/lesson12/statistics_epac0702.gif
[13] https://www.e-education.psu.edu/meteo3/sites/www.e-education.psu.edu.meteo3/files/images/lesson12/sstclimo_may0702.gif
[14] https://www.e-education.psu.edu/meteo3/sites/www.e-education.psu.edu.meteo3/files/images/lesson12/nw_pac_annual_sst.png
[15] https://en.wikipedia.org/wiki/West_Indies
[16] https://www.nhc.noaa.gov/aboutnames.shtml
[17] https://en.wikipedia.org/wiki/Typhoon_Haiyan
[18] https://wmo.int/content/tropical-cyclone-naming
[19] https://www.e-education.psu.edu/meteo3/sites/www.e-education.psu.edu.meteo3/files/images/lesson12/charley0702.jpg
[20] https://www.e-education.psu.edu/meteo3/sites/www.e-education.psu.edu.meteo3/files/images/lesson12/danielle_bonnie_tracks0703.gif
[21] https://en.wikipedia.org/wiki/Tropical_Storm_Vamei
[22] https://www.e-education.psu.edu/meteo3/sites/www.e-education.psu.edu.meteo3/files/images/lesson12/singapore.png
[23] https://www.e-education.psu.edu/meteo3/sites/www.e-education.psu.edu.meteo3/files/images/lesson11/ramage_monsoon_regions.png
[24] https://www.e-education.psu.edu/meteo3/sites/www.e-education.psu.edu.meteo3/files/images/lesson12/Aug27_2010_750px.jpg
[25] https://www.e-education.psu.edu/meteo3/sites/www.e-education.psu.edu.meteo3/files/images/lesson12/wilma_eye0105.png
[26] https://www.e-education.psu.edu/meteo3/sites/www.e-education.psu.edu.meteo3/files/images/lesson12/entrainment.png
[27] https://www.youtube.com/embed/KIsUdUYqWjA?rel=0
[28] https://www.e-education.psu.edu/meteo3/sites/www.e-education.psu.edu.meteo3/files/images/lesson12/watervapor0705.gif
[29] https://en.wikipedia.org/wiki/Brown_ocean_effect
[30] https://www.youtube.com/embed/oxgaFo7pcbs?rel=0
[31] https://www.e-education.psu.edu/meteo3/sites/www.e-education.psu.edu.meteo3/files/images/lesson12/Stadium%20007.jpg
[32] https://www.e-education.psu.edu/meteo3/sites/www.e-education.psu.edu.meteo3/files/images/lesson12/st_lan.gif
[33] https://www.e-education.psu.edu/meteo3/sites/www.e-education.psu.edu.meteo3/files/images/lesson12/maria_zoom_eye.gif
[34] https://www.e-education.psu.edu/meteo3/sites/www.e-education.psu.edu.meteo3/files/images/lesson12/tracks-at-2011.png
[35] https://www.e-education.psu.edu/meteo3/sites/www.e-education.psu.edu.meteo3/files/images/lesson12/800px-Location_Cape_Verde_AU_Africa.svg.png
[36] https://www.e-education.psu.edu/meteo3/sites/www.e-education.psu.edu.meteo3/files/images/lesson12/IRENE.track.gif
[37] https://en.wikipedia.org/wiki/1938_New_England_hurricane
[38] https://www.nhc.noaa.gov/verification/figs/ALtkerrtrd_noTD.jpg
[39] https://www.e-education.psu.edu/meteo3/sites/www.e-education.psu.edu.meteo3/files/images/lesson12/CNg07GwWEAAkjZT.jpg%20large.jpg
[40] https://www.nhc.noaa.gov/
[41] https://www.e-education.psu.edu/meteo3/sites/www.e-education.psu.edu.meteo3/files/images/lesson12/hurricane-andrew-damage_1200x480-noaa-photo-library.png
[42] https://www.e-education.psu.edu/meteo3/sites/www.e-education.psu.edu.meteo3/files/images/lesson12/wea00552.jpg
[43] https://www.e-education.psu.edu/meteo3/sites/www.e-education.psu.edu.meteo3/files/images/lesson12/AL021992_0824_0900_contour04.png
[44] https://www.e-education.psu.edu/meteo3/sites/www.e-education.psu.edu.meteo3/files/images/lesson12/andnewradar.JPG
[45] https://www.e-education.psu.edu/meteo3/sites/www.e-education.psu.edu.meteo3/files/images/lesson12/ivan_radar_lg1004.jpg
[46] https://en.wikipedia.org/wiki/Hurricane_Ivan
[47] https://www.e-education.psu.edu/meteo3/sites/www.e-education.psu.edu.meteo3/files/images/lesson12/ivan_reportsa1005.gif
[48] https://www.e-education.psu.edu/meteo3/sites/www.e-education.psu.edu.meteo3/files/images/lesson12/ivan_reportsb1005.gif
[49] https://www.e-education.psu.edu/meteo3/sites/www.e-education.psu.edu.meteo3/files/images/lesson12/ivan_radar1005.gif
[50] https://www.e-education.psu.edu/meteo3/sites/www.e-education.psu.edu.meteo3/files/images/lesson12/rfq_tornadoes1005.jpg
[51] https://www.e-education.psu.edu/meteo3/sites/www.e-education.psu.edu.meteo3/files/images/lesson12/gulfport_ms_katrina.jpg
[52] https://www.youtube.com/watch?v=-Kou0HBpX4A&t%3Frel=0
[53] https://www.youtube.com/embed/8ox0DI0D_vg?rel=0
[54] https://www.weather.gov/hgx/hurricaneharvey#photos
[55] https://www.e-education.psu.edu/meteo3/sites/www.e-education.psu.edu.meteo3/files/images/lesson12/allison_rain.jpg
[56] https://www.e-education.psu.edu/meteo3/sites/www.e-education.psu.edu.meteo3/files/images/lesson12/Allison_Flood_Houston.jpg
[57] http://en.wikipedia.org/wiki/Hurricane_Camille
[58] https://www.e-education.psu.edu/meteo3/sites/www.e-education.psu.edu.meteo3/files/images/lesson12/camille1969trk.gif
[59] https://www.e-education.psu.edu/meteo3/sites/www.e-education.psu.edu.meteo3/files/images/lesson12/richelieu_apts_before_after.png
[60] https://www.e-education.psu.edu/meteo3/sites/www.e-education.psu.edu.meteo3/files/images/lesson12/AL122005_0829_1200_contour08_2.png
[61] https://www.e-education.psu.edu/meteo3/sites/www.e-education.psu.edu.meteo3/files/images/lesson12/AL092008_0913_0730_contour08.png
[62] https://www.e-education.psu.edu/meteo3/sites/www.e-education.psu.edu.meteo3/files/images/lesson12/Bolivarisland.png
[63] https://www.e-education.psu.edu/meteo3/sites/www.e-education.psu.edu.meteo3/files/images/lesson12/Ike_PhotoPair_crystal_bch_TX_Loc4LG.jpg