Lesson 13: Becoming a Savvy Weather Consumer
Motivate...

Perhaps you've heard the old saying that, "weather forecasters are the only people who can be wrong half the time and still get paid." By the way, exactly zero meteorologists find this joke funny or original; we've all heard it thousands of times. I've also overheard plenty of conversations that go something like this, "They said it was going to rain today, but it didn't rain at all. They are always wrong!" Ouch! Meteorologists "don't get any respect" in some circles, much like Rodney Dangerfield [3].
But how true are these statements? Most folks just don't realize how much complex science is involved in making good forecasts (although I hope, after finishing this course, you have a basic idea). Throwing darts or flipping coins won't cut it, despite what some say! In reality, weather forecasts have never been better, and every day, individuals and organizations rely on reasonably accurate weather forecasts to make life- and money-saving decisions, not to mention decisions to maximize personal comfort (whether or not to wear a coat, take an umbrella, etc.).
So, why do weather forecasters have such a bad rap in some circles? Well, let's start with the obvious. Despite the improvements in weather forecasts over the years, they aren't perfect, and they can be very wrong on occasion (although it really doesn't happen very often). But, it's more complicated than that. In the example I used above, who are "they" in "They said it was going to rain today?" Where did this person actually get their weather forecast? Was it from a mobile weather app? A weather forecaster on television? Social media? Was the forecast even made by a professional meteorologist? Did the forecast say it would definitely rain, or was the forecast misinterpreted?
Today, people consume weather information and forecasts from so many sources -- the National Weather Service (in the United States), local television stations, social media, and various private weather companies that produce forecasts for radio stations, newspapers, websites, and mobile weather apps, just to name a few. In this way, we are all "weather consumers," and your sources really matter when it comes to finding quality forecasts and other weather information. You see, not all forecasts are created equal; the weather forecast on your mobile app may have been created very differently than a forecast communicated on television by a meteorologist, for example. The age of social media has further complicated matters because of how fast information spreads. It's sometimes not easy to tell whether a particular person or organization on social media truly has expertise and experience in meteorology, and weather "hype" can spread quickly when people share information that is incorrect or not communicated clearly.
In this lesson, we're going to talk about how you can become a more savvy weather consumer. To do so, you need a basic understanding of how weather forecasts are made, how accurate weather forecasts are (on average), how to interpret them, and how you can find trusted, reliable sources of weather information. Sorting out all of the sources and types of weather forecasts can be somewhat confusing, and I think some of that confusion contributes to the perception that weather forecasts aren't as good as they really are. So, without further delay, let's get started!
When Weather Made History
Prioritize...
When you've finished this section, you should be able to discuss the primary challenges faced by weather forecasters in the pre-satellite era, as well as be able to define analog forecasting and discuss its current uses in meteorology.
Read...
Today, most people are used to accessing weather forecasts just about anywhere -- on their mobile devices, on radio, television, a particular website, etc. Not only can we easily access weather forecasts, we can get a weather forecast for just about any point on Earth! Global forecasts are so easily accessible thanks to the wonders of computers. Computer models ingest all sorts of observational data from surface weather stations, satellite, and radar, and use that initialization data as a basis to simulate the future evolution of the atmosphere. Without these models, weather forecasts as we know them would be very different. We'll study a bit more about what these "computer models" entail later in this lesson, but before that, I want to go back in time, to an era when weather forecasts weren't so easily accessible, and certainly weren't as easy to create.
The TIROS-1 weather satellite was launched in 1960, and the amount of satellite data available to weather forecasters has grown vastly since then. Today, satellites play a huge role in providing computer models with initial information about the state of the atmosphere. But, before the era of satellites and computer models, creating a weather forecast was a very different endeavor. To better understand the challenges that weather forecasters faced in the "good old days," let's focus on perhaps the most important weather forecast in history -- the forecast for the D-Day Invasion [4] in World War II in June, 1944.
Planning for the Allied invasion of France actually began two years earlier, and as you can imagine, the planning for the initial landing (more than 150,000 troops) on the beaches of Normandy [5] in northern France was a massive undertaking. Military planners knew that a successful invasion was weather dependent, and the requirements were complex. For example, naval forces needed to avoid strong winds and rough seas, which could capsize small landing boats and cause larger ships to drift from their assigned positions. Visibility needed to be at least 3 miles so that gunners on ships could see their targets. The air forces included high-altitude bombers, which preferred little or no cloud cover, while low-altitude bombers preferred clouds near 3,000 feet, so that they could zoom up into the clouds and be obscured from view after they dropped their bombs. But, very low clouds and fog were problematic for the air forces because bombers wouldn't be able to see their targets (and neither would troops landing from the air). The requirements of the Allied armies were less stringent, but they preferred not to have heavy rain, which would impede the movement of tanks and other large vehicles.
General Dwight Eisenhower, supreme commander of the Allied Forces in Europe, also wanted a full moon (to make landing targets and obstacles easier to see) and low tide (to expose the underwater defenses of the German forces) for the pre-dawn invasion. The combination of a nearly full moon and low tide was available on June 5, 6, or 7, 1944. If those days didn't work, the next time when low tides would be timely was June 19 and 20. Knowing ahead of time that one of those days would have favorable weather conditions with today's technology is one thing. But, doing so in an era with no satellite data, no computer models, and relatively few surface observations is quite another. Yet, that's what forecasters set out to do.

The Allies had a few teams of meteorologists working on the forecast, but the top meteorological advisor to General Eisenhower was Group Captain James Stagg of the British Royal Air Force. The teams of meteorologists were attempting to make five-day forecasts (a huge feat then) in preparation for the attack, although the forecasters advised military commanders that they had much less confidence in their forecasts beyond one or two days. To have any chance at a successful forecast, the meteorologists needed weather observations. As you know, weather systems in the middle latitudes tend to move from west to east, and with the vast North Atlantic Ocean located to the west of the European continent [5], there weren't many weather observations "upstream" from Europe. Therefore, the Allies flew weather reconnaissance missions over the North Atlantic and stationed ships to take weather observations in the oceans to help fill in the wide gaps in weather observations that existed. The Axis powers did the same, because they, too, recognized the importance of these observations to creating reasonably accurate weather forecasts for successful operations.
The Allies were even able to intercept the weather reports from German U-boats since they had cracked the Germans' code, and with all of the weather observations they could muster (still relatively few by today's standards), meteorologists were able to analyze weather maps to find centers of high and low pressure, warm fronts, cold fronts, etc. The team of American meteorologists relied heavily on their analysis of these observations to create analog forecasts. The theory of analog forecasts boils down to the idea that the behavior of the atmosphere tends to repeat itself over time. Therefore, if you can compare historical weather patterns to current conditions, you can create a successful forecast. Analog forecasting can be a useful technique, and it's actually still used today, primarily in making general, long-range forecasts (more than a week into the future). But, analog forecasting isn't great for making a detailed, short-term forecast.
Two British teams of meteorologists used a different technique for their forecasts. They used the weather observations and the developing body of knowledge about how mid-latitude cyclones work (which we covered the basics of previously) to try to predict the evolution of the atmosphere. With multiple teams of meteorologists working on the forecast, limited observational data, and different forecasting methods, the forecasters had many disagreements.
Initially, the attack was planned for June 5, the first day with the full moon and low-tide conditions that Eisenhower desired, and the American meteorologists believed that the weather on June 5 would be fine. The teams of British meteorologists were less enthusiastic about the weather on June 5. The weather in late May and early June leading up to the planned attack had largely been ideal, but the British meteorologists suspected that was about to change based on their analysis. After much debate and argument, the teams of meteorologists reached a consensus, and on June 4, Group Captain James Stagg advised General Eisenhower to delay the planned attack for June 5 because it would be too windy, with low overcast clouds. The expected conditions would make it impossible for paratroopers to land on their marks, and would prevent gunners and bombers from seeing and hitting their targets.
It was a good call. The weather on June 5 was too harsh for a successful attack. But, what about the next day? Again, there was some disagreement. The American team of forecasters believed that a break in the weather would allow the Allies to launch the attack. One of the British teams agreed that the weather on June 6 would improve enough to launch the attack, but the other British team disagreed. They thought that while weather conditions would improve a bit, conditions still would be too harsh.
After intense deliberations, Group Captain Stagg advised General Eisenhower that the forecasters thought the weather would improve on June 6, and while wind speeds may occasionally flirt with the upper-bound of acceptable speeds, the sky should be mostly clear, with perhaps some clouds later in the day. The weather conditions weren't going to be ideal, but they should be good enough, and with that, the operation was a "go."
In the wee hours of June 6, winds occasionally exceeded the maximum threshold set by the naval forces, which led to some soldiers getting seasick as their boats were tossed by the rough waves, but on the morning of June 6, 1944, the largest seaborne invasion in world history commenced. Some small ships wrecked in the rough seas. Planes dropping paratroopers also encountered some unexpected areas of low clouds, which caused a number of the paratroopers to land well off target. But the wind and waves were manageable for most ships and soldiers, and most were able to land, even though the weather conditions weren't ideal. Conditions were just good enough, and by the end of the day, the Allies controlled five beachheads.

The attack was successful in part because its timing surprised the German forces. German meteorologists also had determined that conditions on June 5 were unsuitable for an attack, and they may have noted that the weather would improve somewhat on June 6, but the Germans didn't think the Allied forces would be able to pull off the attack even with marginally improved weather. They thought conditions would still be a bit too unsettled for Allied boats and planes. In fact, the Germans believed that an attack would be impossible for weeks because of poor weather conditions, and a number of senior German officers were away on training exercises when the attack occurred. German General Edwin Rommel, in charge of the defense of Normandy, was at home in Berlin celebrating his wife's birthday when the attack began.
It's not that the Allies made a better weather forecast than the German forces, but they were willing to launch the attack in conditions that the Germans didn't anticipate. Group Captain Stagg and the teams of Allied meteorologists ultimately gave General Eisenhower useful, actionable information, and given the overall lack of data they had to work with (compared to what we have today), I think it's pretty amazing that they basically got it right (even though the forecast wasn't perfect). Attacking on June 5 would have been a disaster, but the weather on June 6 was just good enough to pull off the attack. And, for what it's worth, the weather during the second available window later in June (June 19-20) ended up being even worse. So, the Allies ended up taking advantage of the only acceptable attack window during June, and the rest is history.
Of course, a lot has changed since then. The advent of satellite imagery really changed the weather forecasting game, as did the invention of computer forecast models, which form the basis of the forecasts you see today. Up next, we'll talk a bit about just what "computer models" are and how they work. Read on!
Computer Simulations
Prioritize...
When you've completed this section, you should be able to define numerical weather prediction, and describe how computer models make forecasts for the future state of the atmosphere. You should also be able to define the domain of a computer model, as well as describe model "initialization."
Read...

Fortunately, technological advances have taken us beyond the days when even an accurate one or two day forecast was an endeavor that required multiple teams of meteorologists and hours of analysis (and bitter arguments). In particular, the advent of satellites and computer models has really helped forecasters "up their game." If you watch any kind of weather coverage on television, I'd bet at some point you probably heard the on-air meteorologists say something like, "We just don't know the path of the storm at the moment because the computer models are not in agreement." So, let's take a closer look at what these "computer models" are, and how they work.
For starters, the formal term given to the creation of weather forecasts using a computer is numerical weather prediction (NWP). The list of instructions and calculations for creating a virtual weather forecast on a computer is the computer model (or just "model" for short). So, just how can a computer be made to forecast the weather? The first thing that you should realize is that a computer knows nothing about the "weather." That is, computer models don't really analyze weather maps like a human meteorologist does. Instead, the computer starts with the current state of the atmosphere (using weather observations from surface weather stations, weather balloons, satellites, etc.) and uses mathematical equations that describe horizontal and vertical air motions, temperature changes, moisture processes, etc. to calculate what the atmosphere might look like at some future time.
Yes, the language of the atmosphere is mathematics, and all of the concepts you have learned about so far in this course (radiation budgets, advection, wind speed, surface pressure, relative humidity, and divergence/convergence just to name a handful) can all be described by equations. Incidentally, students who major in meteorology are typically required to take several semesters of calculus and differential equations so that they can better analyze and "speak the language" of the atmosphere. Some of the equations in a computer model are pretty straightforward, and all of the inputs to the equations are easily measured. Other atmospheric processes are so complex, however, that their equations must be simplified in the model. Regardless of their complexity, these equations can be used together to predict the future state of the atmosphere.
Just to give you a taste for what one of these equations looks like, here's the equation describing temperature advection in one dimension [9], for a case when the wind blows directly across the isotherms. You need not worry about any of the math here, but computer models have to incorporate hundreds of other equations much more complicated than this one in three dimensions in order to predict the weather. Therefore, not surprisingly, it takes a lot of computing power to run a computer model that can predict the future state of the atmosphere. Indeed, the array of supercomputers at the National Weather Service (see photo below) that runs the United States government's suite of computer models can do quadrillions of calculations per second (yes...quadrillions).

Computer models create weather forecasts over their designated domain, or area of the Earth that they cover. Some computer models produce highly-detailed forecasts over very small domain (perhaps just part of a single state), but most computer models create forecasts over larger domains, perhaps for North America and surrounding waters, or even over the entire globe (models with global domains are usually referred to as "global models").
When a model is run, it starts with its set of initialization data, which is the computer's representation of the state of the atmosphere at the time the computer model run begins. The details of model initialization are pretty complicated, but it involves a mathematical scheme to synthesize surface and upper-air observations, satellite data, and other model data (to fill in the gaps where no observations exist) to create a complete representation of the initial state of the atmosphere at the time the model is run. The initialization process is far from perfect, and we'll explore some consequences of that later.
Using the initialization data and the equations the model is programmed with to simulate atmospheric processes, the model calculates values for temperature, dew point, wind speed and direction, vertical air motions, etc. at some short time in the future (say, a couple of minutes) at many points in its domain. The model then takes those predictions and calculates values for the next forecast time (perhaps a couple more minutes into the future), and on and on, until the model run ends. Models making very detailed predictions over small domains may only make forecasts a day or so into the future, while larger domain models, like global models, may make predictions ten days or more into the future. Even with the computers performing quadrillions of calculations per second, a global weather model usually takes a few hours to complete its run.
The end result of all this mathematical manipulation can be quite astounding, and (usually) useful. Yes, even oversimplified models often provide realistic results (even if they're not completely correct). For a non-weather example, check out the numerical simulation below, which is based on a set of equations that describe how simple water waves behave. These equations are used to simulate water in a square, imaginary "bathtub." The waves that you see are generated by an occasional "drip" that splashes down to the surface and sends ripples bounding off the sides of the tub. Looks pretty realistic, doesn't it?

Similar wave models can even be used to predict the evolution of waves in the ocean, like this animation showing a tsunami that devastated Japan [10] on March 11, 2011. Not surprisingly, it takes a more complex model to predict the evolution of a tsunami in the ocean (with varying water depths, shapes of coastlines, etc.) compared to a simple square "bathtub." If you watched the animation, you can attest to how intricate the modeled wave pattern became!
Of course, computer models that predict the future state of the atmosphere are far more sophisticated than a model of shallow water waves because the behavior of the atmosphere is far more complex than that of shallow water waves. But, while numerical weather prediction models can create realistic predictions of the future state of the atmosphere, the predictions are imperfect. In fact, computer model forecasts can be very wrong, especially further into the future. Up next, we'll examine some of the primary flaws in computer model weather forecasts. Read on!
Computer Model Errors
Prioritize...
When you've completed this section, you should be able to describe the three main sources of error in computer model forecasts described in this section (initialization errors, computational errors, and oversimplifications / parameterizations).
Read...
There's no doubt that computers have helped revolutionize weather forecasting, making weather forecasts for anywhere in the world easily accessible and reasonably accurate several days into the future (most of the time). But, for all of the wonders of computer models, their forecasts always contain errors. Remember the quote from British statistician George Box that I mentioned when we discussed general circulation models: "All models are wrong, but some are useful." Well, that idea applies here, too. Indeed, a big part of a weather forecaster's job today is analyzing model forecast data to determine which parts will be useful in making a forecast.
A number of sources of error are present in all computer model forecasts. In this section, I'll focus on three of the biggest sources: errors in the model's initialization, computation errors (errors resulting from the way computers perform calculations), and oversimplifications of some atmospheric processes in the model. Let's start at the beginning, with the model's initialization.
Initialization Errors
In order to create a perfect short-term weather forecast, a computer model would need a perfect representation of the initial state of the atmosphere. In other words, we would need to precisely and accurately measure all relevant atmospheric variables (temperature, dew point, pressure, wind speed and direction, precipitation-rate, etc.) continuously at every single point in the atmosphere. Can we do that? Not even close! And, such perfect and continuous measurements aren't going to happen in the foreseeable future, either.
So, we can't perfectly measure the atmosphere everywhere all the time. That's not surprising, but guess what: The observations we do have aren't perfect, either. Yes, occasionally instruments that measure things like pressure, temperature, and wind speed go awry and take erroneous measurements. This instrumental error is unavoidable, and while meteorologists try to identify and weed out the bad data, catching all of it is practically impossible. So, a little "observational error" sneaks its way into the model's initialization.
Another type of observational error arises from the way observational data are spatially distributed. It turns out that to best solve the equations that predict the future state of the atmosphere, data need to be organized in some evenly spaced manner. Furthermore, the more closely spaced the data, the better. Now take a look at the distribution of official surface observing stations in Europe and parts of Asia (below). Notice the erratic distribution of stations -- some are tightly clustered together, while huge gaps exist between others. But, before a weather model can be run, it needs a more even distribution of data.

A more even distribution of data can be achieved through a mathematical form of estimation called interpolation, but the estimates are imperfect. For example, consider a case where we have two observing stations located 100 miles apart, with temperatures of 50 degrees Fahrenheit and 40 degrees Fahrenheit, respectively. The computer model, however, needs to know the temperature at a point located exactly between the two observation stations. What temperature should it use? 45 degrees Fahrenheit seems like a reasonable guess, but is it right? Well, unless we have an actual measurement from that location, we don't know for sure (and neither does the computer model). While sophisticated approaches for manipulating irregularly spaced data exist, they're all imperfect, and all cause small errors to creep into the model's initialization.
Of course, a computer model must simulate the atmosphere in three dimensions, so it needs initialization data for conditions above the surface of the Earth, too. Weather balloon [11] launches, which typically occur twice each day around the world at 00Z and 12Z, help provide some of that data. However, primarily due to the materials costs associated with launching sensors by balloon into the atmosphere every day, there are relatively few upper-air observing sites where weather balloons are launched. For example, here's a map of the upper-air observing sites in North America [12]. In the U.S., there's usually only a few in each state, at best, and large gaps exist in between observation sites. Some models incorporate observations taken aboard aircraft into their initializations in an effort to increase the number of upper-air observations in the model initialization.
Still, gaps exist, and measurements from satellites help fill in the gaps of the upper-air observing network. While satellite data have greatly helped improve model initialization quality, the remotely sensed observations from satellites still aren't perfect and are another source of error in the initialization. Regardless of the flaws, all of these observations, along with the model's forecast from the previous run (which, itself, is imperfect) are woven together using complex mathematical schemes to create the initialization, which serves as the starting point where the computer begins calculating changes to atmospheric variables in the future.
But, just what is the effect of imperfections in the model's initialization on the forecast? In "chaotic" systems like the atmosphere, imperfections in the initialization are a big deal. Perhaps you've heard of "chaos theory" before. Chaos theory essentially boils down to the idea that any changes in the initial conditions of the atmosphere can cause the system to evolve differently.
In popular culture, the phrase "butterfly effect" is often used as a metaphor for chaos theory (here's a mildly amusing cartoon linking the butterfly effect to weather [13]). The metaphor suggests that a seemingly random flapping of a butterfly's wings in Brazil (or wherever) could eventually affect weather on a larger scale. In reality, this idea is pretty silly. Any flap of a butterfly's wings in Brazil would be dampened out locally by other larger-scale forces, and thus there's no way that a butterfly could alter the weather a month later in some distant part of the world. Perhaps an armada of millions of butterflies flapping their wings for an hour could have an effect, but not one measly butterfly. Still, imperfections in computer-model initializations do matter, because the errors can rapidly grow, paving the way for wildly inaccurate predictions and vastly different forecasts each time the model runs. For a visual on what I mean, check out the short video below (2:16), which is based on a simulation using equations developed by a pioneer of chaos theory, Edward Lorenz [14].
Video: Growing Errors in Computer Model Weather Forecasts (2:16)
Note that even small errors in the model's initialization (one percent or less!) create simulations that are vastly different eventually. The larger the error in the initialization, the faster the solutions diverge. The bottom line is that the errors from the model's initialization grow in time, and the larger the error in the initialization, the faster the errors in the model forecast tend to grow.
Computational Errors
But, computer-model errors don't stop with the initialization. Other errors get introduced into computer-model forecasts within the calculations themselves. For starters, rounding numbers can introduce error (even rounding 59.9999 degrees Fahrenheit to 60 degrees Fahrenheit can make a difference). Also, each calculation is performed for some "time step" into the future (maybe a minute or two), and then the values calculated for that time are used as the basis for calculations another virtual minute or two into the future. But, skipping calculations for the times in between each "time step" also introduces errors. These errors could be reduced by making the model's time step shorter (leaving less time between the calculations), but that requires more computing power. Furthermore, computer models perform their calculations only at certain spots on the virtual Earth, and then interpolate the results to cover the whole globe, further introducing error. Again, this error could be reduced by performing the calculations at more sites that are closer together, but doing so requires more computing speed and power.
Oversimplifications (Parameterizations)
Finally, some processes are oversimplified in the model because of their immense complexity. The details of radiation budgets and turbulent air motions near the ground, along with atmospheric convection (in some models) are so complex that we cannot model them accurately. Just think of the complexity of the surface of the Earth, for example, with parking lots, agricultural fields, forests, buildings, mountains, etc. Each nuance affects the local radiation budget and the way air moves over the ground (and humans can change the landscape with urban development). So, very small-scale atmospheric processes like radiation budgets near the ground tend to be "parameterized" in the models. Formally, a parameterization is an oversimplified way to simulate a process. Of course, since parameterizations imperfectly simulate atmospheric processes, they introduce more errors into the model forecast, which tend to grow in time.
After hearing about how erroneous model forecasts can be, it might be tempting to think that model forecasts are useless. But, even though they're wrong, experienced weather forecasters who know the strengths and limitations of computer models find them very useful in making weather forecasts. Given their imperfect nature (flawed initializations and oversimplifications) meteorologists don't just run one computer model. Instead, they run many computer models! Using an "ensemble" of computer models helps meteorologists better understand the range of possibilities in the forecast, and we'll cover these so-called "ensemble forecasts" next!
Ensemble Forecasting
Prioritize...
After completing this section, you should be able to define ensemble forecasting and ensemble member, and discuss the main advantages of using ensemble forecasts.
Read...
Given that there's no such thing as a perfect computer model forecast, meteorologists obviously can't rely on just one flawed computer model. Instead, they use many flawed computer models in an effort to understand the range of possibilities of future weather, and to better understand which outcomes are more likely than others.
All weather forecasts have some uncertainty associated with them, and a chief way that weather forecasters deal with uncertainty is through the use of ensemble forecasts. At the most basic level, ensemble forecasts are just a set of different computer model forecasts all valid at the same time. Meteorologists use two basic types of ensembles:
- ensembles based on many different computer models (each with their own unique flaws)
- ensembles based on many runs of one computer model started with slightly different initialization data

The ensemble forecasts that meteorologists use fall into one of these two categories, or a combination of the two (some ensembles actually make use of different models and slightly different starting conditions). Having access to ensemble forecasts from computer models essentially gives forecasters many looks at different possibilities for an upcoming weather situation. If the advantages of seeing many possibilities doesn't make sense to you initially, imagine you're competing in an archery contest. Would you rather shoot one arrow at a target (left target) or increase your chances of hitting the bull's eye by shooting a quiver full of arrows (right target)?
Well, having access to only one computer model forecast (or choosing to look at only one) is like an archery contest that allows a forecaster only one shot at the target. But, you can think of ensembles as an archery contest that allows a forecaster to shoot a quiver full of arrows at the same target. For a pending forecast fraught with uncertainty, utilizing ensembles gives forecasters a better chance of hitting at least something (akin to minimizing forecast error). Ensemble forecasts can be used to show meteorologists the probability of various forecast events happening (like, the chance that the temperature reaches 90 degrees Fahrenheit, or the chance that at one inch of rain or more falls in a given time period), so they're very useful tools.
But, before we talk a bit more about how ensemble forecasts are used, I want to briefly discuss how they're created. We'll focus on the second type of ensemble listed above, in which one computer model is run many different times with slightly different initial conditions. To keep going with the archery analogy, what allows us to shoot more than one "arrow" at the target? We know that the initial conditions fed into the model lie at the heart of the problem of model forecast errors (imperfect calculations and parameterizations don't help either), and the imperfect initializations can inject huge uncertainties into a pending forecast.
Since the model's initialization has errors, we "tweak" certain parts of the initialization data (say, making small adjustments to initial temperature or pressure observations) and run the model again to see how the forecast differs. This process is typically repeated at least a couple dozen times (or more, depending on the computer model), to generate a set of ensemble member forecasts. For the record, each individual model run based on "tweaked" initial conditions is called an ensemble member.
If all or most of the tweaked model runs come up with similar forecast solutions, meteorologists have a relatively high degree of confidence in that day’s forecast. If, however, the tweaked model runs predict vastly different forecasts, then forecasters know that the uncertainty in the forecast is great, and they have less confidence in the forecast. Dr. Jon Nese created a short video (3:44) explaining the basics of ensemble forecasting [15] for Penn State's Weather World [16] television program, which you may find helpful in reinforcing the basic principles of ensemble forecasting that I've just described.
If you've watched weather coverage on television, or if you follow it closely online, there's a pretty good chance you've seen ensemble forecasts at some point. Perhaps the ensemble forecasting product that's most commonly seen by the public might be "spaghetti plots" of hurricane track forecasts. A look at the spaghetti plot of forecast tracks for Hurricane Florence (2018) [17] probably gives you an idea of why they're called spaghetti plots -- squiggly lines (that resemble spaghetti noodles) everywhere! For the record, this plot of track forecasts comes from the ensemble run by the European Centre for Medium-Range Weather Forecasts. It's a very powerful ensemble that contains more than 50 members. That means the graphic below shows more than 50 possibilities for Florence's track, based on slightly different model initializations (each line on the graphic represents one member's forecast).

What main messages might a meteorologist take from the spaghetti plot above? Well, for starters, the point toward the right side of the graph where all of the "noodles" come together is the starting point of the forecast. That's the location where Florence was located when the model was run. But, note how the spread between the forecast tracks grows larger farther away form that point, and especially spreads out closer to the United States (for forecast times generally 6 to 10 days after this ensemble was run). That's a reflection of the increasing uncertainty in the forecast further into the future. A forecaster could conclude that it's very likely that Florence will at least come close to the U.S. coast (close enough that at least some impacts from the storm are very likely), but could a forecaster guarantee a specific point for landfall? Nope. That's not something that's predictable nearly a week before a hurricane makes landfall, and the wide spread of ensemble member forecasts indicates why.
While pinpointing a specific spot or time for landfall based on this ensemble forecast is impossible, a meteorologist can still use their knowledge of hurricane structure and hazards, the factors that steer hurricanes, certain known model biases, etc. to perhaps identify some outcomes that may be more likely than others (to narrow the options down somewhat). For example, even recognizing the fact that impacts somewhere along the Carolina Coast were likely (from storm surge, heavy rain, and strong winds) is useful information for helping people to prepare when potential landfall is still nearly a week away (even if the specifics of landfall aren't certain).
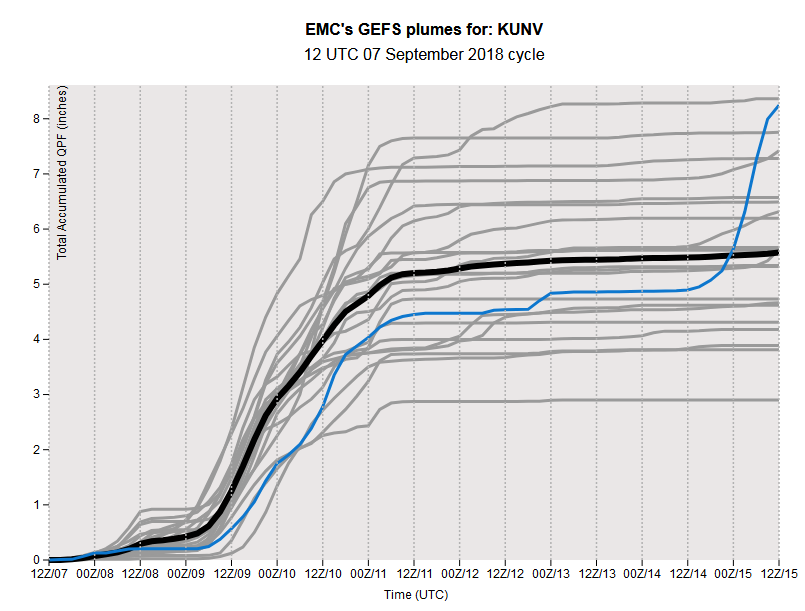
In addition to spaghetti plots of hurricane track forecasts, ensemble forecasts for just about any forecast variable exist. For example, here's a “plume” diagram [18] that shows the predictions for rainfall at University Park, Pennsylvania (where Penn State's main campus is located) based on a set of ensembles run at 12Z on September 7, 2018. Time runs from left to right along the bottom, and along the left is the amount of rain in inches. Each line represents one ensemble member's prediction for cumulative precipitation. A large spread in ensemble forecasts exists, ranging from a little less than three inches of rain to as much as near eight inches (all in about a three-day period). For the record, the thick black line is the mean (average) of all of the ensemble member forecasts, which sometimes forecasters find to be a useful middle ground forecast. In this case, the ensemble mean forecast was for a little more than five inches of rain from the remnants of Tropical Storm Gordon [19] (for the record, the remnants of Gordon ended up dropping 5.84 inches at Penn State's main campus, so the ensemble mean forecast was pretty good here).
Weather forecasters also sometimes find the ensemble mean forecast useful for evaluating the overall weather pattern one to two weeks into the future (more useful than any single model run, anyway). So, ensemble forecasts are a critical tool in modern weather forecasting, and we have advances in computing power to thank for the fact that we can run ensemble forecasts at all. Running the same model many times with slightly different initial conditions requires a lot of computing power! But, now that we've discussed how computers have revolutionized weather forecasting and briefly touched on some of the main tools that meteorologists use in making forecasts, let's start exploring just how good (or bad) the resulting forecasts are. Read on.
Assessing Forecast Accuracy
Prioritize...
When you've completed this section you should be able to define absolute error, forecast "skill" compared to climatology, and probability of precipitation. You should also be able to compare the accuracy of temperature and precipitation forecasts.
Read...
With all of the knowledge of the atmosphere and sophisticated computer modeling tools that have been developed, just how good are weather forecasts? Well, for starters, we have to set some expectations on what exactly is a "good" forecast. If your idea of a "good" forecast is that every single aspect of the weather forecast is perfect (everything is timed to the exact minute, temperatures are exactly right, etc.), then by those unrealistic standards, all weather forecasts are wrong in some way. As mentioned in the previous section, a forecast for the exact landfall location of a hurricane a week into the future, for example, is unlikely to be exactly correct. But, most weather forecasts, when properly expressed and communicated, are accurate enough to be useful.
Before we get into our discussion about the accuracy of various forecasts, we have to cover a couple of definitions that describe some common ways that forecasters track forecast accuracy:
- absolute error tells us about the size of the forecast error based on the difference between the forecast conditions and what actually happens. Using temperature as an example, note that absolute error does not tell you whether the forecast was warmer or cooler than what actually happened; it only tells you about the size of the error. In other words, a forecast that is 5 degrees Fahrenheit too high would have the same absolute error as a forecast that is 5 degrees Fahrenheit too low.
- skill compared to climatology: Forecasts that have "skill" are more accurate than a generic "climatology" forecast of 30-year normal conditions. If the forecast is less accurate than using a forecast of climatological normals, then the forecast has no skill and is essentially useless.
Temperature forecasts are often reasonably accurate (have absolute errors of 3 degrees Fahrenheit or less) a couple of days into the future, but the further into the future the forecast goes, generally the less accurate it will be. In other words, if you see a weather forecast for a high of 85 degrees Fahrenheit tomorrow, much more often than not, the actual high will be within a few degrees of that. But, as time goes on, accuracy suffers. If you see a forecast for a high temperature of 85 degrees Fahrenheit on a day a few weeks into the future, the absolute error is likely to be much larger (possibly 10 degrees Fahrenheit or more). Based on what you learned about forecast errors growing in time in computer models, it should come as no surprise that specific forecasts eventually become erroneous to the point where the forecasts are no longer useful. For this reason, for longer-range forecasts (say, more than a week into the future) meteorologists often evaluate forecast quality based on skill compared to climatology instead of absolute errors.
Longer range forecasts (even weeks into the future) can still be accurate and useful, as long as the forecast is less specific. For example, weather forecasters may not be able to accurately predict the exact high temperature two weeks from now, but they may be able to correctly say that the weather pattern a few weeks from now favors warmer than normal conditions. Such a forecast would have skill (compared to climatology) and may be helpful to event planners, retailers, farmers, etc.
Temperature Forecasts
Within a couple of days, temperature forecasts have absolute errors of a few degrees or less (on average), with accuracy gradually decreasing after three days. The graph below shows mean absolute errors for maximum temperature forecasts by the Weather Prediction Center [20] (the U.S. government's main general weather forecast center) and shows this gradual decline in accuracy from three to seven days. Seven-day forecasts, marked by the black line, have the largest mean absolute errors, of about 5 to 6 degrees Fahrenheit. But, even a three- or four-day maximum temperature forecast is, on average, within about 3 to 4 degrees Fahrenheit of what's observed (red and green lines). Not bad!

The trends on the graph also indicate clear improvement in forecasts in recent decades. On average, a maximum temperature forecast for five days into the future is about as accurate today as a three-day forecast was in 2002. A seven-day maximum temperature forecast is about as accurate today as a three-day forecast was in 1990. So, there's no doubting the improvement! In case you're interested, here's the same graph, except for minimum temperatures [21]. The pattern of forecast improvement is basically the same, although the average absolute errors are a bit smaller.
Not surprisingly, more than seven days into the future, the accuracy of specific temperature forecasts fades pretty quickly, and often by 9 or 10 days into the future, forecasts lose skill completely (meaning, on average, they have larger absolute errors than just using the date's normal high and low temperatures as the forecast). But, you still may encounter forecasts for specific daily high and low temperatures more than 10 days into the future on your favorite weather app or website (some will even attempt to predict daily highs and lows several weeks or even months into the future). Do you think such forecasts are valuable? I suppose the answer to that question is somewhat in the eye of the beholder, but these very specific long range forecasts typically have no skill. In fact, as a class project, some meteorology students at Penn State put some of these specific long-range forecasts to the test [22] to show that simply knowing climatology would give you a better forecast weeks into the future.
Precipitation Forecasts
Generally speaking, predicting the details of precipitation is more difficult than predicting temperature. That's why precipitation forecasts are often expressed as a probability (or chance) of precipitation, which describes the likelihood that a given point in a forecast area will receive measurable precipitation (at least 0.01 inches) in a certain time period. So, a 40 percent chance of rain tomorrow means there's a four in ten chance that any point (your backyard, perhaps) in a forecast area will receive at least 0.01 inches of rain tomorrow. Alternatively, if the same forecast scenario occurred ten times, at least 0.01 inches of rain would fall on four days at any point in the forecast area, and no measurable rain would fall the other six days.
Weather forecasters often use probabilities because whether or not precipitation falls at your location may not be a sure thing. Precipitation formation sometimes depends on many small-scale processes that we can't measure very well, which ultimately leads to error in a forecast. For example, just one day in advance, forecasters won't know the exact location or time when pop-up thunderstorm will occur because the processes involved occur on small scales and are not predictable that far in advance. But, they may know that scattered thunderstorms will develop in a particular portion of a state or region.
Meteorologists have several metrics for keeping track of the accuracy of probabilistic forecasts, but one common assessment for the accuracy of precipitation forecasts (especially forecasts for heavy precipitation) is called the "threat score." You need not worry about the details of the calculation, but the basic idea is that it's based on the ratio of the area where the forecast was accurate to the area where the forecast didn't verify correctly. For a visual, check out the image below, where the Forecast area (F) is the region where heavy precipitation was predicted and is shaded in red. The observed area (OB) indicates the region where heavy precipitation fell and is shaded in green. The hatched area, C, represents the region where the forecast for heavy precipitation was correct.

As with temperature forecasts, threat scores have improved greatly over time. Indeed, a three-day forecast for at least one inch of precipitation is about as accurate today as a one-day forecast was in the late 1980s. That's the good news. The bad news is that extreme precipitation events present numerous challenges to forecasters (and computer models) because of the importance of small-scale processes that we can't measure or model perfectly. Threat scores indicate that the Weather Prediction Center's 24-hour forecasts for at least one inch of precipitation one day into the future get only a little more than half the area correct, on average. Two- and three-day forecasts for 1 inch of precipitation over a 24-hour period get less than half the area correct, on average. So, the accuracy of extreme precipitation events (in locating the exact areas or timing of heaviest precipitation) dwindles much more quickly than temperature forecasts, and as a consequence, the details of precipitation forecasts can change quite a bit, even just a few days into the future.
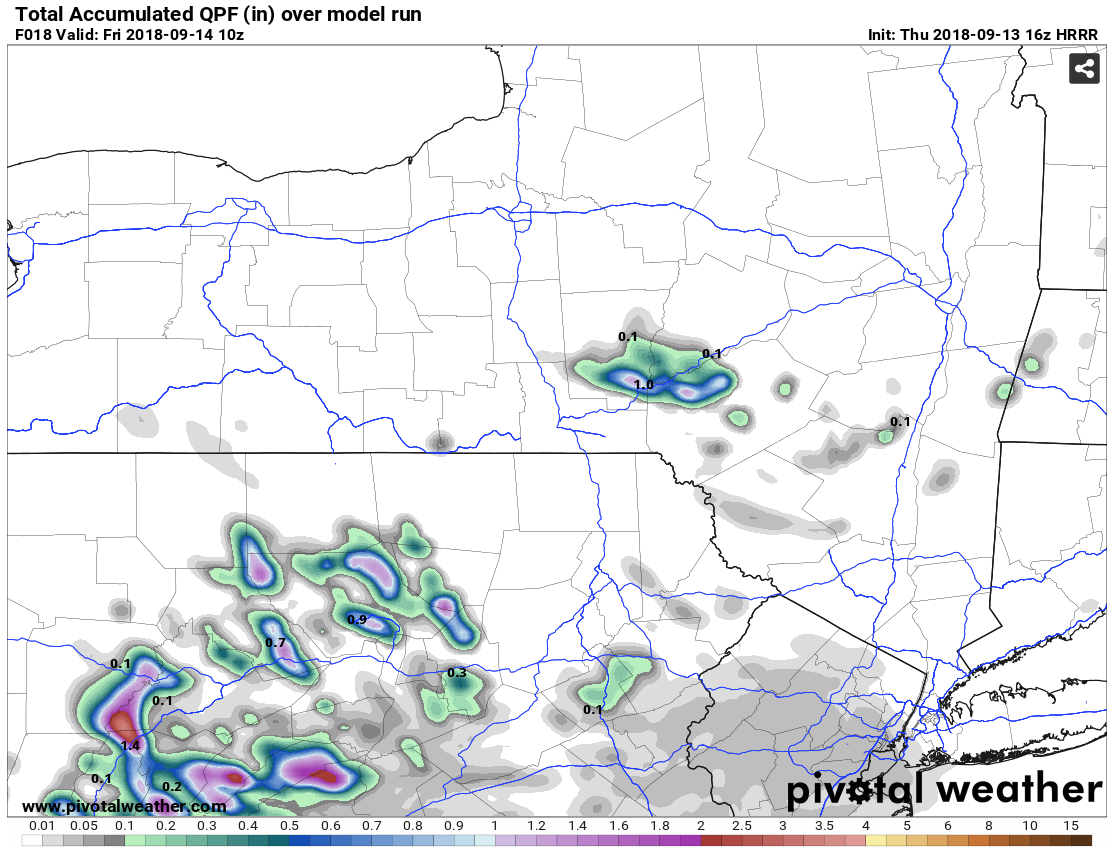
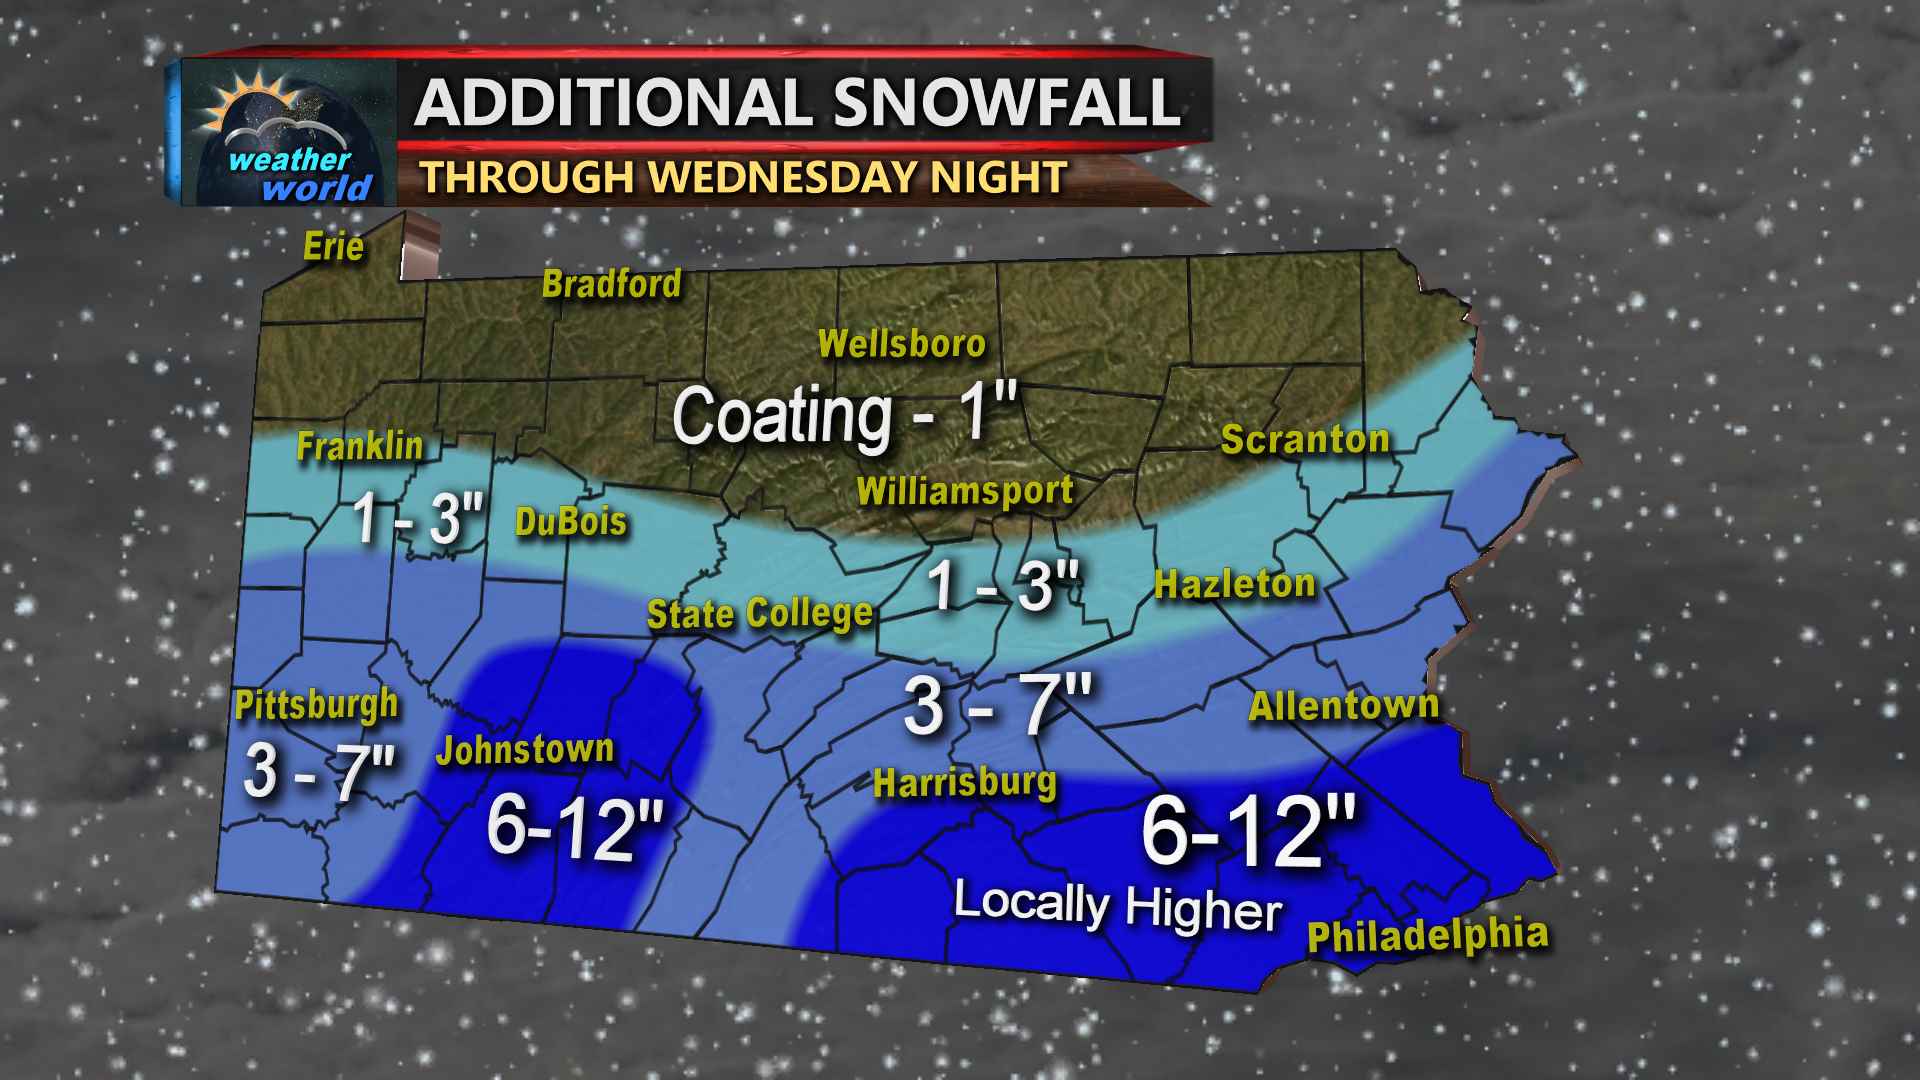
Keep that fact in mind when you see very specific precipitation forecasts. Precipitation forecasts to the tenth or hundredth of an inch aren't hard to find on television weather forecasts or online, but you should be leery of the exact values depicted. At best, the forecasts might highlight the general areas where precipitation (or heavier precipitation) might fall, but the exact values at specific locations will likely be wrong. Take this example of an 18-hour model precipitation forecast from September 13, 2018 [23]. The "splotchy" nature of the precipitation suggests difficult-to-predict scattered showers and thunderstorms. The model is suggesting that localized areas of heavy rain are possible, but I wouldn't trust their exact locations or amounts because they're often wrong (at best, they're close). The same idea goes for snowfall forecasts: When you see snowfall forecast maps with very specific totals (to the inch or tenth of an inch), those specifics are likely to be wrong. When forecasting snow, most forecasters prefer to use ranges [24] to reflect the uncertainty in the forecast and to account for the fact that snowfall totals can vary quite a bit locally based on terrain or the location of small bands of heavier snow.
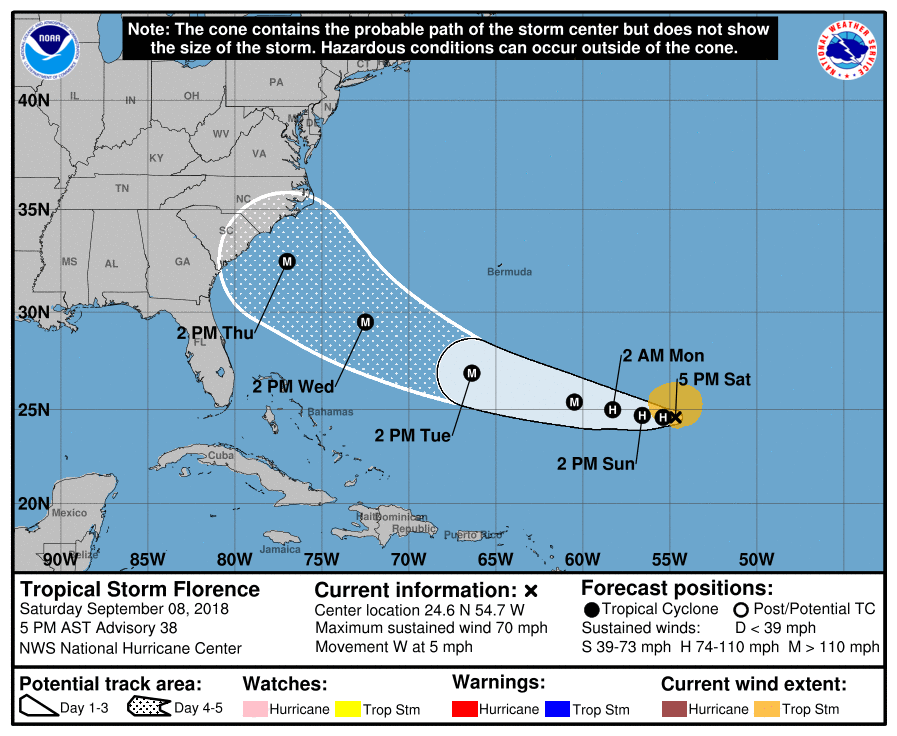
Generally, you should be wary of highly specific weather forecasts for anything more than a few days into the future (especially for precipitation or for any extreme event). However, forecasts several days into the future (or even longer) can still contain useful (but less specific) information. This National Hurricane Center forecast for Hurricane Florence (2018) [25] made six days before it ultimately made landfall near Wrightsville Beach, North Carolina let people in the Carolinas know that a hurricane was likely heading their way. Was the forecast perfect? Not quite, but it was still very good and helped people prepare.
The bottom line is that, if you have reasonable expectations about how good weather forecasts are, you'll find that most forecasts are quite useful, especially if they're communicated in a way that emphasizes the parts of the forecast that are more certain than others. But, let's face it. Not all weather forecasts are created equal. The discussion of forecast accuracy on this page centered around forecasts that are created by humans (using computer models as part of the process, of course). These human-generated forecasts tend to be more accurate than those created solely by computers. But, not every forecast you encounter on a daily basis has a human involved in the process. Up next, we'll talk about some common sources of weather forecasts and how they're made. Read on.
Forecasts, Forecasts Everywhere
Prioritize...
When you've completed this page, you should be able to identify the most common sources of weather forecasts and be able to discuss the mission of the U.S. National Weather Service. You should also be able to discuss the shortcomings of weather forecasts that only feature "icons" to describe the forecast.
Read...
You can find weather forecasts seemingly everywhere today. Just think about all of the places you can get a weather forecast:
- television (via local newscasts and cable networks dedicated to weather, such as The Weather Channel, The AccuWeather Network, and WeatherNation in the United States)
- radio
- newspapers
- websites (often from the same providers offering forecasts on television, radio, and newspapers)
- mobile devices (via a variety of weather apps)
- social media platforms
A 2015 analysis by fivethrityeight.com [26] indicated that 80 percent of those surveyed check the weather forecast daily, and most probably have their favorite "go to" place to get a weather forecast (favorite television station, website, app, etc.). Their analysis suggested that the most commonly used sources for weather forecasts were a combination of mobile apps and websites, with these "online" sources having a slight edge over television. But, preferred sources for forecasts depend somewhat on the type of forecast needed. For example, a 2017 report by the Center of Risk and Crisis Management at the University of Oklahoma [27] (you're welcome to explore the report more if you're interested) indicated that when it comes to learning about current tornado warnings, for example, television was by far the most common source (about 65 percent), followed by notifications on mobile devices.

But, all weather forecasts are not created equal, and it's a good idea to know how the forecasts that come from your favorite sources are made, if possible. In the United States, the National Weather Service [28] and other forecasting centers run by the federal government (such as the National Hurricane Center [29], the Storm Prediction Center [30], and the Weather Prediction Center [20]) provide taxpayer-funded service to every community in the nation (if you're looking for solid, no-hype weather information, these sites can be good places to start). The overarching mission of these agencies is to "provide weather, water, and climate data, forecasts and warnings for the protection of life and property and enhancement of the national economy."
So, if you hear about a severe weather watch or warning in your area, that forecast is coming from a branch of the National Weather Service most likely, even if you hear about it on television, on the radio, or get a notification on a mobile device (many apps run by private weather companies or television stations pass on National Weather Service watches and warnings to their users). But, even though the National Weather Service also issues routine, daily weather forecasts, most people don't get their everyday forecasts from the National Weather Service.
Instead, most people get their routine daily weather forecasts from private-sector sources, ranging from television broadcasters (most of whom are creating their own forecasts) to private weather companies who distribute forecasts through traditional media outlets, online, and through weather apps. The way that these forecasts are created varies widely, and accordingly, their quality varies, too.
Weather Forecasts: The Humans vs. The Machines
Forecast verification data indicate that having human forecasters involved in the forecast process tends to increase accuracy, on average, compared to forecasts that are purely automated. As just one example, here's the percentage improvement compared to raw computer model forecasts [31] for Weather Prediction Center one-day forecasts for at least one inch of precipitation. While the exact percentage improvement has varied from year to year since the early 1990s, it's fair to say that the human forecasters at the Weather Prediction Center demonstrate 20 to 40 percent improvement over raw computer model forecasts most of the time.
Pretty much all forecasts involve computer models in some way, but human forecasters at the National Weather Service evaluate observations, interpret computer model forecasts, use ensembles, and apply their knowledge of atmospheric processes and past weather patterns to improve upon the computer model forecasts. A similar process occurs at most major private weather companies: Humans work together to synthesize the observations and computer model forecasts to create their own forecast, which gets entered into a computerized global forecast database, and in many cases gets sent to media clients (radio stations, newspapers, etc.), along with their website and mobile app. So, depending on what weather app you use, the forecast you see may have had human forecasters involved somewhere in the process (this is often the case if the app comes from a major private weather company or a local television station).
But, that's not true of some weather apps. Indeed, some offer purely automated forecasts straight from a computer model, interpolated to your location. Or, perhaps, at best, they're using a blend of several computer models or ensembles to come up with a forecast. The forecast accuracy of these apps tends to not be quite as good as those with forecasts that have involved humans in the process. I'm not trying to say that completely automated forecasts are always poor (they're not), but they can be more susceptible to large errors. The old phrase "garbage in, garbage out" comes to mind. In other words, when the computer starts with a significant initialization error (garbage in) its forecast is going to have large errors (garbage out). Human forecasters can help minimize these errors, but when they're not involved in the process, the end forecast can occasionally be garbage.
However, regardless of whether or not a human is involved in the forecast process that gets a forecast into your mobile app, many weather apps suffer from the fact that they give a lot of highly specific information -- exact temperatures and precipitation amounts seven or more days into the future, or even hourly weather forecasts out several days or more into the future (these aspects of the forecast typically don't involve direct human intervention). Based on what you learned previously about how forecast errors grow, it's not surprising that a forecast for rain starting at exactly 1 p.m. several days from now, for example, isn't likely to be correct.

Some weather apps even offer weather forecasts down to the minute for a few hours into the future ("heavy rain beginning in 38 minutes," for example). These ultra-specific, minute-by-minute forecasts tend to be purely automated (humans can't update their forecast every single minute), but can be useful sometimes in at least approximating the arrival time of precipitation. But, be aware that due to their completely automated nature, they can occasionally be subject to very large errors. As a personal example, I recall seeing a minute-by-minute forecast a few years back that called for "heavy snow starting in 15 minutes." I was shocked because I knew it wouldn't snow in 15 minutes. So, what happened? After 15 minutes, there was no snow (while the app kept insisting on it). Conditions remained dry for a few hours until precipitation began to fall, but it wasn't even snow; it was light rain! Oops! Garbage in, garbage out.
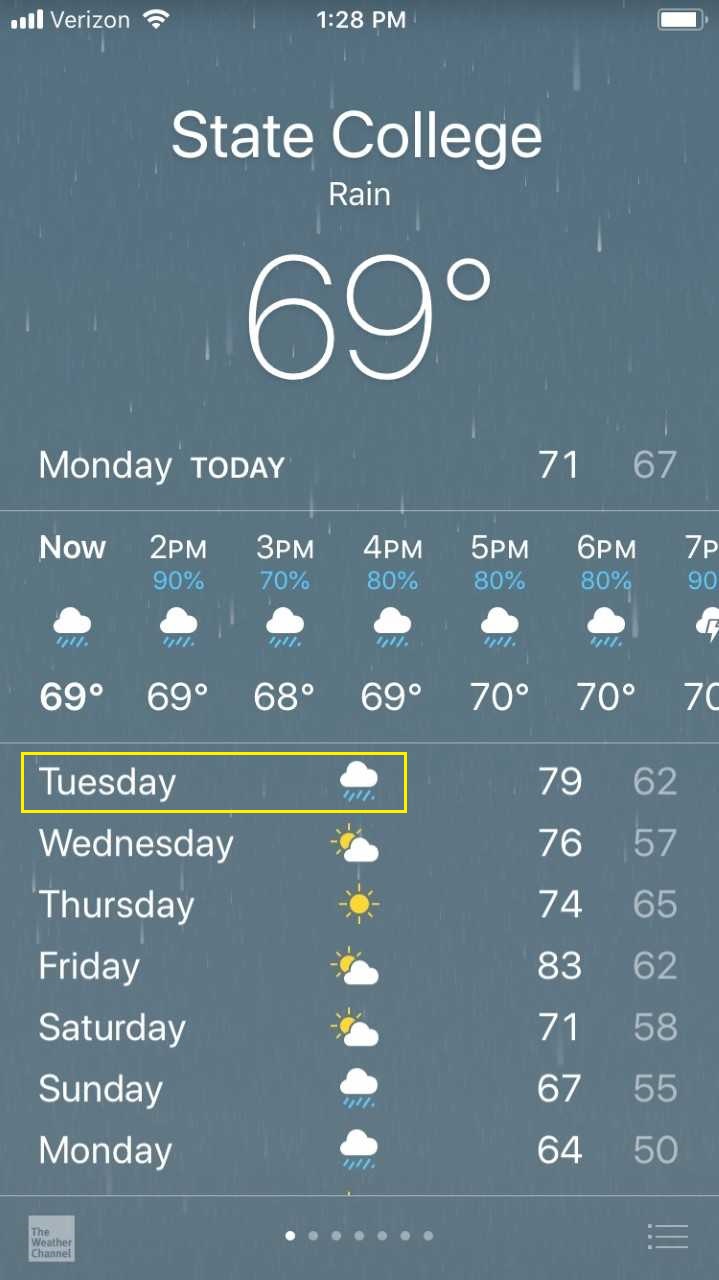
Furthermore, many apps (and websites, for that matter) describe each day's forecast with only a weather "icon," and perhaps a few words, at best. Take the example from the weather app shown on the right, and note the icon showing clouds and rain on Tuesday [32] (the screenshot was taken the day before, on Monday). What does this icon mean? Is it going to rain all day? Most of the day? Will there just be a passing shower? It's not exactly clear, but to me, the icon implies that most of the day is going to be cloudy and rainy. The next day, on Tuesday, it did rain early in the morning in State College, but the rain ended before 9 a.m., and by midday, it was a beautiful, dry day (I snapped this photo on campus [33]). Most of the day was dry, so the forecast icon certainly didn't do justice to the weather that day!
From the icon alone, it would be easy to think that forecasters missed badly on Tuesday's forecast, but in reality, the National Weather Service called it right. Their forecast called for some morning rain, with "improving conditions" and "brightening skies" in the afternoon. On television, forecasters often use simple forecast icons on their graphics, too (similar to what you see in the app above on the right), but the forecaster can explain and give additional context to the forecast. In this case, forecasters on television were able to explain that rain would be confined to the morning.
So, where you get your forecast from matters, and you have many options! In our society, the burden of finding quality sources of weather forecasts and communication falls on the weather consumer, and in some high-profile cases, people and organizations have made poor choices about where they get their weather information. Just ask the Miami Marlins, who embarrasingly once had a rain delay in their stadium with a retractable roof [34], all because their decision makers decided to keep the roof open after "playing meteorologist" using only mobile apps! If you're getting your forecast from television, the National Weather Service, or some major private weather companies, there's a good chance your forecast had a human involved in the process. But, especially when it comes to weather websites and apps, it's not always easy to tell whether or not human forecasters were involved. So, even if you're not sure exactly where your forecast is coming from, keep these thoughts in mind:
- forecasts with some human input in the process tend to be at least a little more accurate (on average) than those that are completely generated by computers
- weather apps or websites that merely provide an icon to describe the weather for a day rarely convey the full story of the weather forecast, and thus, can be misleading without further explanation or context
- human forecasters can add additional context and explanation to a weather forecast that can be difficult or impossible to get from an icon alone
- be skeptical of any highly specific forecast for more than a few days into the future regardless of the source. Predictions for things like the exact timing of precipitation, the exact amount of precipitation, the exact temperature or exact wind speed at a specific time several days or more into the future can be subject to large errors. More general forecasts several days (or even weeks) into the future can still be accurate and useful, however.
Even with the shortcomings of weather forecasts, more often than not, they are reasonably accurate, at least a few days into the future (and less specific forecasts can be accurate much further into the future). Occasionally, however, weather patterns dictate more uncertainty in the forecast than usual, and these situations present huge challenges to weather forecasters and weather communicators. Up next, we'll examine some common scenarios when weather forecasts can go very wrong. Read on!
When Forecasts Go Wrong
Prioritize...
Upon completion of this page, you should be able to discuss three scenarios with greater-than-normal forecast uncertainty, which can lead to large errors in specific weather forecasts.
Read...
With the stats and discussion so far in the lesson, you should have the impression that:
- most short-term weather forecasts (a few days or less into the future), while not perfect, are accurate enough to be useful
- weather forecasts several days into the future or more can still be accurate and useful if they're less specific about details (exact temperatures, exact timing of precipitation, exact precipitation amounts, etc.)
- the perception of forecast accuracy suffers sometimes because of the sources people use for their forecasts (apps that only show a single weather icon with no further context or that give highly specific information too far into the future, for example)
But, while most weather forecasts that are communicated appropriately are accurate enough to be useful, sometimes weather forecasts (even short-term ones) go very wrong. My goal in this section is to present a few common scenarios when this can occur, so that if you're following along with weather coverage, you may be able to spot instances when the weather forecast for your location has a lot of uncertainty and may go awry. We're going to focus on three scenarios -- weather patterns with large gradients, cases where small-scale processes (like atmospheric convection) are major factors in the weather, and cases where the conditions depend highly on the exact path of a strong mid-latitude or tropical cyclone.
Beware of Large Gradients
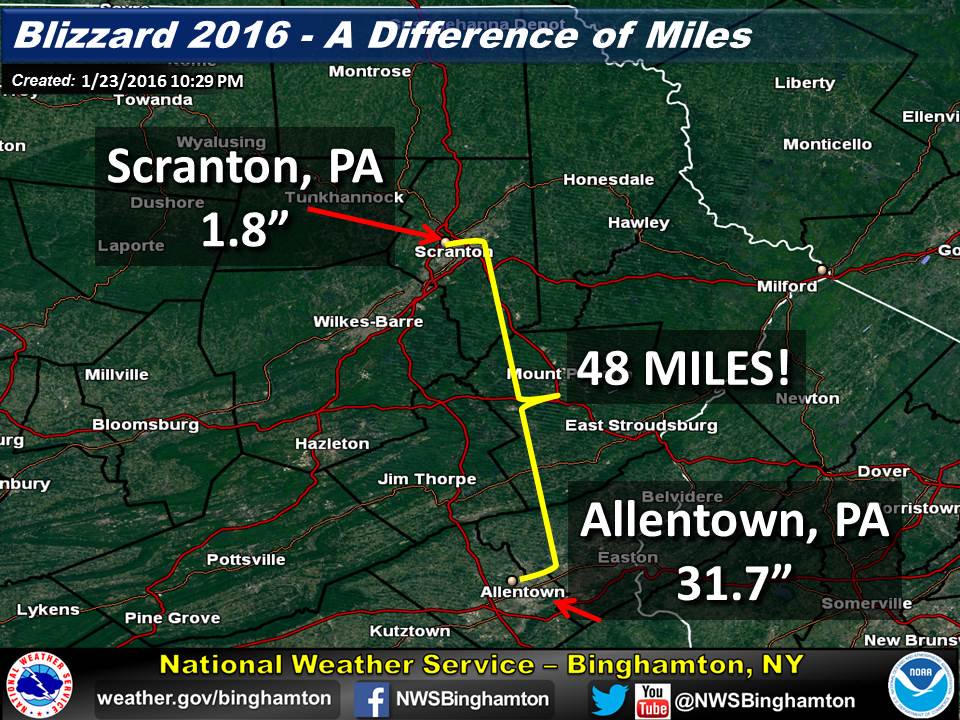
I've said a few times throughout the course that large gradients are areas where "interesting" weather tends to happen, and unfortunately, large gradients tend to present huge forecasting challenges. Why is that? As you may recall, a gradient is the change in some variable over a certain distance, so large gradients mean that large changes exist over a short distance. As an example, check out the observed snowfall analysis from January 22 through January 24, 2016 from the "Blizzard of 2016." Note the large gradient in snowfall amounts along the northern edge of the storm's wake.

If you focus on Pennsylvania, in the central part of the state, some areas received more than 20 inches of snow, but along the northern border (less than 100 miles to the north), no snow fell at all! As an extreme example, Scranton, Pennsylvania received less than 2 inches of snow, while Allentown (about 50 miles to the southeast), received more than 30 inches [35]! Such rapid changes in snowfall over a small distance mean that very subtle (and hard-to-predict) changes to the storm can drastically change the amount of snow that falls at any location within the large gradient. In this case, a slightly more northern track of the storm would have meant feet of snow for Scranton, instead of just 1.8 inches.
Indeed, areas along the western and northern edges of big East Coast snow storms (and other strong mid-latitude cyclones in the Northern Hemisphere) can be areas of large forecast uncertainty, and the confidence in the specific forecast at any single point is pretty low. The predictions for very heavy snow in the "heart" of the storm tend to have higher confidence. So, if you find yourself near the edge of where significant precipitation may fall (in other words, in a region with a large gradient), keep in mind that your forecast is particularly challenging, and small changes in the storm's behavior could mean big differences in the weather you experience.
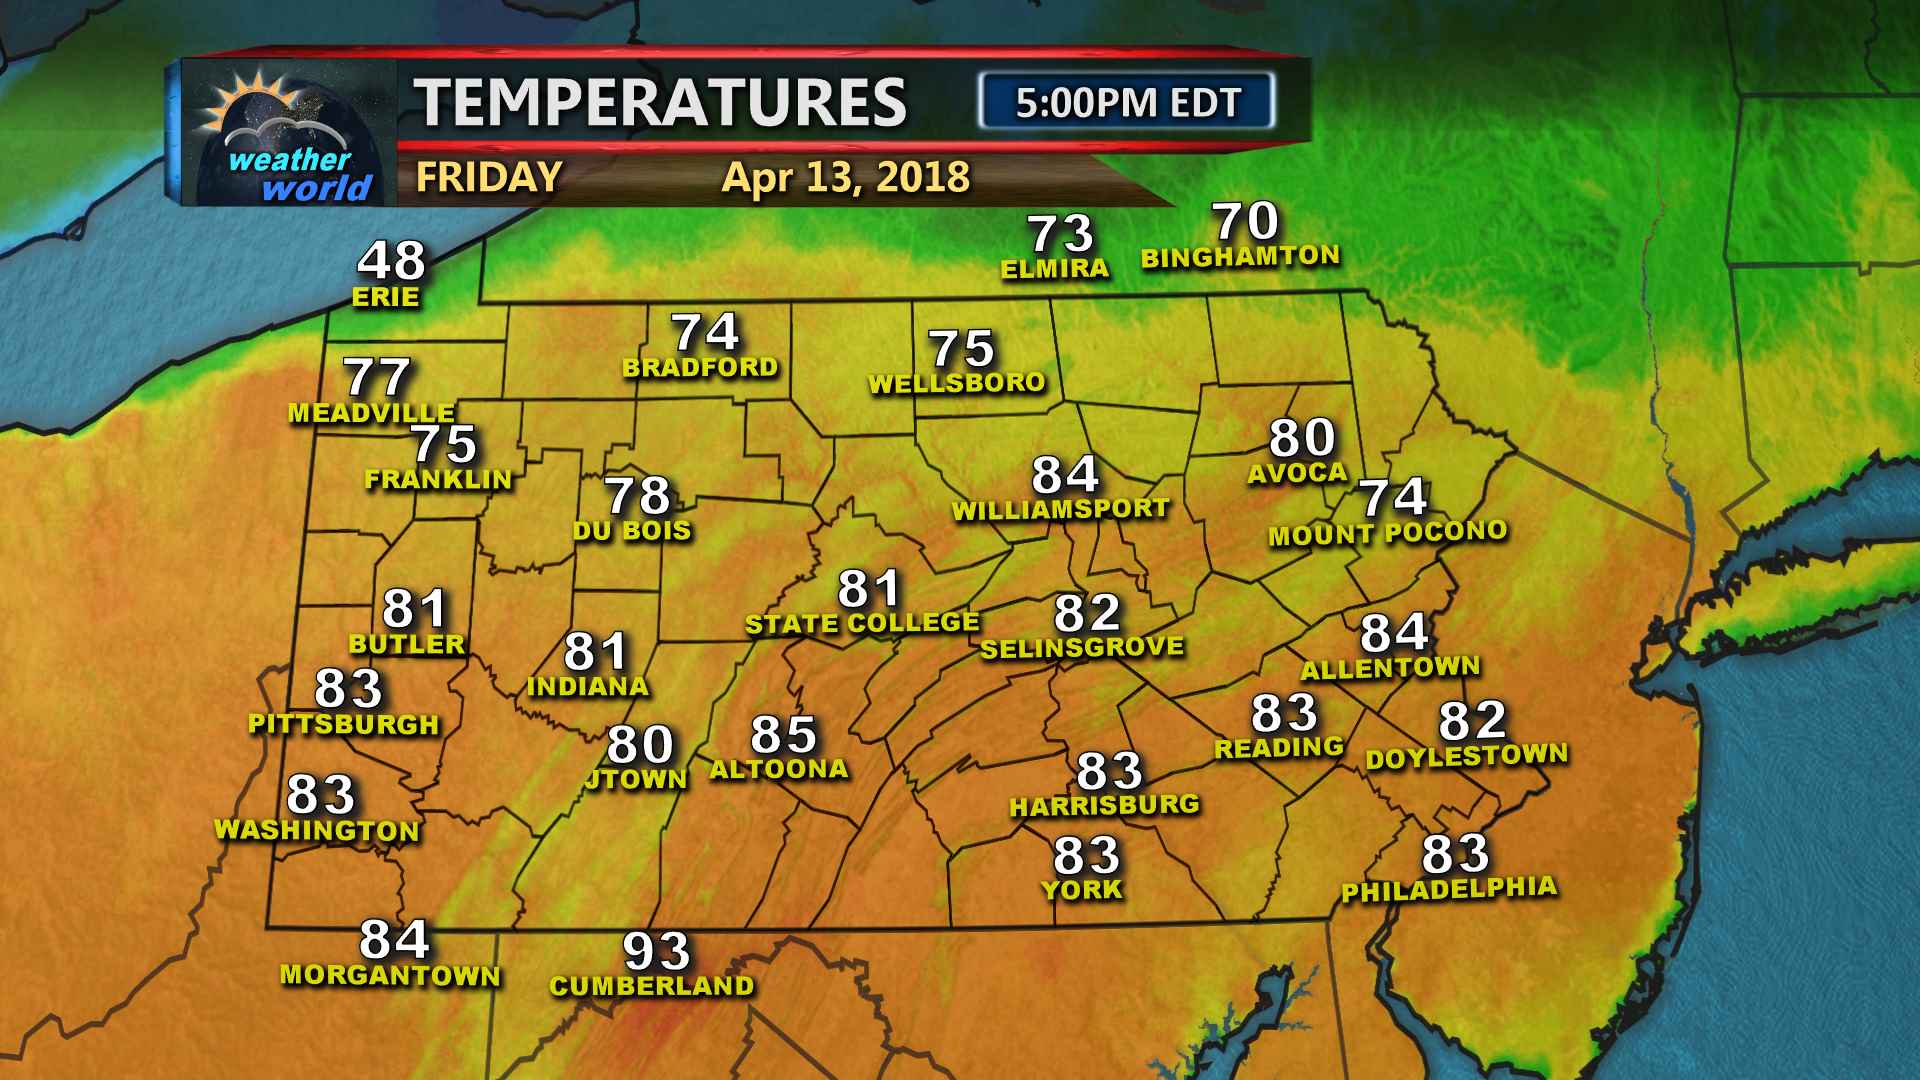
The same can be said for regions with large temperature gradients (where strong fronts are located). For example, a long stationary front that extended from off the New England Coast back to a low near the Nebraska / Kansas border on April 13, 2018 (check out the 15Z analysis of sea-level pressure and fronts [36]) had a large temperature gradient associated with it. Temperature forecasts within the large gradient were particularly challenging because of the large changes over a small distance.
Unless a forecaster or computer model predicted the gradient exactly right (not likely, even a day in advance), there were bound to be some "surprises" in the temperature forecast. In fact, parts of Pennsylvania made it well into the 80s, while it was just 48 degrees Fahrenheit in Erie [37], with a chilly northeasterly wind blowing off the waters of Lake Erie (the lake waters are still quite chilly in April). Temperatures ranged from the 40s to the 70s within one county, and the sharp gradient continued toward the east along the southern tier of New York. Good luck to the forecasters who had to deal with that! So, when you're located in an area where a strong front is located be aware that your temperatures could change quickly, and that the temperature forecast for your region is more uncertain than usual. It's a good idea to prepare for a wide range of temperatures because it could easily end up much warmer, or cooler, than the forecast says (or if you have to travel even a small distance, temperatures could be drastically different). So, beware of gradients! They're areas where big weather changes happen over small distances, which can wreak havoc on a forecast.
Small-Scale Weather
Scenarios in which small-scale weather processes are very important in the forecast can also give weather forecasters headaches. What do I mean by "small-scale weather processes"? Atmospheric convection is a good example. On some days, the development of thunderstorms through convection might seem random, because isolated thunderstorm cells seemingly pop up on a whim. But, thunderstorms never really erupt randomly, even if it appears that way. As you learned previously, thunderstorms tend to form when air parcels can become positively buoyant after being given a nudge upward. Sometimes that nudge comes from a large feature, like a cold front, but other times the nudge comes from small areas of subtle low-level convergence. These small, subtle "triggers" are often missed by the network of weather observation sites, and computer models often struggle to simulate them properly.

Because the "triggers" for thunderstorm development aren't measured or modeled very well, confidence in exactly where or when thunderstorms might erupt is often low. Forecasters can often identify a region of the country or state where thunderstorms will likely develop, but pinpointing exactly when and where is more difficult. For example, check out the animation of simulated radar reflectivity from nine consecutive computer model runs. All forecasts in the animation are valid at the same time (00Z on September 22, 2018), and are from the same computer model. The "oldest" forecast in the animation (first frame) is from the model run 60 hours before the valid time, while the "newest" forecast in the animation is from the model run 12 hours before the valid time (last frame). Do you see the changes in the predicted line of storms from model run to model run? The location of the line and the location of the most intense cells jumps around quite a bit.
A take-home message from the animation above is that even sometimes within one day of the development of thunderstorms, the exact locations and intensity aren't clear. In this particular case, a squall line was likely to develop along a cold front, but the exact timing and location of the most intense parts of the line were uncertain, even 12 to 24 hours in advance. Pinning down details gets even harder when thunderstorms are more of the widely scattered "pop-up" variety. In such cases, model forecasts for radar reflectivity often bear little resemblance to each other, as the exact locations of individual thunderstorms jump around a lot. These situations can really cause problems for automated minute-by-minute or hourly forecasts.
Dependency on Major Cyclone Tracks
To some extent, challenges brought about by the exact tracks of major mid-latitude or tropical cyclones are connected to the issues with large gradients that we already discussed. A slightly different low track for the "Blizzard of 2016" for example, would have resulted in vastly different snowfall amounts in the northern half of Pennsylvania in the example above. Similarly, if you're in an area where a change over in precipitation may occur during a winter storm (from snow to sleet and freezing rain, for example), a small deviation in the storm track can change the weather you experience a lot by causing changes in precipitation type either much slower or faster than expected (perhaps leading to much more or less snow than anticipated, respectively).
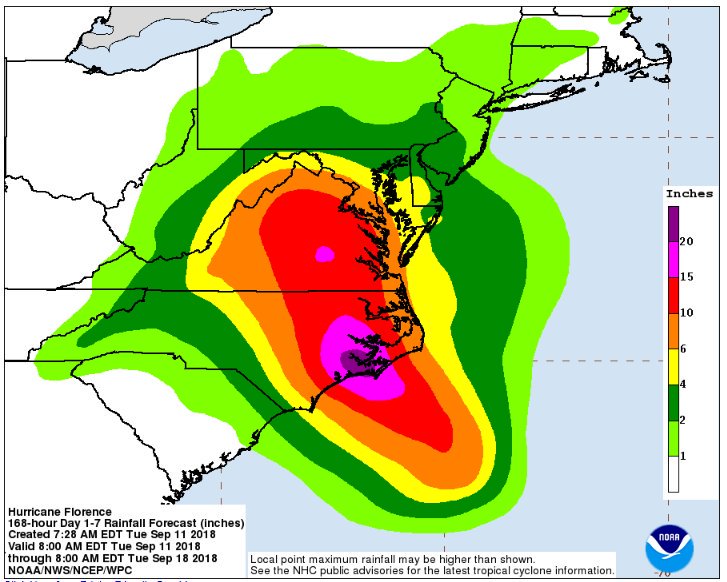
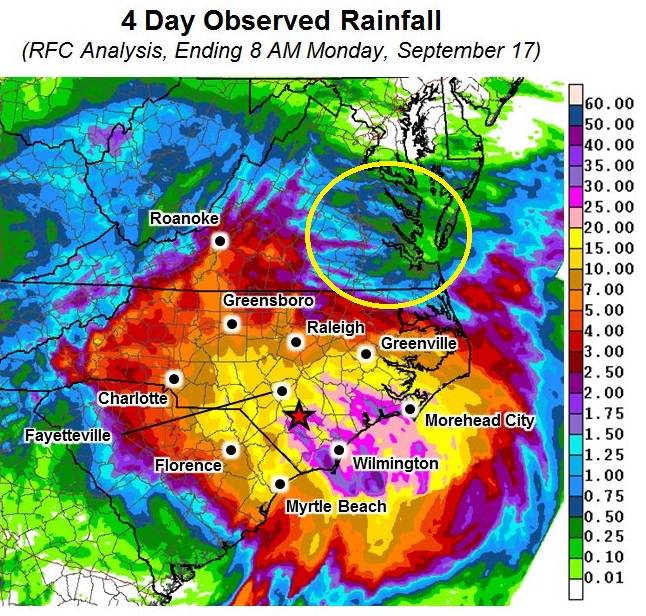
As another example, check out the rainfall forecast for Hurricane Florence (2018) from the Weather Prediction Center [38], issued about three days before the storm made landfall. Note that much of eastern Virginia was predicted to get anywhere from 6 to 15 inches of rain (orange and red shadings). Now, check out the actual rainfall estimates from Florence [39], and focus in on the circled area in eastern Virginia. Most of that region received less than two inches of rain (and some areas less than one inch)! The forecast did correctly highlight eastern North Carolina as the area that would see the heaviest rain (a large area of 15 inches or more), but the forecast for eastern Virginia wasn't very good. That's because Florence ended up taking a more southern path [40] once inland, instead of turning immediately northward, which shifted some of the very heavy rain into South Carolina instead of Virginia.
But, what if the storm had come in 50 or 100 miles farther north than it actually did? Some of those areas in eastern Virginia, which didn't see much rain, would have seen a deluge (and serious flooding, most likely). Sometimes, a mere difference of 50 or 100 miles in the path of a mid-latitude or tropical cyclone can mean the difference between catastrophic impacts and impacts that are much more manageable. Unfortunately, errors of 50 or 100 miles are fairly common even just a few days in advance.
The delicate forecast scenarios outlined in this section are the times when highly specific forecasts are most likely to go wrong. They're also the situations when a fully automated forecast or an "icon" on a weather app is most likely to mislead you. When the forecast gets complicated, that's when a human meteorologist can really help by giving additional context and explaining a range of possibilities. So, I think having some trusted weather sources (beyond just an app) can be very useful, especially for those times when high-impact weather may be coming your way. Up next, we'll talk about finding trusted weather sources in the age of social media. Read on!
Trusted Weather Sources and Social "Media-rology"
Prioritize...
After completing this section, you should be able to identify the problems with seeking urgent, potentially life-saving weather information via social media, and be able to describe characteristics of trustworthy, reliable sources of weather information.
Read...
In the old (pre-Internet) days, people didn't have a lot of options for where to get their weather information. Most people got their weather forecasts and information from television, radio, or the newspaper. In some cases, these sources simply disseminated the National Weather Service forecast (and today, most still pass on National Weather Service watches and warnings). But, the bottom line is that, while people may have accessed weather information frequently, the weather information they were receiving came from a relatively small number of sources.
With the arrival of the Internet, and social media in particular, the landscape has changed. With these tools, you can access weather forecasts, information, and insights from meteorologists all around the world. Social media allows you to follow the forecast thoughts and insights of thousands of meteorologists worldwide, and even perhaps interact with them. That's a huge difference from the old days, and it has pros and cons. One positive is that people have access to more weather information and expertise than ever before. But, a negative is that not all of the information is high quality and not all of the "expertise" is real. Furthermore, it's sometimes hard to tell the difference on social media between a real expert and fake one if you're not somewhat weather savvy yourself, so I hope that the basic weather knowledge you've accumulated in this course along with the discussion in this section will help you better navigate the weather information that's available on social media.
It's Only a Matter of Time
A general problem with consuming weather information via social media is a matter of timing. As an example, social media is often unreliable for receiving potentially urgent, life-saving weather information because many social media platforms don't always deliver content to you chronologically. In other words, the posts that you see in your social media feeds may not be the most recent ones.
Why is that a problem? Well, if you're under a tornado warning, and a meteorologist shares that via social media, you might see that post right away...or you might not. Social media platforms can have complex algorithms that decide what content to deliver to you, based on what they "think" you want to see. The end result is that sometimes the content that you see first might be old (sometimes days old). If you're under a tornado warning and have minutes to spare before a tornado hits your area, seeing the tornado warning shared into your social media feed a couple of days later is not helpful (if you're still alive, that is). The bottom line is that you should have multiple ways to get urgent severe weather warnings (weather apps, television, radio, NOAA Weather Radio, etc.), and you should not rely on social media for potentially life-saving weather information.
Along the same lines, because social media platforms do not always deliver the most recent content to you, make sure that you take time to look for the timestamp on a post (most platforms include the time and the date somewhere on the post). For example, Penn State's Weather World television program posted information on its Facebook page [41] about a line of damaging thunderstorms moving through western Pennsylvania on the evening of August 29, 2018. But, inevitably, some people didn't see this post in their feeds until hours, or even a few days later.

Sometimes Not Sharing is Caring
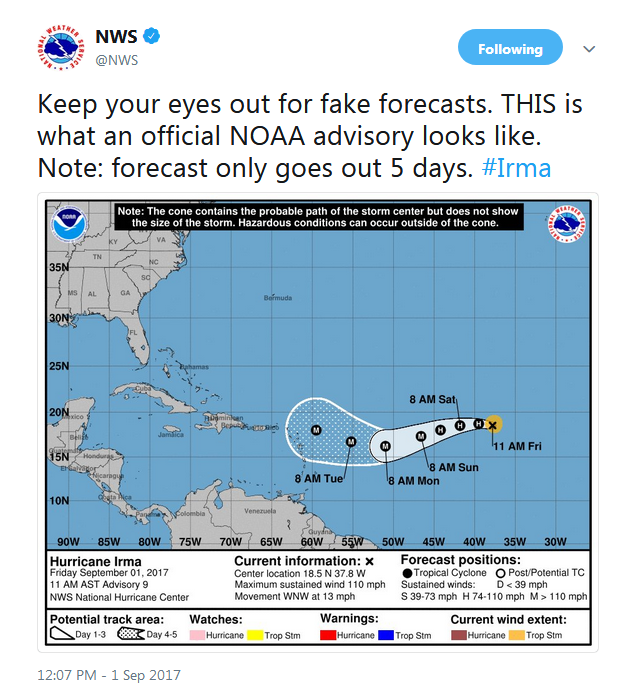
When a major weather event is on the way, social media platforms get filled with a wide variety of forecasts and analyses, and not all of the forecasts and analyses are legitimate. For example, in 2017, the National Weather Service Twitter / X account had to remind people to keep an eye out for "fake forecasts," [42] and remind the public their official forecasts for hurricanes only go five days into the future (because of the great uncertainty in hurricane track forecasting beyond that point).
What prompted such a reminder? Viral fake forecasts like the one below, which showed a forecast for Irma that took the storm into the Gulf of Mexico and striking Texas a week later. This particular forecast was shared nearly 37,000 times on Facebook (meaning it was likely seen by hundreds of thousands, if not millions of people) and incited some regional panic in part because southeastern Texas had just been deluged by Hurricane Harvey just a couple of weeks before. Irma ended up making landfall in southwest Florida [43], and no "real" forecast ever had it making landfall in Texas. Both local news sources [44] and national news sources [45] ran stories warning the public that this forecast was fake.
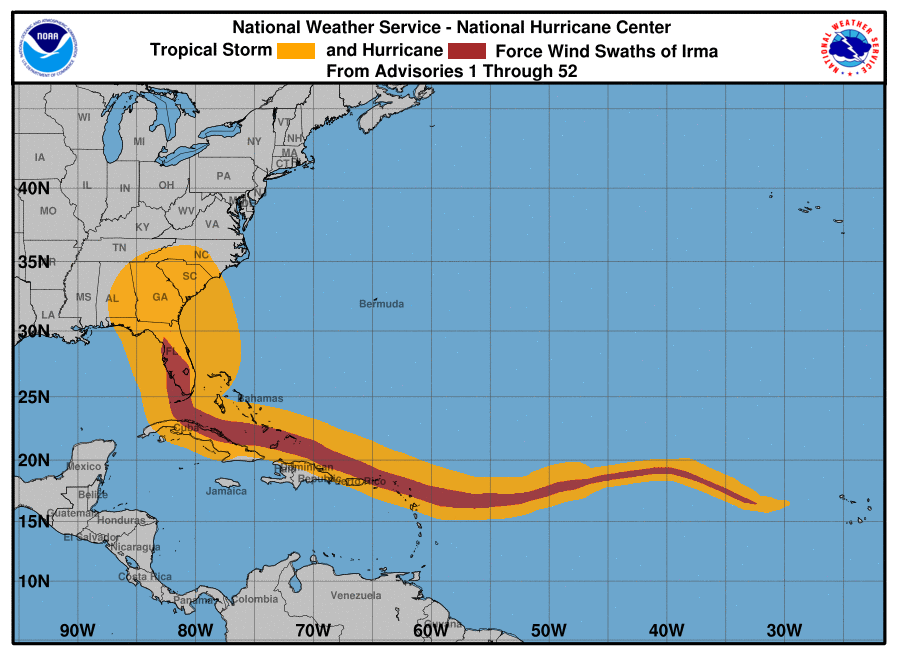

Viral fake weather forecasts aren't just limited to hurricanes, though. Fake snowfall forecasts go viral from time-to-time, too. Take this example of a Facebook post from September 13, 2018 by the "New England News Network," [46] which said that the Northeast will have its first September snowfall "in years," and was accompanied by a very official-looking snowfall forecast graphic showing up to six inches of snow in parts of the Northeast.
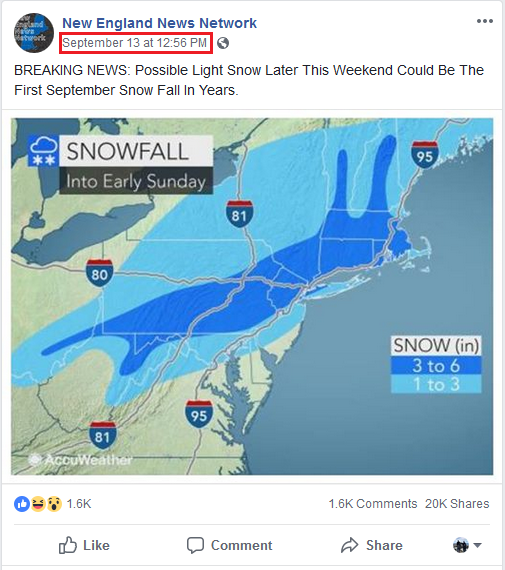
This post was shared 20,000 times on Facebook, and it was a complete fabrication. The snowfall forecast graphic looked official and professional because it was a real graphic from a private weather company (AccuWeather), but it was for a snowfall forecast from a previous winter. While a bout of cool weather was on tap this particular weekend in the Northeast, there was absolutely no chance of snow, and red flags would have gone up for anyone with some weather savvy. How many times on record do you think that, say, parts of Pennsylvania and New Jersey have received three or more inches of snow in September (right around the end of astronomical summer / beginning of astronomical fall)? If you said "zero," you're absolutely right. And, there was no chance of it here.
Anyone who took the time to read the "New England News Network" page description would have seen that it described itself as a satire site. So, they posted this forecast as a joke, but many people share social media posts without checking their sources, and judging from the 20,000 shares and accompanying comments indicating that people thought it was a real forecast (or at least thought it might be real), and you have a recipe for confusion. This scenario plays out often enough that some professional meteorologists at television stations, private weather companies, and the National Weather Service have to spend an increasing amount of time vetting and debunking forecasts that are spreading panic on social media (often because of overly specific forecasts a week or more into the future). Some meteorologists refer to this as the "Social Media-rologist Dilemma [47]" because the sources of these forecasts are often (although not always) not professional meteorologists, and they may not have sufficient education in meteorology or weather forecasting; yet, their social media posts can have far-ranging impacts.
The bottom line here is that you need to evaluate the weather forecasts you see on social media, which requires some critical thinking. Does the forecast make sense? Is the forecast trying to predict something that meteorologists actually have skill at predicting, or is it an overly specific forecast for something several days or a week or more into the future? If something doesn't seem right about it, based on the principles you've learned in this course, perhaps it's not worth sharing. Sometimes not sharing is caring. Of course, knowing a little bit about the sources of the weather information you see can help with vetting its quality, too.
Know Your Sources
Because just about anyone can have a social media account and post weather forecasts and information if they want to, it's up to you, the weather consumer, to determine which sources of weather information are reliable and trustworthy. A good first step is to take a moment to read the social media profile of the person or organization that posted the weather information you're seeing. Many professional meteorologists will put job titles and professional affiliations in their social media profiles. Furthermore, it never hurts to do a Google (or other web) search to find out information about your source. Most television meteorologists have bios on their station websites, and many other professional meteorologists and weather companies have websites where you can find information about their background and experience. As you read up on their backgrounds, here are some questions to think about:
- Does the person have a degree in meteorology? If the source is an organization or company, is it staffed by degreed meteorologists?
- What is their specific area of expertise? General weather forecasting? Agricultural or business applications for weather forecasts or data? Storm chasing? Climate or climate change? Air quality or environmental meteorology? Something else?
- How long have they been active in their area of expertise? How much experience do they have?
This basic information can help you identify trustworthy and reliable sources, but it's not always possible to find this information, and occasionally people are not honest about their credentials and experience, so you can't go by profile information entirely. If a source is anonymous, or you can't find much information about their background, you may want to be skeptical about their qualifications. Regardless of the profile information you can (or can't) find, you can often judge the reliability and trustworthiness of a weather source by the content that they post.

Trustworthy and reliable sources of weather information will typically:
- post weather forecasts and other information that is usually reasonably accurate, and focused on their area of expertise
- account for the increasing uncertainty in the communication of longer-range forecasts (and avoid overly specific longer-range forecasts)
- post weather and / or science news from reputable websites
If you've found a weather source that does these three things, then congratulations! You've likely found a trustworthy and reliable source of weather information! If you see a particular source that frequently posts incorrect information or forecasts that regularly go wrong, or they post a lot of overly specific long-range forecasts or long-range model guidance (like the 15-day model total snow forecast above) without explaining the uncertainties involved, they may not be a reliable source.
To get you started in finding trusted weather sources on social media, Forbes published a list of Twitter / X accounts that provide quality weather information [48] (this list obviously is not entirely inclusive). Many of these people and organizations have a presence on other social media platforms, so you may find them on other platforms, too. I hope that by completing this course, you're now in a better position to use your weather knowledge to navigate through the sea of weather information available and differentiate quality information and forecasts from hype and junk. Good luck!