Lesson 4: Atmospheric Composition
Overview
Overview
The atmosphere consists mostly of dry air—mostly molecular nitrogen (78%), molecular oxygen (21%), and Argon (0.9%)—and highly variable amounts of water vapor (from parts per million in air to a few percent). Now we will consider gases and particles in the atmosphere at trace levels. The most abundant of the trace gases in the global atmosphere is carbon dioxide (~400 parts per million, or 400 x 10-6), but there are thousands of trace gases with fractions much less than a few parts per million. Some, particularly the reactive hydroxyl (OH) radical, are important even though their abundance is less than 1 part per trillion (10–12). The atmosphere also contains small particles with sizes from nanometers (10–9 m) to microns (10–6 m) coming from many sources. These trace gases and particles are as important to atmospheric structure and weather as are nitrogen, oxygen, and water vapor and they also play a huge role in human and ecological health and global climate. In this lesson we will examine the atmosphere’s composition and its changes over time. The atmosphere is continually inundated with surface emissions of gases and particles (and some from space) but it has chemical mechanisms to clean itself. We will see how two atmospheric pollutants—ozone and small particles—are produced. In later lessons, we will see that without these chemical processes and particles, there would be no clouds and, thus, no real weather.
Learning Objectives
By the end of this lesson, you should be able to:
- explain the role that each of several atmospheric constituents plays in atmospheric structure and weather
- identify changes in minor and trace gas amounts and the impacts these changes have on the atmosphere
- explain how the atmosphere cleanses itself using methane as an example
- use chemical equations to show how ozone is formed in the stratosphere and the troposphere and how they differ
- diagram the lifecycle of aerosol particles with an emphasis on their role in weather
Questions?
If you have any questions, please post them to the Course Questions discussion forum. I will check that discussion forum daily to respond. While you are there, feel free to post your own responses if you, too, are able to help out a classmate.
4.1 Atmospheric Composition
4.1 Atmospheric Composition
The major gases that comprise today's atmosphere are listed in the table below. In most studies of atmospheric composition, the volume mixing ratio is used to specify the amount of a gas. The volume mixing ratio (also called the molar mixing ratio) of a gas is the number of moles of the gas divided by the number of moles of air. For example, 78 moles of every 100 moles of air is nitrogen, so nitrogen's volume mixing ratio is 0.78.
| Constituent |
Molecular Mass (g mol–1) |
Volume Mixing Ratio (mol mol–1) |
Role in the Atmosphere |
|---|---|---|---|
| nitrogen (N2) | 28.013 | 0.7808 | transparent; provides heat capacity and momentum; exchanged with biomass; decomposed in combustion |
| oxygen (O2) | 31.998 | 0.2095 | transparent except in the extreme ultraviolet; provides some heat capacity and momentum; exchanged with life; source of important reactive gases like ozone |
| argon (Ar) | 39.948 | 0.0093 | no role |
| carbon dioxide (CO2) | 44.010 | 0.000385 (385 ppmv) | transparent in visible; absorbs infrared light (i.e., contributes to global warming); exchanged with life; product of combustion |
| neon (Ne) | 20.183 | 0.0000182 | no role, but makes colorful glowing signs |
| water vapor (H2O) | 18.015 | 2 x 10⁻⁶ to 0.05 | transparent in visible; absorbs infrared light (i.e., contributes to global warming); exchanges with liquid and solid forms; exchanges with life; product of combustion |
| aerosol particles | varies | 0–500 µg m–3 (note different units) | essential for cloud formation; interact with visible and infrared light; exchange with surfaces and life |
| methane (CH4) | 16.04 | 0.00000182 (1820 ppbv) | transparent in visible; absorbs in infrared (i.e., contributes to global warming); exchange with life; source of CO2 and H2O |
| ozone (O3) | 48.00 | 0.01–10 x 10–6 (10 ppbv to 10 ppmv) | transparent in visible; absorbs in UV and infrared; reactive and source of more reactive gases |
| particles | varies | 0–100’s µg m–3 (note different units) | absorb and scatter light; act as CCN and IN (see below) |
Key features of the gases include their compressibility (i.e., ability to expand or shrink in volume), their transparency in the visible, their momentum, and their heat capacity. Key greenhouse gases—those that absorb infrared radiation and hence warm the planet—are water vapor, carbon dioxide, methane, and ozone. Water vapor has the additional important feature of exchanging with liquid and solid phases in the atmosphere and on Earth’s surface. The most important properties of small particles include their ability to dissolve in water in order to be cloud condensation nuclei (CCN) or to maintain a lattice structure similar to ice in order to be ice nuclei (IN), as well as their ability to absorb and scatter sunlight. These properties depend completely on the particle size and composition. Most atmospheric gases participate in the atmosphere's chemistry, which is initiated by sunlight, as you will soon see.
A note on the units used when quantifying atmospheric composition
The amount of a gas is typically specified in one of three different ways. You have already been introduced to the first, the volume mixing ratio, in the table above. For gases with relatively large fractions like nitrogen, oxygen, and argon, we use percent to indicate this fraction. For minor gases like carbon dioxide and ozone, we use parts per million (10–6) by volume (ppmv) or parts per billion (10–9) by volume (ppbv). The second is the mass mixing ratio, which is the mass of a chemical species divided by the total mass of air. You have already encountered this ratio with the specific humidity. The third way to specify the amount of a gas is the concentration, which is the number of molecules per unit volume.
It is straightforward to convert between volume mixing ratio and concentration. For a species X, to convert from a volume mixing ratio, notated χX, to a concentration, notated [X], use the Ideal Gas Law to find the number of total molecules in a cm3 and then multiply by χX, expressed as a fraction. For example, let p = 960 hPa, T = 296 K, and χX = 60 ppbv, then the concentration can be calculated as follows:
Here we have used the Boltzmann constant k, which is simply the universal gas constant divided by Avogadro's number.
4.2 Changes in Atmospheric Composition
4.2 Changes in Atmospheric Composition
Since the Earth was formed more than 4 billion years ago, the atmosphere has changed profoundly. A wide variety of geochemical and ecological (fossil) evidence indicates that oxygen levels rose dramatically about 2 billion years ago. Such evidence also indicates that carbon dioxide levels were much higher earlier in Earth's history, which allowed the Earth to be at a habitable temperature despite the fact that the output from the Sun was much lower (about 25%) compared to today, resolving the so-called "Faint-Young-Sun Paradox." Below we discuss changes in atmospheric composition over the past 800,000 years, the past few hundred years, and the past several decades.
Changes over the past 800,000 years
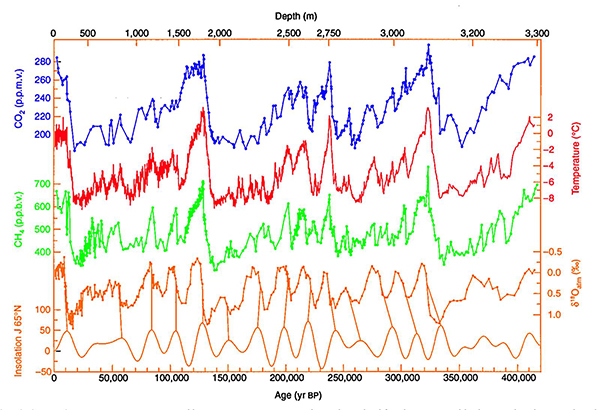
We have learned a lot about how atmospheric composition has changed from measurements of gases in bubbles trapped in ice cores. The figure below, which shows such measurements from an Antarctic ice core, reveals that two key greenhouse gases, CO2 and CH4, underwent large, rapid variations over the past 400,000 years. The variations are also periodic, with a rapid decline followed by a more gradual increase every 100,000 years or so, and are in roughly in phase with the temperature and out of phase with ice volume. The periodic variations reflect the coming and going of the ice ages. Similar cycles have been measured as far back as 800,000 years for CO2 and CH4 and other fossil evidence suggests that the current period of ice ages that we are in now began about 2.6 million years ago. These changes in CO2 and CH4 were driven ultimately by changes in the Earth's orbit and axis of rotation, which led to changes in the amount of solar radiation received at various latitudes during various seasons. Summer solar radiation at high northern latitudes is particularly important (bottom curve below), because it regulates how the large northern hemisphere ice sheets grow. These changes in solar radiation led to changes in Earth's temperature, ocean circulation, and other processes that influence atmospheric CO2 and CH4, which amplified the changes in Earth's temperature.
Changes over the past few hundred years
The Holocene period began about 12,000 years ago, at the end of the last ice age, and marks a period of relative stability in climate and atmospheric gas concentrations. During this time, the ice core data reveal that levels of CO2 and CH4 in the atmosphere were relatively constant, at about 280 ppmv and 650 ppbv, respectively. Then, as shown below, levels of both gases, as well as another greenhouse gas, nitrous oxide (N2O), increased rapidly about 200 years ago. These increases, which coincide with the industrial revolution, were due to anthropogenic activity, including the burning of fossil fuels and enhanced deforestation and agriculture. The increases in these three greenhouse gases are the primary cause of the warming of the Earth by about 1 oC over the past century.

Ice core data reveal many other interesting changes in the atmosphere that occurred during the last 200 years or so, particularly in the Northern Hemisphere. For example, within the ice itself, one can see increases in the amount of nitrate and sulfate [2], which are produced ultimately from the combustion of fossil fuels. These constituents are the key components of acid rain and, indeed, data from the same ice core also reveal an increase in acidity.
Changes over the past several decades
Changes in the composition of the atmosphere over the past several decades primarily reflect changes in human activity.
As fossil fuel emissions have increased over recent decades, so has the growth rate of atmospheric CO2, as indicated by the concave-upward curvature in the figure below. The growth rate has approximately doubled from about 1 ppmv per year in the 1960s to about 2 ppmv per year in the 2000s. According to the Global Carbon Project [3], 86% of the anthropogenic CO2 emissions during 2009–2018 were from fossil fuel burning and 14% were from land-use change (e.g., deforestation). However, CO2 injected to the atmosphere from human activity does not stay there. 44% of the emissions from human activity during 2009–2018 accumulated in the atmosphere, 29% were absorbed by terrestrial ecosystems, 23% were absorbed by the ocean, and 4% is unaccounted for (Global Carbon Project). Superimposed on the accelerating trend over the past few decades is an annual cycle in which CO2 declines during Northern Hemisphere summer and rises during most of the rest of the year. This cycle reflects photosynthesis (an atmospheric CO2 sink) and respiration (an atmospheric CO2 source) of terrestrial ecosystems in the Northern Hemisphere, where most land is present. Note that the current increase to above 400 ppmv now extends well above any other time in the past half 800,000 years, at least, when CO2 varied between about 180 and 280 ppmv.

The changes in methane over the past several decades are more complex than those of carbon dioxide. The figure below shows that the methane growth rate (the slope of the curve) gradually declined from the 1980s to roughly zero by the mid 2000s. Since then, the growth rate has increased, though it is still not as high as it was in the 1980s. A detailed budget of methane has been developed by the Global Carbon Project [3] and indicates that for 2008–2017 about 60% of the methane sources were anthropogenic (mainly from agriculture, waste, fossil fuel production and use, and biomass burning) and 40% were natural (mainly from wetlands, inland waters, geological sources, ocean, termites, wild animals, permafrost, and vegetation). The main sink of methane is oxidation by OH, which we will discuss later in this lesson, as well as consumption within soils. Despite our basic understanding of methane sources and sinks, we do not know why the methane growth rate has changed in the way it has over the past several decades. This is an important unresolved problem, because methane levels are very high currently. In 2019, the global-average methane mixing ratio was more than 1860 ppbv, which is well above values over the last 800,000 years, at least, which varied between about 400 and 700 ppbv.

Numerous lines of evidence show that water vapor is increasing in the atmosphere. Surface specific humidity measurements, which have been made mostly in the Northern Hemisphere, show clear trends, as indicated in the figure below. Data from satellites indicate that precipitable water (the total amount of water that is in a column from the surface to the top of the atmosphere) increased 1.49% per decade from 1988 to 2017 (Mears et al., 2005) [5]. These trends are generally consistent with expectations of a warming world and the Clausius–Clapeyron equation. Variability from year to year is also consistent with temperature change. For example, the increases in temperature resulting from the very large 1997–1998 El Niño event were accompanied by large increases in surface specific humidity and total precipitable water.

There are trends and variations in many of the other trace gases as well, such as chlorofluorcarbons, which are decreasing in abundance due to emissions reductions. There are other trace gases that increase as the sun rises and decrease as it sets and are heavily involved in atmospheric chemistry. We will talk about these gases next.
4.3 Other Trace Gases
4.3 Other Trace Gases
Hundreds of different trace gases have been measured in the atmosphere and perhaps thousands more have yet to be measured. Many of these are volatile organic compounds (VOCs). Volatile means that the compound may exist in the liquid or solid phase but that it easily evaporates. Organic means that the compound contains carbon but is not carbon dioxide, carbon monoxide, or carbides and carbonates found in rocks. There are also other chemicals like the nitrogen oxides (e.g., nitric oxide (NO), nitrogen dioxide (NO2), nitric acid (HNO3)), sulfur compounds (e.g., sulfur dioxide (SO2), sulfuric acid (H2SO4)) and halogen compounds (e.g., natural methyl chloride (CH3Cl), human-made chlorofluorocarbons (CCl2F2)). If we pay attention, we can often smell and identify many of these chemicals, even at trace levels, although some, like methane, carbon monoxide (CO), and chlorofluorocarbons, are odorless. We enjoy smelling the VOCs emitted by trees in a forest—aah, that fresh pine smell—but we hold our nose to escape the smells of a stagnant swamp.
In addition to these thousands of chemicals that are emitted into the atmosphere every day, there are also some very reactive compounds that are created by atmospheric chemistry and play the important role of cleaning the atmosphere of many gases. The most important reactive gases are ozone (O3) and hydroxyl (OH). We will focus the discussion of atmospheric chemistry on these two.
The Atmosphere’s Oxidizing Capacity
Earth’s atmosphere is an oxidizing environment. This term means what you think it would: gases that are emitted into the atmosphere react in a way that increases their oxygen content. Gases that contain oxygen tend to be “stickier” on surfaces and more water soluble, which means that they stick when they hit a surface or they can be readily taken up in clouds and rain drops and be deposited on Earth’s surface. We call gases hitting the surface and sticking “dry deposition” and gases being taken up in precipitation and rained out “wet deposition.”
Let’s consider a natural gas that is very important in our lives, methane, also known as natural gas. More and more methane is being extracted from below Earth’s surface and used to run our electrical power plants, heat our homes, cook our food, and, increasingly, to run our transportation vehicles. Methane is a simple molecule, CH4, in which each of carbon’s four bonds is made with a hydrogen atom. Energy comes from heating methane to high enough temperatures that cause it to react, giving off energy as more stable molecules are formed. In complete combustion, each methane molecule is converted into one CO2 molecule and two H2O molecules. In the process, four oxygen atoms or two oxygen molecules are consumed.
This same process occurs in the atmosphere, but at much lower temperatures and at a much slower rate. In both cases, the first step in the methane oxidation sequence is the reaction with the hydroxyl radical (OH). In water, hydroxyl loses an electron and is ionized (OH–), but in the atmosphere, hydroxyl is not ionized. We call OH a free radical because it has an odd number of electrons (eight for oxygen and one for hydrogen). Any gas with an odd number of electrons is reactive because the electrons want to be paired up in molecules because that makes them more stable.
Often, combustion is inefficient, resulting in the formation of carbon monoxide (CO). Examples include forest fires, humans burning fields to clear them for planting, poorly tuned vehicles, inefficient industrial processes, and other human-caused processes. The primary way that CO is removed from the atmosphere is by reacting with atmospheric OH. It takes a while for CO to be removed from the atmosphere by the reaction with OH, so that satellite instruments can track CO plumes as they emerge from their sources and flow around the world.
Where does OH come from?
Before we tackle this question, let’s first look at where ozone (O3) comes from. We will start with stratospheric ozone (a.k.a. good ozone because it blocks solar UV that harms humans, other animals, agriculture, and ecosystems) and then eventually we will consider tropospheric ozone (a.k.a. bad ozone, which is the ozone that hurts our health when we breathe it and that damages plants and their fruit).
Discussion Forum 2: Trace gases
For this week's discussion activity, I would like you to think about which trace gas is the most important and why. By trace gas I mean a gas with a mixing ratio of less than 20 ppm in the atmosphere. Defend your choice. Use information from this lesson as well as other sources (credit them, please!) to describe the qualities of this gas that make you think that it is the most important trace gas. Then read the choices of your classmates and respond to their choices and follow-up with further questions and/or analysis.
- You can access the Trace gases Discussion Forum in Canvas.
- Post a response that answers the question above in a thoughtful manner that draws upon course material and outside sources.
- Keep the conversation going! Comment on at least one other person's post. Your comment should include follow-up questions and/or analysis.
This discussion will be worth 3 discussion points. I will use the following rubric to grade your participation:
| Evaluation | Explanation | Available Points |
|---|---|---|
| Not Completed | Student did not complete the assignment by the due date. | 0 |
| Student completed the activity with adequate thoroughness. | Student answers the discussion question in a thoughtful manner, including some integration of course material. | 1 |
| Student completed the activity with additional attention to defending their position. | Student thoroughly answers the discussion question and backs up reasoning with references to course content as well as outside sources. | 2 |
| Student completed a well-defended presentation of their position, and provided thoughtful analysis of at least one other student’s post. | In addition to a well-crafted and defended post, the student has also engaged in thoughtful analysis/commentary on at least one other student’s post as well. | 3 |
4.4 Stratospheric Ozone Formation
4.4 Stratospheric Ozone Formation
Ozone is ozone no matter where it is in the atmosphere. Good ozone is good only because it is in the stratosphere where we cannot breathe it (see figure below). Bad ozone also absorbs solar ultraviolet light, but it is down near Earth's surface where we can breathe it. For UV protection, we are interested in the total number of ozone molecules between us and the Sun. 90% of ozone molecules are in the stratosphere and 10% are in the troposphere—some down near Earth's surface where we can breathe them. There are important issues affecting human and ecological health for both good ozone and bad ozone. For good ozone, the most important issues are the reduction of ozone globally, the Antarctic Ozone Hole, and Arctic ozone loss that is caused by chlorofluorocarbons. Reduced ozone means more solar UV gets to the ground causing more skin cancer. For bad ozone, the most important issues include the production of too much ozone in cities and nearby regions that is caused by too many pollutants from traffic, industrial processes, power generation, and other human activities. Increased ozone means more people have respiratory and heart problems. Let's look at both the good and the bad, starting with the stratospheric ozone.

To get the total amount of ozone between us and the Sun, we simply add up the ozone amount starting at the surface and going up to the top of the ozone layer. Note how much more ozone there is in the stratosphere. At higher latitudes, the bottom of the stratospheric ozone layer is at approximately 10–12 km. Recall the following image from Lesson 2:

The process of stratospheric ozone formation starts with ozone (O3), which is made by ultraviolet sunlight in the stratosphere (but not the troposphere, as we shall see). The two reactions are:
Note that N2 doesn't really react in this last chemical equation, but instead, simply bumps into the O3 molecule as it is being formed and stabilizes it by removing some of the energy from O3. We call O3 an oxidant because it can react with some compounds and oxidize them.
This O3 can be broken apart by ultraviolet light to make O2 and O. Usually O combines with O2 to form O3 in this way: O + O2 + N2 → O3 + N2, so nothing really happens, except that the solar energy that breaks apart the O2 ends up as extra energy for the O3 and for the colliding N2 and, as a result, ends up warming the air. Sometimes O collides with O3 and reacts as follows: O + O3 → O2 + O2. Putting all of the reactions together, we can see the chemical lifecycle of ozone in the stratosphere. This set of reactions was proposed in the 1930s by Chapman:
| O2 + UV → O + O | production |
| 2(O + O2 + N2 → O3 + N2) | cycling |
| O3 + UV → O2 + O | |
| O + O3 → O2 + O2 | loss |
| Net: UV → higher T | |
These four reactions could produce the basic characteristics of the ozone layer as it was in the 1940s through the 1970s. The basic ingredients are UV radiation and O2, which can help to explain why ozone reaches a maximum concentration at a certain height in the atmosphere–that is, why there is an ozone layer at all. At very high levels in the atmosphere (e.g., in the mesosphere), there is plenty of UV but too little O2 (simply because pressure decreases with height). On the other hand, at very low levels in the atmosphere (the troposphere), there is plenty of O2 but very little UV (because of absorption by O2 above). It's only in the stratosphere that there is enough of both UV and O2 to make plenty of ozone.
While Chapman's theory predicted the existence of an ozone layer, the theory produced peak ozone levels that were 50 milliPascals (mPa), not the 25–30 mPa seen in the first figure above. Thus, the measured levels of stratospheric ozone were about half of those predicted by Chapman's theory—it was a real puzzle. However, in the 1970s, scientists proposed new sets of reactions by other gases that accomplished the same results as the loss reaction shown above. A famous example involved chlorine, which comes mostly from human-made chlorofluorocarbons (CFCs):
| CFCs + UV → product + Cl | production |
| Cl + O3 → ClO + O2 | cycling |
| ClO + O → Cl + O2 | |
| Cl + CH4 → HCl + CH3 | loss |
| Net: O3 + O → O2 + O2 | |
During the cycle, chlorine (Cl) and chlorine monoxide (ClO) aren’t destroyed but instead are just recycled into each other. With each cycle, two ozone molecules are lost (one directly and a second because O almost always reacts with O2 to form O3). This cycle can run for hundreds of thousands of times before Cl gets tied up in HCl. So ClO and Cl levels of tens of parts per trillion of air (10–12) are able to destroy several percent of the few parts per million of O3. Sherry Rowland and Mario Molina figured this cycle out and wrote a paper about it in 1974. They received a Nobel Prize in Chemistry in 1995 for this work. When catalytic cycles involving chlorine, nitrogen oxides, and OH are included with the theory, the agreement between the theory and the measurements gets much better.

Check Your Understanding
Note that the total ozone amount at midlatitudes is greater than the amount in the tropics. This should seem strange to you because the solar UV that is part of the Chapman mechanism is strongest in the tropics. Why do you think that total ozone is distributed this way?
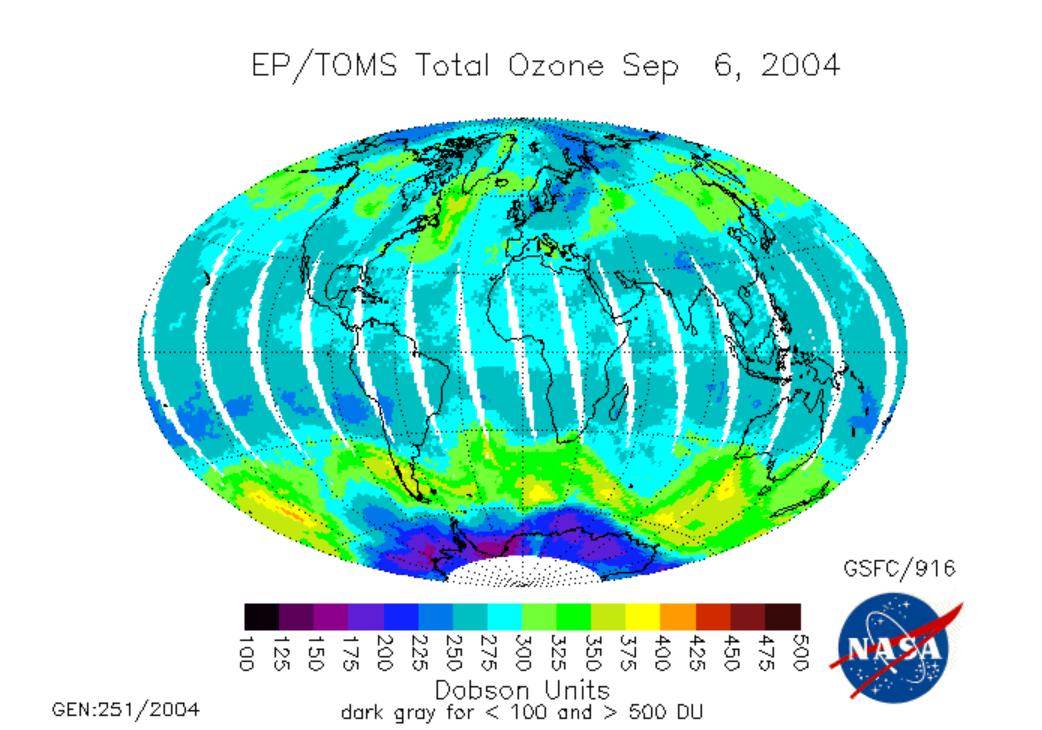
The low ozone over Antarctica above is the Antarctic Ozone Hole; the video below (:31) entitled "Ozone Minimums With Graph" (from NASA) shows changes in ozone concentration between 1979 and 2013. Video is not narrated:
The Antarctic ozone hole is an extreme example of the destructive power of chlorine catalytic cycles. Different catalytic cycles dominate the ozone destruction over Antarctica and, to a lesser extent, the Arctic. But, when aided by chemistry on the surfaces of naturally occurring polar stratospheric clouds, all the Cl in the form of HCl is liberated so that the polar catalytic cycles are able to destroy a few percent of the ozone per day in a plug the size of Antarctica from an altitude of 12 km all the way up to 20 km.
Fortunately, the amount of chlorine being injected into the stratosphere is decreasing due to the Montreal Protocol, the world’s first international global environmental treaty.
4.5 The Story of the Atmosphere's PAC-MAN
4.5 The Story of the Atmosphere's PAC-MAN

The atmosphere's oxidation capacity is its ability to clean itself of all of the gases that are emitted into it. What does stratospheric ozone have to do with the atmosphere’s oxidation capacity, which mostly occurs in the troposphere and mostly by the atmosphere's PAC-MAN, hydroxyl (OH)? It turns out that natural dynamic processes actually pull air down from the stratosphere and mix it into the troposphere, eventually mixing some of this ozone to Earth’s surface. This naturally occurring surface ozone provides a baseline value for near-surface ozone, but ozone pollution is more than ten times greater than this baseline in cities. Ozone is both sticky on surfaces and fairly reactive in the atmosphere. It is lost both by depositing on surfaces and through being chemically destroyed by reactions in the atmosphere.
The following chemical sequences are the humble beginnings of the atmosphere's PAC-MAN. OH is generated throughout the stratosphere and troposphere by a two-step reaction sequence. The first step is:
where O* is an excited-state oxygen atom that has extra chemical energy. O* can lose this extra energy by colliding with N2 and O2, but it can also collide with a water molecule to make two OH molecules:
OH is very reactive. You can think of OH as being water that has had a hydrogen taken away and wants it back. There are other sources for OH, but this one is the most important globally. OH reacts with many other atmospheric constituents. In fact, it is so reactive, that its lifetime in the atmosphere is less than a second.
Another important oxidant is nitric oxide (NO). It comes from combustion (power plants, internal combustion engines, fires) or lightning. In cities, the NO mixing ratio is tens of ppbv during morning rush hour and a bit smaller during evening rush hour, but there is typically about a ppbv around during the day. In very remote areas, the levels of NO are a hundred times less. NO can react with many chemicals, but a particularly important reaction is with O3:
which forms nitrogen dioxide, NO2. NO2 is not very stable:
but the O reacts immediately with O2 to form ozone:
If an NO2 molecule is produced, then an O3 molecule will be produced during the day when the sun is out. Note that if we think of these three reactions as a cycle, no ozone was either created or destroyed because it is destroyed in [4.5] and created in [4.2].
What happens to all of the methane emitted into the atmosphere?
Methane is a volatile organic compound (VOC). Methane oxidation is a good model for what happens to all of the volatile organic compounds that you smell every day and all the ones that you can’t smell. I am not going to show you the entire reaction sequence. Instead, here are just a few steps.
The first step is the reaction between methane and hydroxyl:
Note that water vapor is made and CH3 is a radical because it has 6 + 3 = 9 protons and, therefore, 9 electrons. Just as for most other VOCs and some other trace emissions, the reaction with OH is the main way methane is removed from the atmosphere. Otherwise, it would build up to high abundance.
CH3 is very reactive. It combines with O2:
If there is any NO around, the following reaction happens:
followed by:
and:
The chemical CH2O is formaldehyde. Some of you may have encountered it in high school chemistry or biology and so may be familiar with the smell. You also see that we got the OH molecule back.
Ultimately, formaldehyde gets broken down to CO and the net reaction of methane oxidation is:
Remember that NO2 is easily broken apart by the UV sunlight that reaches Earth’s surface, so we can take this reaction sequence a step further and show that in the presence of sunlight, reactions [4.6] and [4.2] give:
or
In this final chemical equation, we do not see OH, HO2, NO, or NO2, yet they are essential to the formation of ozone. They are catalytic, which means that they are neither created nor destroyed in the reaction sequence, but instead are simply recycled between OH and HO2 and between NO and NO2. There are other reactions that destroy these reactive chemicals by producing other chemicals that are much less reactive and sticky, a main one being:
where HNO3 is nitric acid, a very sticky and water-soluble chemical. However, each OH that is produced can typically oxidize more than ten methane molecules before it reacts with NO2 to form nitric acid. And as reaction [4.13] shows, each time methane is completely oxidized, two O3 molecules are produced. That's a lot of chemical steps to remember, but I don't want you to necessarily remember them. I want you to see that the process started with a reaction of OH with a volatile organic compound (in this case methane) and that in the subsequent reactions, the product molecules had more and more oxygens attached to them. This process is why we say that the atmosphere is an oxidizing environment.
Where does ozone pollution come from?
Ozone is a different sort of pollutant from others because it is not directly emitted by a factory or power plant or vehicle but instead is produced by atmospheric chemistry.
Three ingredients are needed to make ozone pollution: volatile organic compounds (VOCs) (like methane); nitric oxide (NO from combustion); and sunlight. When we say this, we assume that we already have some ozone and water to provide the OH to get the reactions started. Every VOC goes through an oxidation process that is similar to the methane oxidation reaction sequence. In the methane oxidation sequence, steps [4.9] and [4.11] make NO2, which in the presence of sunlight makes ozone through step [4.6] followed by step [4.2]. Voila! Ozone is formed from methane oxidation in the presence of nitrogen oxides and sunlight. Now imagine the thousands of volatile organic compounds in the atmosphere and realize that all of them—both anthropogenic and natural—can participate in the production of ozone pollution. Now you have seen the sequence of chemical reactions that produce tropospheric ozone.
Let's look at a video (3:14) entitled "Ground Level Ozone: What Is It?" that explains ozone production without getting into the gory details of the chemistry.
Ozone pollution is bad for the health of people, crops, and forests. Ozone can react with some types of VOCs, including types that make up our lungs, and breathing it can cause serious health problems and even death. Ozone reacts with the VOCs that make up plants and stunts their growth and damages their fruit. The Clean Air Act from the 1970s has dramatically decreased the levels of air pollution in the United States, including ozone. The EPA can take the credit for much of the progress against air pollution in the United States. But there is still a ways to go and the progress may be reversed due to effects of climate change. Since ozone pollution increases at higher temperatures, the increases in global temperatures could actually reverse the steady progress in ozone reduction and ozone pollution could once again increase, unless volatile organic compounds and nitrogen oxides are reduced even more.
Now you can see why OH is called the PAC-MAN of the atmosphere. But how can we tell how long it will take for OH to remove from the atmosphere some trace gas like methane? Let’s look at an equation for the budget of methane. It is produced in the atmosphere by all the emissions from cows and wetlands. It is removed from the atmosphere by reactions with OH [4.7]. The rate of removal, that is the change in the methane concentration with time, is always proportional to the amount of the two reactants, in this case, CH4 and OH. So, the change in methane with time is given by the balance between methane production and methane loss by reaction with OH:
where kOH+CH4 is the reaction rate coefficient (units: cm3 molecule–1 s–1) and [OH] and [CH4] are the concentrations of OH and CH4 (units: molecules cm–3). Note that the production is positive and increases CH4 with time while the loss is negative and decreases CH4 with time.
We use [OH] to indicate the concentration of OH (molecules cm–3), which is quite different from the OH mixing ratio, which is usually expressed in ppt (10–12). Note that 1 ppt ~ 2.4 x 10⁷ molecules cm–3 for typical surface conditions. See the video below (1:47) entitled "Rate Equation" for further explanation:
How can we find out what the lifetime of methane is? We assume that the production suddenly stops and equals 0. Then [4.15] becomes:
kOH+CH4 is the reaction rate coefficient for this reaction. Assume that OH is constant. Because OH is generated mostly from sunlight, it follows the sunshine and is greatest near midday and is very small at night. However, we assume that the OH concentration is the average over the day and night in order to assign it a constant value. Now integrate both sides of the equation:
So we see that methane decreases exponentially with time.
The lifetime of an atmospheric constituent is defined as the time it takes that constituent to decrease to e–1 = 0.37 of its initial value once production stops. So the lifetime of methane in the atmosphere is the value of t when kOH+CH4[OH]t = 1, or:
where τ indicates the lifetime. kOH+CH4 = 3 x 10–15 cm3 molecule–1 s–1 and [OH] ~ 106 molecules cm–3, so:
This reaction rate coefficient is fairly low. Other VOCs have reaction rate coefficients that are typically hundreds to hundreds of thousands of times greater, so the lifetime of most VOCs is hours to days.
The atmospheric lifetime of a gas is very important for determining how far a gas can travel from its source. Some trace gases have lifetimes of hours, so unless they are made by atmospheric chemistry, they can't travel more than a few tens of kilometers from their sources. Other gases have much longer lifetimes; methane is a good example with its 10-year lifetime. In 10 years, it can travel from its sources to most anywhere around the globe, even to the stratosphere. NASA measures the amounts of several gases from space. An excellent NASA website for accessing these satellite data and having it plotted as global maps is the Center for Trace Gas Data & Information Website at the NASA Goddard Space Flight Center's Earth Sciences Distributed Active Archive Center (GES DISC) [7].
This concept of atmospheric lifetime is very important. For instance, what if an industry is spewing a chemical into the atmosphere that is toxic at a certain concentration in the atmosphere? Then it is important to know if that chemical is removed in less time than it takes to become toxic or if it is going to continue to build up at toxic levels and not leave the atmosphere for a long, long time. If the chemical's atmospheric lifetime is hundreds to thousands of years, then maybe we shouldn’t let that industry dump that chemical into the air.
Now it is your turn to solve some problems concerning the atmospheric lifetimes and rates of change for atmospheric constituents in a quiz.
Quiz 4-1: Atmospheric lifetimes calculations.
- Find Practice Quiz 4-1 in Canvas. You may complete this practice quiz as many times as you want. It is not graded, but it allows you to check your level of preparedness before taking the graded quiz.
- When you feel you are ready, take Quiz 4-1. You will be allowed to take this quiz only once. Good luck!
4.6 Where do cloud condensation nuclei (CCN) come from?
4.6 Where do cloud condensation nuclei (CCN) come from?
Now that you've learned about the atmosphere’s gas-phase composition, it is time to look at its particle composition. We are interested in atmospheric particles for several reasons:
- smaller ones can get into the lungs and cause serious health problems;
- smaller ones can absorb or scatter sunlight, thus affecting climate;
- some of them are good cloud condensation nuclei, which are essential for the formation of clouds.
Atmospheric aerosol is most obvious to us on warm and muggy summer days. Under these conditions, there are lots of aerosol particles and they absorb water and swell up to a size that is quite efficient at scattering sunlight. The following picture was taken over Maryland on a flight between Washington Dulles airport and State College airport. Above the fair-weather cumulus clouds is blue sky in the free troposphere. Below the clouds is the atmospheric boundary layer, which is filled with aerosol that has been well-mixed by warm, moist air parcels rising and stirring the boundary layer air. The haze is so thick that it is a little hard to see the ground.

Atmospheric particles come from many different sources. Good cloud condensation nuclei (CCN) must be small particles, so that they do not settle too fast, and must be hydrophilic, which means that water can stick. They can be either soluble (i.e., dissolvable in water), or insoluble, but most are soluble.
Most particles originate from emissions from Earth’s surface. Primary aerosols are emitted directly from the source, although the smaller ones start off as hot gases that rapidly condense to form particles even before they leave the smokestack or tailpipe. Secondary aerosols are gaseous emissions that are converted to aerosol particles by chemical reactions in the atmosphere. Some of these become CCN. This process is often called gas-to-particle conversion. Most CCN are secondary aerosols.
The sources of aerosols are both natural and anthropogenic (human-made). Seaspray, volcanoes, forests, and forest fires, as well as gas-to-particle conversion of naturally occurring gases such as sulfur dioxide (SO2) and some naturally occurring VOCs, such as α-pinene (which gives the pine smell) are important natural particle sources. Industry, power plants, using fires to clear cropland, transportation, and gas-to-particle conversion of anthropogenic SO2 and numerous other gas emissions are important anthropogenic particle sources.
Note that we must pay attention not only to the aerosol sources but also the aerosol sinks, as shown in the diagram below.

The different sources make particles of different sizes. The typical size distribution (i.e., number of particles in a volume of air, plotted as a function of size) has bumps in it, with more particles at some sizes than at others, as seen in the diagram below. Reading these bumps tells us a lot about how the particles were made.
The nucleation mode (there are other designations for this) includes particles that are made by gas-to-particle conversion. A low-volatility vapor is one that will condense onto particles or other surfaces when its vapor pressure exceeds its low saturation vapor pressure. This situation is analogous to water.
The coarse mode includes particles made by mechanical processes. The hydrophilic coarse particles can be CCN, but they settle out pretty fast.
The accumulation mode includes particles that are usually made when nucleation particles collide and stick (called coagulation) or when gases accumulate on a nucleation mode particle. The accumulation mode particles neither settle fast nor coagulate, so they tend to hang around in the atmosphere for a few weeks. They make pretty good CCN.

PM2.5 - Secondary Particles from Gas-to-Particle Formation
PM2.5 is a particle size designation that means “Particle matter smaller than 2.5 µm in diameter.” Another common term is PM10, which is "particle matter smaller than 10 µm in diameter." PM2.5 particles are the ones that are most important for human health and climate, and, in many cases, cloud formation, because of their longer lifetime in the atmosphere.
Secondary particles start with the emission of VOCs or sulfur compounds, which react mainly with OH to start a sequence of reactions. These reactions tend to add oxygen to the molecules, which chemically makes them stickier (with a lower saturation vapor pressure) and more water soluble, which is just what is needed to make them better cloud condensation nuclei.
For particles that start as gaseous sulfur compounds, such as sulfur dioxide (SO2), the reaction sequence starts with OH and the reaction product is sulfuric acid, a compound that has a very low vapor pressure and is very sticky:
Sulfuric acid is easily taken up into cloud drops and raindrops and then can be deposited on Earth’s surface when it rains. The good news is that the rain cleans the atmosphere. The bad news is that the rain is very acidic and has earned the name “acid rain” because of its harmful effects on forests and on buildings, memorials, and statues.
If sulfur sources are upwind of an area, the particles in that area will contain some sulfur. But almost all atmospheric particles also contain some organic compounds and sometimes particles are mainly made up of carbon-containing organic compounds. Some of these organic particles are primary, but most of the small ones are made by gas-to-particle conversion, which is just a simple way to say the volatile organic compounds react in the atmosphere with OH or O3 to form less volatile organic compounds that become aerosol particles. The chemicals in these particles can continue to oxidize, thus making them even better CCN.
We can demonstrate gas-to-particle conversion of a VOC that is often emitted into the atmosphere by trees. This compound is limonene and also comes from oranges. In the video (4:47) below entitled "Demonstration of Gas-to-Particle Conversion," I will use orange peel to demonstrate this effect.
Quiz 4-2: Atmospheric constituents and chemistry.
- Please note: there is no practice quiz for Quiz 4-2 because the answers come right from the text and videos. Read and re-read the material (and ask questions in the discussion board in Canvas) until you understand it.
- When you feel you are ready, take Quiz 4-2. You will be allowed to take this quiz only once. Good luck!
Summary and Final Tasks
Summary and Final Tasks
Atmospheric composition, even of trace gases, has a huge influence on weather and climate. Carbon dioxide is the most abundant trace gas – its mixing ratio is 400 ppm and growing, but other trace gases are also emitted into the atmosphere. The atmosphere cleans itself of these gases by atmospheric chemistry, which oxidizes the gas emissions and produces new chemicals that contain oxygen and so are stickier and more water soluble.
These new chemicals can be removed from the atmosphere either by hitting surfaces and sticking or by being taken up in clouds or rain drops and precipitated to the ground. The main oxidant is hydroxyl (OH), which is made with ozone, UV sunlight, and water vapor and starts the removal sequence by reacting with gas emissions. In these reaction sequences ozone pollution is produced if the pollutant nitric oxide (NO) is also present.
This pollutant ozone is nearby and is harmful to human health and agriculture. Stratospheric ozone, on the other hand, shields Earth from harmful UV, and is made a completely different way – by the breaking apart of O2 to produce O, which reacts readily with O2 to form O3. Some of this stratospheric ozone is then transported to Earth, but at levels much lower than pollutant levels. Methane oxidation is an example of the VOC reactions that produce ozone and particles.
An important concept is the atmospheric lifetime of gases and particles. This can be determined by solving a simple linear differential equation. The methane lifetime was shown to be about 10 years.
Particles have many natural and anthropogenic sources; some are emitted directly from the sources (primary particles) and some are produced by atmospheric chemistry (secondary particles). Particles affect human health, visibility, scattering and absorption of light, and are essential for cloud formation, as will be seen in the next lesson on cloud physics.
Reminder - Complete all of the Lesson 4 tasks!
You have reached the end of Lesson 4! Double-check that you have completed all of the activities before you begin Lesson 5.