Lesson 6.4 Risk Management
Lesson 6.4 Risk Management
Life is fraught with hazards. At the moment we are concerned with hazards in the workplace, e.g. the mine or the plant. What do we mean by hazard? A hazard is a situation that presents with a likelihood of adverse consequences. A weak and unsupported roof represents a ground fall hazard, accumulated rock on the walkway next to a conveyor represents a tripping hazard, and a cutting operation in a dimension stone plant represents a respirable dust hazard.
We talk about risk, but what do we mean when we use this term? Risk is a situation involving the chance of loss or injury. On the face of it, there seems to be little difference between the definition of a hazard and a risk. However, there is a subtle but important difference. Risk is taking into account how likely it is that a loss will occur. The weak roof mentioned earlier presents a hazard because it could collapse, and if someone is underneath that spot when the fall occurs, something bad will happen to that person. Whether or not this represents a risk depends on whether or not a collapse is likely to affect anyone. If it is in a remote area of the mine where no one works or travels, the risk is minimal. If it is in the main travel way into the mine, the risk is huge.
It is useful to talk about risk factors as part of this discussion as well. Risk factors are conditions or behaviors that increase the chance of loss or injury. As an example, consider accidents involving surface haul trucks. What are some of the risk factors that could individually or in combination increase the likelihood of an accident? Poor visibility (night time or foggy conditions), deterioration of the berms, operator impairment (drugs or alcohol), operator fatigue, equipment malfunction, and so on. The value of identifying the risk factors will become apparent shortly.
Risk is an inevitable part of our lives at work and play. The challenge is to reduce the likelihood that a risk will lead to a loss or injury, and we meet this challenge by managing the risks. Risk management first requires that we identify the risks. Then if practicable, we work to eliminate them, and failing that we endeavor to mitigate the risks. Elimination while most desirable is often not possible. Think about the risk associated with crossing a busy street. We can’t eliminate the traffic, but if we could build a pedestrian bridge over the street we would effectively eliminate the hazard posed by the traffic. Unfortunately, there are few instances where building such a bridge is practicable. Thus, we will need to mitigate the risk. We might do this using engineering controls such as putting in a traffic light with a pedestrian signal. We might also use a behavioral intervention, where we train everyone who will cross a street to look both ways before stepping off the curb, or we might also employ an administrative control where we have a policy that no one is allowed to cross the street except at intersections. These actions 6 to mitigate the risk will significantly reduce the likelihood of a pedestrian being killed while crossing the busy street. Despite our best efforts, however, a small amount of risk still exists. Indeed, this is the norm, and we ultimately accept some level of risk in our lives whether it is flying in an airplane, investing in the stock market, or eating too many sweets. The challenge is to know when we have reduced the risk as low as reasonably achievable.
The process of identifying risks, risk factors, and the options for mitigating the risk need not be performed in an ad hoc or casual manner. There are many well developed methods for analyzing risk, and each has its advantages depending on the application. There are two simple but powerful tools for analyzing mining risks.
The first is the so-called risk assessment matrix, and it is based on the principle that risk is a function of the probability of occurrence and the severity of the consequence if the event occurs. You can think of it as risk being equal to the product of this probability and consequence metrics. However, to be clear, for mining applications this is a qualitative assessment because we generally do not have quantitative knowledge of either the probability of occurrence or the severity of the consequence. Generally, we do have a qualitative understanding, and that makes this assessment matrix very useful to prioritize our risk management activities. Let’s take a look at Figure 6.4.1.
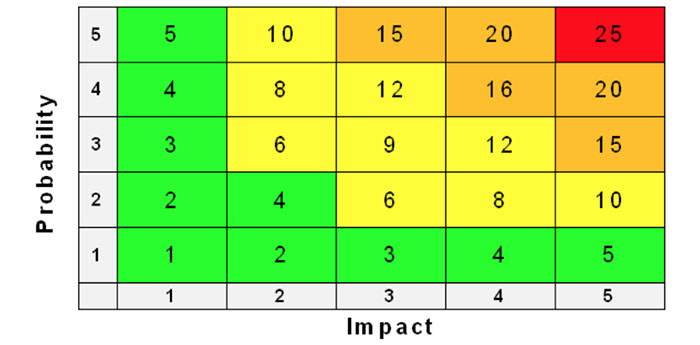
The rows are a measure of probability of occurrence and the columns represent the impact or severity of the consequence. The likelihood of occurrence begins with a “1” at the bottom row and increases to a “5” at the top row, in which the probability of the event occurring increases as we move from the bottom to the top row. Similarly, the impact of the occurrence begins with a “1”, representing the least impact, at the left-most column and ends with a “5” designating the greatest impact at the far-right column. The numbers in the cells represent the risk as the product of probability and impact. The larger the number, the more serious the risk. In this figure the colors have been added to underscore the severity of the risk with green representing minimal risk and red representing extreme risk.
You are probably wondering, how to assign the probability and impact score to a specific event. In most cases, we use a qualitative scale. As long as we are consistent in using the same scale, we can compare and assess the many risks that might be present at our mine. As an example, we might standardize on the follow scale of 1 to 5, where 1 represents the lowest level of probability or impact, and 5 represents the highest level:
| Probability | Impact | |
|---|---|---|
| 1 | very unlikely to ever happen | no injury or insignificant operational cost |
| 2 | unlikely, but such events have occurred | minor injuries or minor operational costs |
| 3 | likely, not common by does occur | significant injuries, operation costs |
| 4 | likely, these have occurred here | severe injury, likely fatality, significant costs |
| 5 | highly likely, they occur from time-to-time | multiple fatalities, major operational costs |
Another very useful tool for mining risk management is bowtie analysis (BTA). This tool combines in one diagram causes and consequences as well as control and recovery measures. A bowtie is illustrated in Figure 6.4.2. The center of the bowtie represents the event, e.g. haul truck accident, a mine explosion, or a conveyor belt fire. The potential causes of the event are placed on the left side of the bowtie, and the consequences of the event are placed on the right side. Dashed lines connect the causes with the event and the consequences with the event as shown.
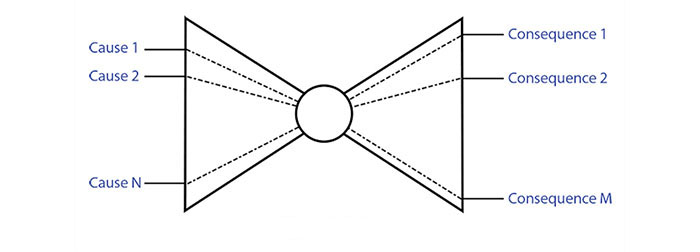
On the left half of the bowtie we will place “barriers” along the dashed lines. These barriers represent actions that we can take to prevent the cause from leading to the event. On the right half of the bow we will again place “barriers” along the dashed lines. These barriers represent actions that we can take to lessen the impact of the event or even to prevent certain consequences from occurring.
Let’s look at an example, and for this example, let’s choose a mine explosion as the event of interest, and we’ll keep it simple to illustrate the concept. First, let’s identify causes that lead up to a mine explosion, and similarly, let’s identify the consequences of the event, i.e. the mine explosion.
Causes of this event are:
- Explosive concentration of methane
- Ignition source
The consequences of an explosion are:
- Miners die from breathing toxic levels of carbon monoxide
- Fire
- Miners in immediate proximity to the explosion are killed by the force of the explosion
- Miners die while attempting to escape from the mine
Next, we’ll want to identify control and recovery measures. A control measure for preventing an explosive concentration of methane is adequate ventilation. A control measure to prevent an ignition source is to use only electrical equipment that is certified as permissible for use in explosive environments. Another control is to equip the machines with methane monitors, which will cause them to shut off if elevated levels of methane are detected.
Providing self-contained self-rescuers (SCSRs) is a recovery measure that virtually eliminates the outcome of dying from CO poisoning. Miners in the immediate vicinity of an explosion will be killed by the air pressure blast, and there are no known controls to change this outcome. Providing quarterly training to miners on self-escape will improve their chances of safety exiting the mine. If they have access to functioning wireless communications equipment to allow communication with the outside world, their chances of safely exiting the mine are improved.
Certainly, we can identify additional root causes, outcomes, control measures, and recovery measures. However, the ones that we have chosen to list here illustrate the technique. The bowtie shown in Figure 6.4.3 is populated with this information that we identified.
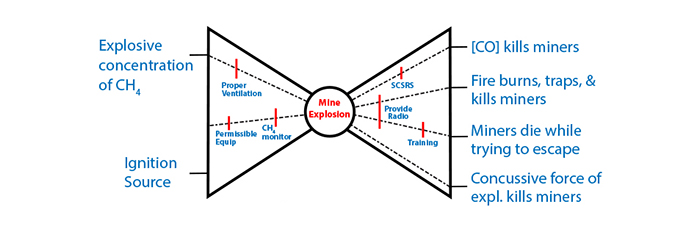
As you look at this bowtie, and the lists that we just made, you may be wondering what useful purpose is served by completing the drawing of the bowtie, rather than working from the lists. In relatively simple and straightforward cases like the one we completed for this example, the only purpose served is a graphic for others to examine and discuss. In more complicated cases, and cases in which all controls or recovery measures are not yet identified, the diagram does serve as a useful tool to facilitate the process. This is especially true if there are interactions between certain controls or recovery measures that need to be identified and taken into account. A more general representation of the bowtie is shown in Figure 6.4.4.
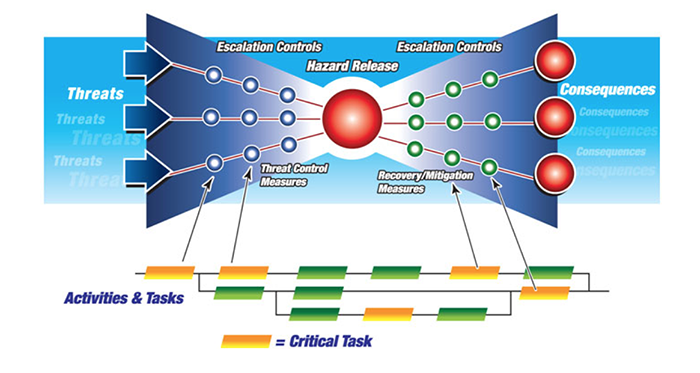
I’ve deliberately used different terms on this bowtie from those I used in my example. Many of these words are used interchangeably, and it is good to be aware of this. Threats and causes are substantially the same, as are consequences and outcomes. The hazard release is the event. The control measures and recovery measures represented on this figure are similar to the nomenclature that I used earlier. No doubt you noticed the addition of a critical path diagram at the bottom of the bowtie. This is not an essential part of bowtie analysis, but its addition to the graphic is a powerful complement to bowtie analysis and this further enhances the planning stage of risk management.
As I mentioned earlier, there are a couple dozen different tools available to do a risk analysis, but only a few lend themselves to the qualitative scenarios encountered in the majority of mining applications. In addition to the risk assessment matrix and bowtie analysis, job hazard analysis (JHA) and workplace risk assessment and control (WRAC) are commonly employed. JHA is particularly useful for studying specific jobs or tasks such as operating a haul truck or changing the bits on a cutting drum. WRAC is a useful tool to conduct a preliminary assessment of risk, but many who do this prefer to use bowtie analysis instead.
6The hierarchy of controls, going from the most to least reliable and effective is: engineering controls, administrative controls, and the use of personal protective equipment (PPE). PPE was not used in this example because it wasn't applicable. Examples of PPE would include respirators to limit dust exposure, earplugs to limit noise exposure, and safety glasses to reduce the chance of eye injury from foreign objects. Simplistically, the effectiveness of engineering controls at the top of hierarchy do not depend on people to mitigate the risk, whereas the bottom of the hierarchy, PPE, will be effective only if people remember to use it and use it correctly.
6.4.1 Application to an Environmental Problem
6.4.1 Application to an Environmental Problem
Compliance with environmental regulations is an important part of the job nearly every day, and especially at surface mining sites. As with safety and health, mere compliance with the regulations is not sufficient if you are thinking in terms of sustainable development. All of the guidance given in this lesson applies to environmental as well as safety and health considerations. To illustrate this, let’s “talk through” a risk management problem related to protecting the environment, and you will soon see that the process is the same regardless of whether we are examining a safety, health, or environmental risk.
The Bedrock Quarry is located in a rural valley with no close neighbors. One neighbor of note is a large state-operated fish hatchery, which sits a few miles from the quarry. This is of note because the quarry discharges several hundred thousand gallons of water per day, and this discharge feeds into the stream feeding the hatchery. Interestingly, the fish hatchery loves the mining operation because the water they discharge is of higher quality than the normal stream water! It’s not often that a mine has a neighbor who loves them! Of course, there is a potential downside to this scenario: if the mine’s discharge should be contaminated, it could wipe out the entire hatchery. Think about the ensuing public relations disaster!
This is the kind of problem that you would tackle with your risk management tools. It is understood that you are operating with an EPA approved storm water pollution prevention plan (SWPPP), and as part of this plan, your company will have identified the day-to-day activities required to remain in compliance with the requirements of the Clean Water Act. Here we are not talking about redoing this plan or setting it aside. Instead we are going to take a fresh look to determine if we are doing everything that we reasonably can to protect the water supply. Remember, compliance alone may not be sufficient to prevent a mishap, and if we are truly mindful of staying within the bearable and viable regions of the sustainability diagram, we need to go above and beyond compliance!
As the first step of any risk management exercise, we need to put together a team. The team should include people with unique knowledge to contribute to the process, and at a minimum should include someone from operations management, an engineer, a safety or environmental staffer, and one or more miners. With the team duly constituted, there are some steps to be taken to help the individuals on the team to function as a team. These are beyond the scope of this discussion, but please realize that you can’t throw five people together, call them a team, and expect that they will function successfully as a team!
The Plan-Do-Check-Act paradigm, which was illustrated in Figure 6.3.4, provides a good road map for the team. As part of the planning, the team will define the objective, which is to ensure that the discharge water is always pure; and then they will define the tasks they believe need to be completed. The tasks will include reviewing the existing SWPPP, auditing the quarry’s performance under the existing plan, conducting a site assessment, performing a risk analysis and a risk mitigation/elimination study. The site assessment will involve several subtasks. Assignments for completing these tasks should be made and a schedule adopted. The person(s) accountable for completion of the tasks should be identified. Once these tasks have been completed, the risk management study can be conducted. The risk assessment matrix can be used to prioritize the risks that will be investigated, and then BTA or another tool of the team’s choosing, can be used to identify needed controls and recovery measures.
Once the controls and recovery measures have been identified, they need to be evaluated for practicality. Some of these may require design and construction, such as swales and rip rap lined ditches. Others may require adoption of operating procedures, such as regular inspections of fuel storage tanks and the prompt use of sorbents in the maintenance shop to cleanup spills. The monitoring and sampling program may require modifications. The “Do” stage of the paradigm, i.e. implementing the findings from the planning phase can be substantial, involving multiple personnel and requiring a period of time and significant resources to implement. This must be carefully scheduled and resourced.
All of the effort expended to reach the end of the “Do” stage will be wasted if a formal effort to verify that the risk management measures have been implemented. Moreover, the controls as implemented should be assessed to determine whether or not they are performing as expected. Of course, if the “Check” stage reveals gaps or shortcomings, they must be acted upon. This “Act” stage should not be treated as an afterthought; rather, the need to “close the loop” must be anticipated and built into the team’s charge. Adequate resources must be provided for this stage as well.
While the primary purpose of this environmental example was to illustrate the applicability of the management system approach, it should be noted for completeness that the Plan-Do-Check-Act paradigm is really an ongoing process, and the next key action would be to perform regular audits, as mentioned earlier.