
Well Hydrographs
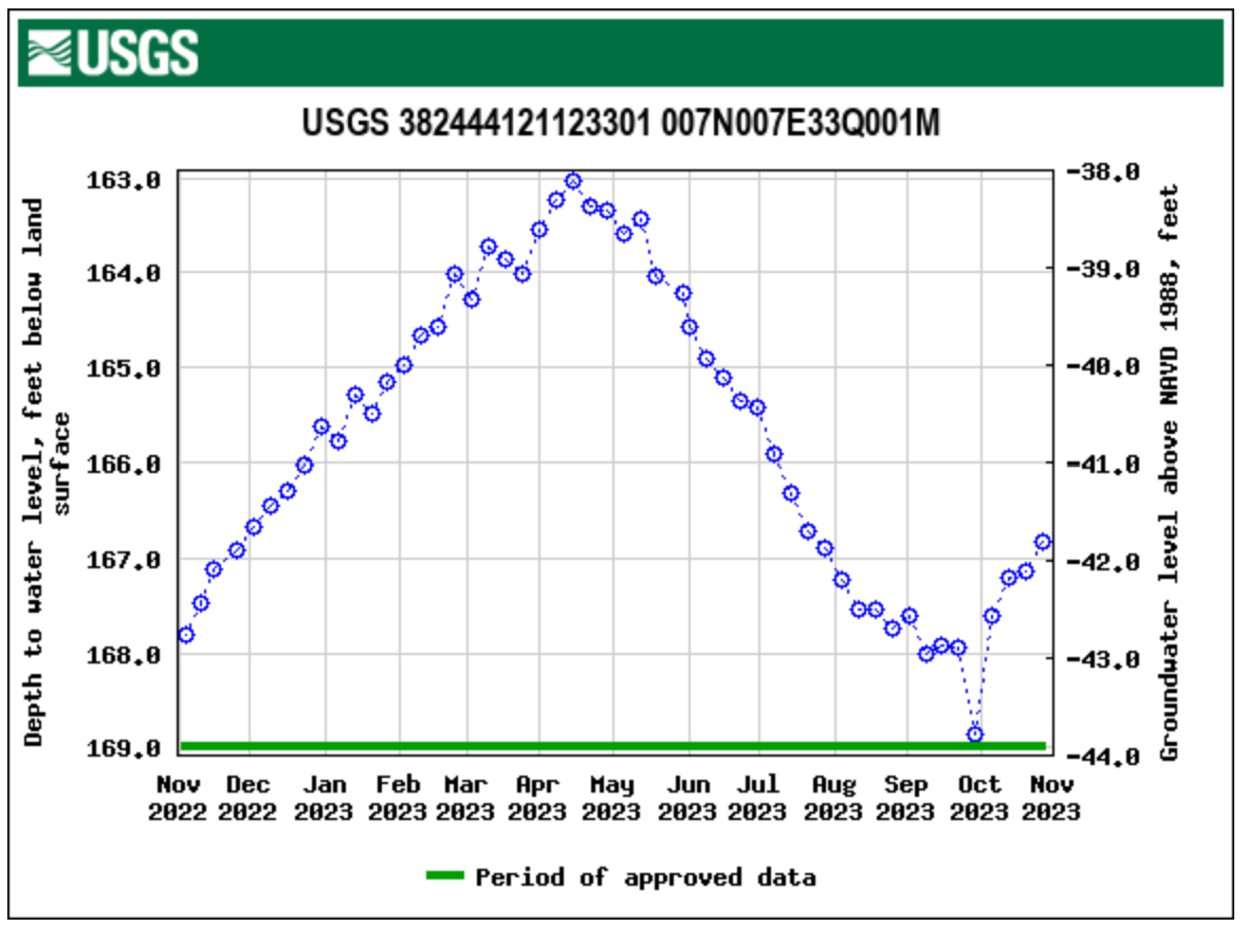
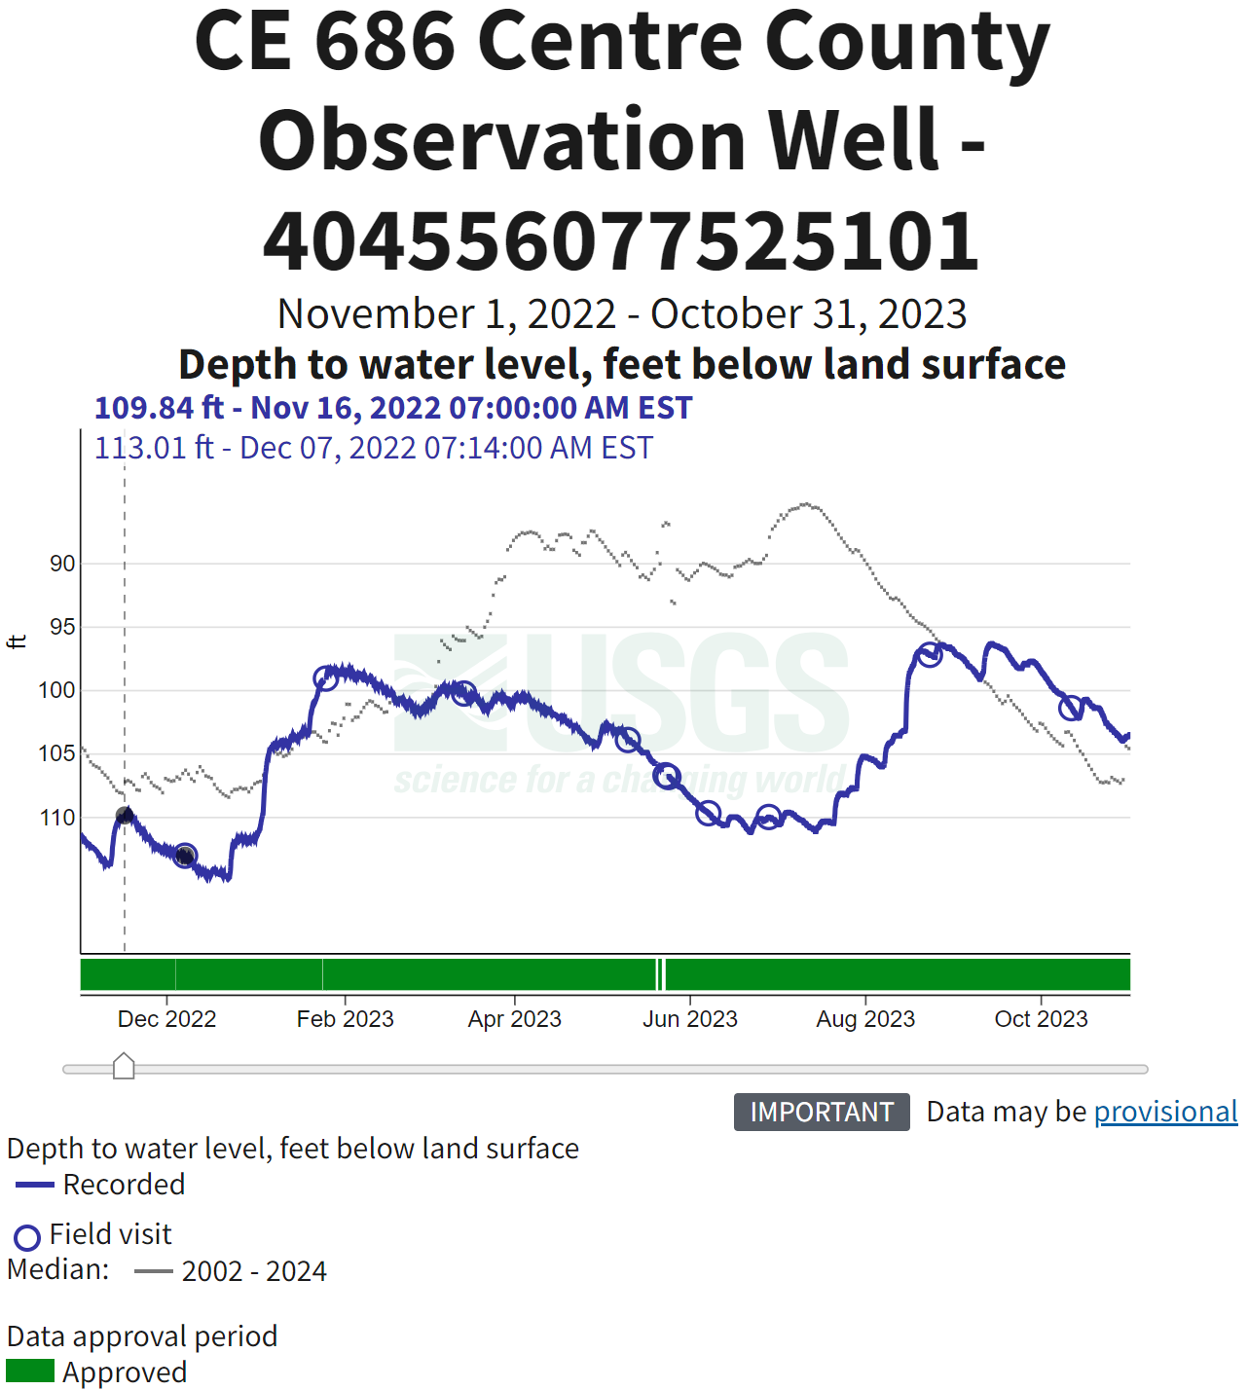
Just as river hydrographs are used to record and visualize variations in flow with time (as discussed in Module 4), a well hydrograph is a time series of hydraulic head recorded in a well. This provides information about the fluctuation of hydraulic head (equivalent to the water table in an unconfined aquifer), which reflects the combined effects of temporal variations in climate, recharge, and pumping (Figures 30-31). The U.S. Geological Survey maintains a database of active monitoring wells in major aquifer systems across the United States. Hydrographs provide information about seasonal patterns that may be associated with pronounced wet and dry seasons typical of some regions (for example, Central CA), as well as long-term trends driven by climate change, decadal-scale climate patterns like el nino, prolonged groundwater extraction, or human-induced modifications to natural recharge. We’ll cover examples of the latter two processes in the next section of the module (Module 6.2: Water budgets).
USGS
Video: Slag Heap Experiment (3:46)
Now that we've thought about how and why groundwater is moving through this system, we want to use the groundwater model to make some predictions about how a contaminant would move through the groundwater system. Let's imagine our model represents a geologic cross-section under the East Helena smelter site, and we want to think about how contamination from the slag heap would move through the groundwater system.
So, this slag heap was rained on. Arsenic and selenium from the slag would leach into the groundwater system. How do we think that contamination will move through this system and why? Take a minute to think about how and why contamination will move through this groundwater system.
Okay, so now we're going to add some dye at the location of the slag heap and see where that contamination moves in our model of a groundwater system.