So far, we have examined the energy portfolio of the United States, and next, we will take a look at the global energy production and consumption as well as the energy profiles of several major countries.
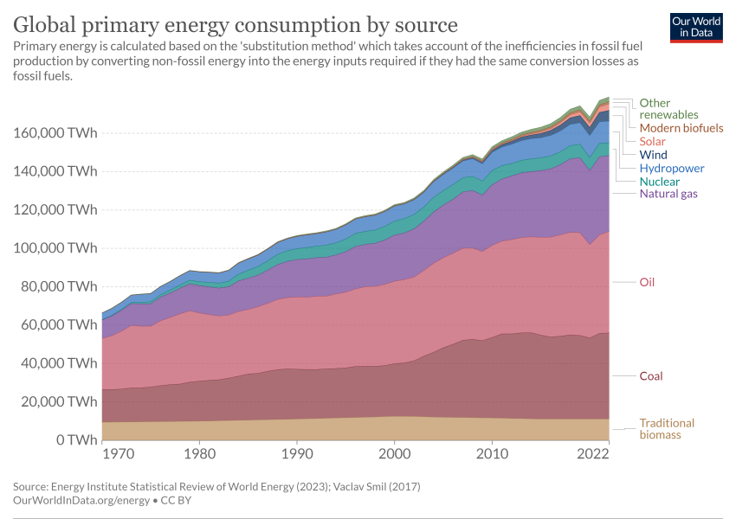
Figure 7 shows the total energy consumption of the world by sources over two centuries. Until the mid-19th century, traditional biomass, like the burning of wood, crop waste, or charcoal, was the dominant source. With the Industrial Revolution, coal replaced traditional biomass as the dominant one, and then was replaced by oil in the 1960s. Natural gas, nuclear, and hydropower were added to the mix around the same period. Solar and wind came much later in the late 1980s. A fast expansion of natural gas and renewables has been ongoing since the 21st century. Compared to the energy portfolio of the U.S., the worldwide reliance on fossil fuels is much greater, where more than 77% of energy demand is met by oil, natural gas, and coal. It is also worth noting that traditional biomass is still one of the major sources for many developing regions.
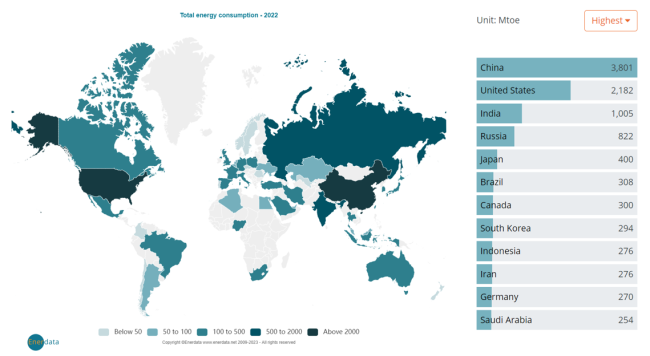
Figure 8 shows the 2021 energy consumption by country. Here we briefly introduce energy portfolios and energy import/export of several major counties/regions.
- China is the top energy consumer in the world, due to its 1.4 billion population and economic growth in recent decades. Coal is the major energy source for China, mainly for electricity generation, steel and cement manufacturing, and residential heating. It is the second-largest crude oil consumer (after the U.S.) and third in natural gas. Due to limited domestic supply, it is the top importer of both crude oil and natural gas. Renewables are developing fast in China, helping its target of reaching CO2 emissions peak before 2030 and achieving carbon neutrality by 2060.
- India is the third energy consumer, with a similar size of population as China. Coal is its largest source, but not as large as China. Traditional biomass is still contributing to a substantial but falling portion of energy, while renewables are supplying a very minor portion of energy. India is the third in crude oil consumption and import, while not in the top 10 in terms of natural gas consumption and import.
- Japan, with 126 million population, ranks fifth in energy consumption. Nuclear was one of its major sources, providing up to 13% of total consumption, but has fallen to 3% after the earthquake and tsunami near Fukushima. The share of nuclear was replaced by natural gas, oil, and renewables. Currently, petroleum is its major energy source, providing 40% of energy consumption. As an island country, Japan heavily relies on imports for its fossil fuel supply. It is the fifth in crude oil import and the second in natural gas import.
- European Union (EU) is another region that heavily depends on energy imports to meet its demand. It is worth noting that energy profiles vary across different countries. For example, renewables account for over 35% energy supply in Finland, Denmark, and Sweden while nuclear is the major source (40%) in France. Overall petroleum is the major source for the EU (34.5%) and natural gas comes after (23.7%) as of 2020. A substantial amount of energy products was imported from Russia, but now EU is exploring other sources like the U.S.
- Russia is the fourth in energy consumption, and contrary to previous energy net import countries and regions, it is the second-largest country in crude oil export (after Saudi Arabia) and the largest in natural gas export as of 2021. Russia has the largest proven natural gas reserves in the world and natural gas is also its major source of energy (51% of consumption).
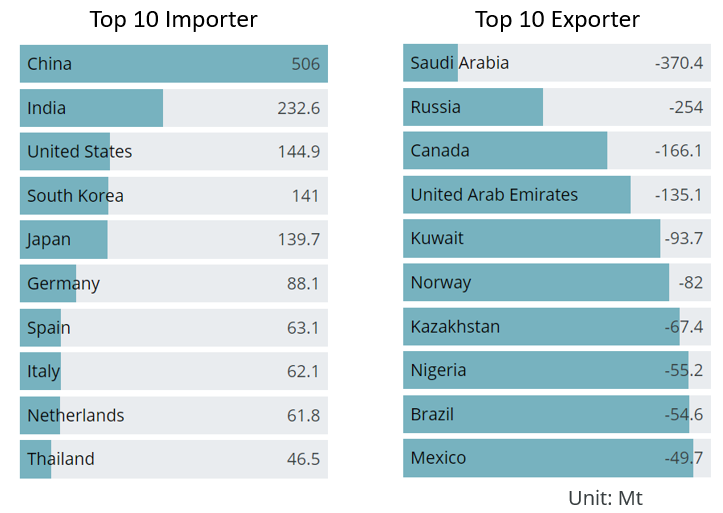
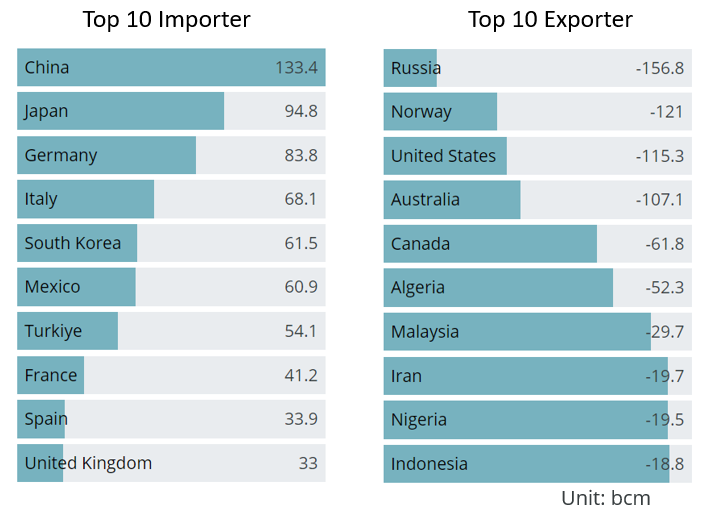
Figures 9 & 10 shows the top 10 importer and exporter countries of crude oil and natural gas. Top importers are major economies while exporters come from all over the world. As we will see in the following lessons, these countries will have significant impacts on the demand and supply in the world energy commodity market.

Top 10 crude oil importer and exporter countries
Top 10 importers: China, India, U.S., South Korea, Japan, Germany, Spain, Italy, Netherlands, Thailand. Top 10 exporters: Saudi Arabia, Russia, Canada, United Arab Emirates, Kuwait, Norway, Kazakhstan, Nigeria, Brazil, Mexico

Top 10 natural gas importer and exporter countries
Top 10 importers: China, Japan, Germany, Italy, South Korea, Mexico, Turkey, France, Spain, United Kingdom. Top 10 exporters: Russia, Norway, U.S., Australia, Canada, Algeria, Malaysia, Iran, Nigeria, Indonesia

