Lesson 1: Introduction - Overview of Solar Thermal Energy
The links below provide an outline of the material for this lesson. Be sure to carefully read through the entire lesson befor returning to Canvas to submit your assignments.
1.0 Introduction
I'd put my money on the Sun and Solar Energy, what a source of Power! I hope we don't have to wait until oil and coal run out, before we tackle that.— Thomas Edison, 1931.
I have no doubt that we will be successful in harnessing the sun's energy. If sunbeams were weapons of war, we would have had solar energy centuries ago.— George Porter, Nobel Prize winner in Chemistry, 1967.

People have been leveraging solar thermal energy for millennia. The history of the use of solar energy for heating buildings (c. 4000 BC), creating fire (c. 1000 BC), and driving industrial processes (c. 1800 AD) has been well documented by archeologists and historians [2]. The sun comes up every day (with the exception of locations that are north of the Arctic Circle or south of the Polar Circle where the sun never rises above the horizon in the depths of winter). It is our most reliable source of energy and is the source of most other forms of energy on our planet. While often characterized as intermittent, with intermittence deriving from meteorology, atmospheric physics, and diurnal and seasonal patterns, barring any catastrophic event such as a meteor impact on Earth or the expiration of the sun, the sun is always shining somewhere, will shine again everywhere, and is the primary driver behind the thermal behavior of our environment.
Lesson Objectives
At the successful completion of Lesson 1, students should be able to:
- Identify solar temporal relationships;
- Describe solar geometric relationships;
- Recall key aspects impacting available solar radiation.
What is due for Lesson 1?
This lesson will take us one week to complete. Please refer to the Course Calendar in Canvas for specific time frames and due dates. Brief directions for the lesson assignments are given in the table below, and you can find more details on respective pages of this lesson.
| Tasks | Assignment Details | Access/Directions |
|---|---|---|
| Readings |
Required:
|
Registered students can use the following link to access the online textbook [3] through the University Library. Registered students can access the supplementary reading in the Lesson 1 Module in Canvas. |
| Quiz | Take the Lesson 1 Reading Quiz. | Access the quiz in the Lesson 1 Module in Canvas |
| Assignment | 1 page essay on the scope of the course | Specific directions for the assignment are provided on the Assignment page of this lesson and in Canvas. |
| Discussion | Article review | Post your reflection in Lesson 1 DIscussion in Canvas. |
Questions?
If you have any questions, please post them to our Questions and Answers discussion forum, located under the Modules tab in Canvas. I will check that discussion forum regularly will do my best to respond. While you are on the forum, please feel free to post your own responses if you are able to help out a classmate.
1.1. Space and Time
When you are courting a nice girl an hour seems like a second. When you sit on a red-hot cinder a second seems like an hour. That's relativity."
Einstein, in the special theory of relativity, proved that different observers, in different states of motion, see different realities."
The location of the sun in the sky through time is relative to the location of the Earth with respect to the sun, the location of the observer on Earth, and the orientation of the collector at the observer’s location on Earth. The geometric relationships are defined by angles separated into three groups; 1) the relationship between the Earth and sun, as spheres, 2) the relationship between the sun and an observer (or point on the Earth), and 3) the relationship between a collector at some orientation and the sun. As the Earth rotates on its axis, the sun appears to traverse across Earth's sky. As the Earth orbits around the sun, the tilt of the axis moves the northern and southern hemispheres closer and further from the sun moving the sun's trajectory across Earth's sky higher and lower in the sky, creating seasons. The temporal and spatial relationships are inextricably linked.
1.2. Solar Geometric Angles (Space)
Recall from EME 810 the following four tables showing the Angular Symbols for Standard Solar Relations. These angles are detailed in the D&B textbook in section 1.6. These angles are all critical to the calculation of solar energy on any given surface at some orientation. To calculate the energy balance across any time scale with respect to the incident solar radiation, you must know the geometric relationships that define the spherical realities of planetary motion relative to the sun for specific tilted surfaces on the planet. Each piece is defined relative to another piece. For example, a solar panel may have a tilt, beta, but that tilt is relative to the horizontal surface on the planet, not relative to the sun. Greek symbols, often with a subscript, are used to ensure clarity through unique identifiers for each angle. Additionally, the sign convention for each angle is critical, as an incorrect sign or origin can lead to drastically incorrect results. Be careful when performing calculations to ensure that each angle and sign is correct.
| Angular Measure | Symbol | Range and Sign Convention |
|---|---|---|
| Altitude Angle | α (alpha) | 0o to + 90o; horizontal is zero |
| Azimuth Angle | γ (gamma) | 0o to + 360o; clockwise from North origin |
| Azimuth (alternate) | γ (gamma) | 0o to ±180o; zero (origin) faces the equator, East is + ive, West is - ive |
| Angular Measure | Symbol | Range and Sign Convention |
|---|---|---|
| Lattitude | ϕ (phi) | 0o to ± 90o; Northern hemisphere is +ive |
| Longitude | λ (lambda) | 0o to ± 180o; Prime Meridian is zero, West is -ive |
| Declination | δ (delta) | 0o to ± 23.45o; Northern hemisphere is +ive |
| Hour Angle | ω (omega) | 0o to ± 180o; solar noon is zero, afternoon is +ive, morning is -ive |
| Angular Measure | Symbol | Range and Sign Convention |
|---|---|---|
| Solar Altitude Angle (complement) | αs = 1 - θz (alphas is the complement of thetaz) | 0o to + 90o |
| Solar Azimuth Angle | γs (gammas) | 0o to + 360o; clockwise from North origin |
| Zenith Angle | θz (thetaz) | 0o to + 90o; vertical is zero |
| Angular Measure | Symbol | Range and Sign Convention |
|---|---|---|
| Surface Altitude Angle | α (alpha) | 0o to + 90o; horizontal is zero |
| Slope or Tilt (of collector surface) | β (beta) | 0o to + 360o; clockwise from North origin |
| Surface Azimuth Angle | γ (gamma) | 0o to ±180o; zero (origin) faces the equator, East is + ive, West is - ive |
| Angle of Incidence | θ (phi) | 0o to + 90o |
| Glancing Angle (complement) | α=1−θ (alpha) | 0o to + 90o |
1.3. Earth's Tilted Axis and the Seasons
In EME 810, you learned and applied principles regarding the Earth's rotation, the cosine projection effect of light, and some insight into the driving force behind the seasons. These principles are critical for appropriate engineering of solar thermal solutions for utilities and industry. A comprehensive understanding of the solar resource and the physics behind the intermittent and cyclical behavior of solar energy enables the engineering of solar thermal systems that adequately meet a client's needs.
Earth's Rotation
As we have seen in our reading, the Earth rotates with a roughly constant speed, so that every hour the direct beam (a ray pointing from the surface of the sun to a spot on Earth) will traverse across a single standard meridian (standard meridians are spaced $15^\circ$ apart). The implications are that the unit of one hour is equivalent to the rotation of Earth 15 degrees. When Earth rotates such that the beam of the sun shifts $+1^\circ$ of longitude from East to West: it takes 4 minutes of time.
- $1\ h = +15^\circ\ \text{Earth rotation}$
- $4\ min = +1^\circ\ \text{Earth rotation}$
Wild fact: a time zone change of one hour is really just 15 degrees of separation between standard meridians.
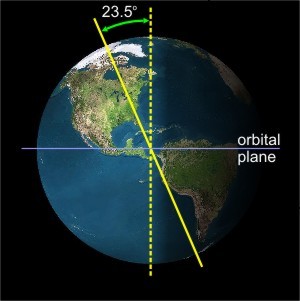
The axis of rotation of the Earth is tilted at an angle of 23.5 degrees away from vertical, perpendicular to the plane of our planet's orbit around the sun.
The tilt of the Earth's axis is important, in that it governs the warming strength of the sun's energy. The tilt of the surface of the Earth causes light to be spread across a greater area of land, called the cosine projection effect.
Cosine Projection Effect
When you tilt a surface away from a beam of light, you spread the same density of light across a larger area. Recall that irradiance is in units of $W/m^2$, so a larger denominator means a smaller value of irradiance, right?
Explore the concept of the cosine projection effect in the following experiment.
Click to expand to provide more information
Seasons and the Cosine Projection Effect
The sun is about 93 million miles away from the Earth (equivalent to ~150 million km). That is so far away that the photons from solar irradiation effectively travels in parallel rays. So, unlike the flashlight experiment, the tilt of the sun has no bearing on the intensity of the radiation reaching the Earth's surface. Instead, we find that the Earth's tilt controls the intensity of irradiation and the seasons.
Keep in mind that the Earth's axis points to the same position in space (toward the North Star, Polaris). As the Earth travels in a near spherical (a very small eccentricity into an ellipse) orbit around the sun, the northern hemisphere can be tilted toward or away from the sun, depending on its orbital position.
Click to expand to provide more information
Click on the name of each season in the nimation above to see more information and read the corresponding season descriptions below.
SPRING: (Image of the tilt of the earth in the spring) In this configuration, the earth is not tilted with respect to the sun’s rays (The earth in this picture is actually tilted towards you as indicated by the fact that you can see the North Pole – green dot). Therefore, radiation strikes similar latitudes at the same angle in both hemispheres. The result is that the radiation per unity area is the same in both hemispheres. Since this situation occurs after winter in N. Hemisphere we call it spring, while in the S. Hemisphere it is autumn. This occurs on March 21.
SUMMER: (Image of the tilt of the earth in the summer) When the N. Hemisphere is tilted towards the sun, the sun’s rays strike the earth at a steeper angle compared to a similar latitude in the S. Hemisphere. As a result, the radiation is distributed over an area which is less in the N. Hemisphere than in the S. Hemisphere (as indicated by the red line). This means that there is more radiation per unity area to be absorbed. Thus, there is summer in the N. Hemisphere and winter in the S. Hemisphere. This situation reaches a maximum on June 21.
AUTUMN: (Image of the tilt of the earth in the autumn) In this configuration the earth is not tilted with respect to the sun’s rays (The earth in this picture is actually tilted towards you as indicated by the fact that you can see the North Pole – green dot). Therefore, radiation strikes similar latitudes at the same angle in both hemispheres. The result is that the radiation per unit area is the same in both hemispheres. Since this situation occurs after summer in the N. Hemisphere we call it autumn, while in the S. Hemisphere it is spring. This occurs on September 21.
WINTER: (Image of the tilt of the earth in the winter) When the N. Hemisphere is tilted away from the sun, the sun’s rays strike the earth at a shallower angle compared to a similar latitude in the S. Hemisphere. As a result, the radiation is distributed over an area which is greater in the N. Hemisphere than in the S. Hemisphere (as indicated by the red line). This means that there is less radiation per unit area to be absorbed. Thus, there is winter in the N. Hemisphere and summer in the S. Hemisphere. This situation reaches a maximum on December 21.
Self Check
Click on "Summer" in the above animation. When the northern hemisphere tilts toward the sun, the irradiation has a lower angle of incidence, meaning more photons strike a smaller area during the daytime. Answer the following questions for yourself.
- What happens to the southern hemisphere?
- What is the correlation between concentrated sunlight and the seasons?
- What happens beyond the Arctic Circle, which spans from about 66.5 degrees latitude to the North Pole?
Now, answer the same questions for autumn, spring, and winter.

Forecasters and meteorologists use different criteria to determine the "meteorological seasons." For example, meteorological winter in PA runs from December 1 to Feb 28/29, a period that statistically includes the three coldest months of the year. This is also centered on a time about 25 days after the Winter Solstice.
Meteorological summer runs from June 1 to August 31, a period that includes the warmest three months of the year. Again, this is a period centered about 25 days from the Summer Solstice.
Please review the following NASA movie from 2000-2001, showing the rhythms of the most intense ultraviolet radiation coinciding with the most direct rays of the sun (around the summer solstices). Again, what may be a surprising observation is that the average air temperatures lag the sun's most direct days.
As one more example, review Pittsburgh's plot of annual average high temperatures. The maximum daily temperature occurs in late July, long after the summer solstice.

Self Check
You have seen these questions already in EME 810; you should be able to answer the following questions.
- What is the symbol for the day number?
- What is the declination, and what is the symbol for declination?
- What season is it in the Southern Hemisphere if the declination is a large positive number?
- How many hours of sunlight are in a day when the declination is zero?
- Does the sun always rise due East?
1.4. Solar Time
Recall from EME 810 that the time that we use in solar energy engineering is the apparent time and path of the sun relative to the aperture or collection device, called Solar Time. Because the Earth is a rotating sphere (360deg) that completes a rotation every 24 hours, 360 divided by 24 gives 15 degrees of rotation per hour, or one degree every 4 minutes. The chronological time that clocks use do not account for your geographic location beyond correcting for a time zone. Within a time zone, if you are geographically close to the next time zone, a larger time correction is necessary to convert to solar time. Additionally, the Earth does not rotate perfectly, rather, it wobbles on its axis creating what is known as an analemma. As such, an "equation of time" is necessary to convert between solar and standard time, as given in D&B equations 1.5.2 and 1.5.3.
Correcting with the Equation of Time: Accounting for Wobbles
Even in Greenwich, where no longitudinal correction is necessary, "noon" UTC will generally not be the time when the sun is directly overhead. We can see in the plot below that watch time and solar time are the same in Greenwich for only 4 days in the year.
- There are deviations of up to $\pm16$ minutes (regardless of your location on the planet).
As you will have read, our interpretation of watch time assumes an even progression for Earth's planetary rotation, with no weebles or wobbles or precession of the polar axis. However, you will now know that wobbling occurs, and there is great variability in the rotation of the Earth throughout the months of the year. This is why we add leap years and leap seconds to our calendars. So we create a "mean time" based on the length of an average day to keep things simple. Solar time has to correct for this mean time approximation.

For views of amazing solar analemma photography by Anthony Ayiomamitis, please visit his solar image gallery [7]. The gallery has a series of composite of images, taken at the same watch time every few days for an entire year to record the position of the sun. We call the shape an analemma. An analemma is a beautiful way to capture both the range of declination $\delta$ (along the length of the analemma) and the Equation of Time Et (the expansion or width of the analemma) in a graphical format. Notice how there is a big loop and a little loop, and compare the same big waves and little waves in the first image of the Equation of Time correction above. If you were to draw a line down the center, you would have removed the error from watch time, and you would be one step closer to solar time.

Correcting for Little Longitude Changes: Inside Time Zones
Recall from EME 810 that there is a correction for longitude based on where you are within your timezone. Where you live, or where your future solar site assessment will occur, will likely be well within the edge of a time zone (meaning $\lambda_{std} - \lambda_{loc} \neq 0^\circ$). We already learned that every $1^\circ$ of angular rotation on Earth is equal to 4 minutes of time. Standing in one spot on the surface, this means 4 minutes of relative time correction locally per degree of deviation from a Standard Meridian ($\lambda_{std}$). So locales will have a local longitudinal refinement to account for, in order to account for not living directly on a 15 degree incremental Standard Meridian on Earth.
Standard Meridians define the beginning of a time zone, and not the end of a time zone. So you are always going to look to the start of a time zone to find the Standard Meridian.
There are a few other cities that actually are well seated for solar time zone correction (close enough for our calculations):
- Philadelphia is fairly close to the EST standard meridian of $-75^\circ$.
- Denver is fairly close to the MST standard meridian of $-105^\circ$.
My client lives someplace other than a Standard Meridian, how do I account for that?
First, go to Google and type "<insert city name> longitude". You should get a quick response of both the Longitude ($lambda$) and the latitude (our symbol for latitude is lowercase Greek "phi": $phi$), represented in decimal form (more useful to us for trigonometry and angles). Do this now for your current location, and note (self check) how many degrees away you are from your standard meridian (multiple of $15^\circ$).
Have you noticed that real time zones are more often political boundaries that zigzag around, rather than following an actual Standard Meridian? So, actually, there can be locales for clients that are East of their own time zone Standard Meridian, instead of the normal relative locations West of the time zone Standard Meridian. This is why, in the reading, you will see $\pm4$ minutes per degree of local longitudinal shift away from the time zone's Standard Meridian.
Self Check
Work through Example 1.5.1 (page 11) in the D&B text by hand with a paper and pen(cil).
1.5. Extraterrestrial Radiation and the Atmosphere
Extraterrestrial Variation
In addition to the geometric (space) and chronologic (time) relationships between collector surfaces on Earth and the sun, the intensity of the sun's irradiation changes based on the distance between the Earth and the sun because of the eliptical orbit of the Earth. While the average solar radiation flux is 1361 W/m2, the annual fluctuation due to the Earth's eliptical orbit is greater than $\pm40$W/m2, resulting in peak extraterrestrial radiation flux of about 1410 W/m2 in January and lows of about 1320 W/m2 in June. The following equations can be found in the D&B text section 1.4.
Gon = Gsc (1 + 0.033 cos(360n/365))
OR
Gon = Gsc (1.000110 + 0.034221 cos B + 0.001280 sin B +0.000719 cos 2B + 0.000077 sin 2B)
where Gon is the extraterrestrial radiation incident on the plane normal to the radiation on the nth day of the year and B is given by
B = (n − 1) *360/365
Atmosphere
The Earth's atmosphere is the source of the greatest uncertainty in predicting solar radiation incident on a solar collector. Particulates, aerosols, clouds, moisture, etc. are the drivers behind the intermittency of incident solar energy due to atmospheric attenuation. Some meteorologists and atmospheric scientists have spent their entire careers focused on the problem of modeling the atmosphere to develop predictive tools for increased accuracy in energy models. The application of such atmospheric modeling tools is enabled with an accurate level of solar radiation known outside of the Earth's atmosphere (extraterrestrial).
1.6. Why Solar Thermal?
Facts about Solar Thermal Energy
- Solar thermal energy has been used in various ways for millennia, ranging from simple fire starting with a pocket mirror to solar architecture to capture heat in buildings.
- 48% of the the sun's energy is in the infrared spectrum, invisible to the human eye, as heat.
- Solar thermal collectors can employ (absorb) nearly the entire solar spectrum
- The sun is the most abundant and reliable source of energy
- Financially, solar thermal energy conversion systems have reached grid-parity in many locations
Currently, we (humans) use an abundance of fossil fuels for much of our heat needs. While in the long run our society will switch to the source of all of those fossil fuels (the sun), the reality is that most of you have probably not experienced the direct impact of a solar thermal energy conversion system on your life. The truth is that we can do everything that we currently do in our society with solar energy. Much of the burden can be carried by solar thermal solutions. One terrific modern day example of a solar thermal energy system is the Drake Landing Solar Community in Alberta, Canada, where 95% of the the community's heating needs are supplied by on-site solar thermal collection and a connected seasonal thermal energy storage system. Our society uses a lot of heat. We need to keep working to make solar thermal energy solutions make sense and work well in more places whenever possible.
1.7 Assignment
While solar thermal energy has been studied and leveraged for millennia, the technical difficulty and subsequent costs of appropriately meeting an energy need have hindered the wide adoption of solar thermal energy conversion systems, instead opting for other technologies and fuel sources. In light of your background and professional aspirations, write an essay that identifies your relationship with the course material. The essays will serve two purposes: (1) sharing your perspective with the class and (2) second, thinking critically about the relevance of the course subject matter to your educational and career goals.
Deliverable - Lesson 1 Assignment
Submit your essay as a one page pdf file to the Lesson 1 Assignment dropbox in Canvas by 11:55 p.m. (your local time) on Wednesday. Format suggestions: the essay should fit on one page, size 12, "Times New Roman" or equivalent font, with one inch margins on all sides. Please see the Calendar in Canvas for specific due dates.
1.8 Discussion
Solar thermal energy conversion systems at the utility scale have been developed for over a century using basic thermal principles, concentration systems, and mechanical engineering practices for heat and power. The article referenced below discusses some aspects for and some against the recent progress at the Ivanpah solar thermal electricity generation plant in the Mojave Desert, California, USA. While we are not seeing a mass conversion of our electricity generation infrastructure to solar thermal generation yet, the industry is experiencing significant growth.
Required Reading
Read the Ivanpah-NYTimes-Feb2014.pdf article. Registered students can access the article located in the Lesson 1 Module in Canvas.
Deliverable - Lesson 1 Discussion
Summarize the author’s perspective(s) and provide any comments, corrections, or insights into the content of the article in your post. Please include references to support your assertions. Suggested length: 200-300 words. Next, provide a comment/response to two other posts.
Initial post to the Lesson 1 Discussion is due by Sunday night (11:55 p.m. your local time), and replies to others are due by Wednesday night (11:55 p.m. your local time).
Please see the Calendar in Canvas for specific due dates.
1.9 Summary and Final Tasks
Summary
This week, we’ve looked back at what we learned in EME 810 and refreshed our memories. We have taken this information and laid a foundation for applying our knowledge to the field of solar thermal energy for utilities and industry. Finally, we have introduced ourselves to each other and thought about what impact solar thermal energy has on each of us.
Quiz
Be sure to take the Lesson 1 Reading Quiz by Wednesday night.
(Please see the Calendar in Canvas for specific due dates.)
Reminder - Complete all of the Lesson 1 tasks!
You have reached the end of Lesson 1! Please double-check the to-do list on the Lesson 1 Introduction page [8] to make sure you have completed all of the activities listed there before you begin Lesson 2.