Join Dr. Alley and his team as they take you on "virtual tours" of National Parks and other locations that illustrate some of the key ideas and concepts being covered in Unit 12.
Virtual Field Trip #1: The Arctic National Wildlife Refuge (ANWR): Where Caribou Meet Oil Conduits

Source. USGS, http://geology.usgs.gov


Source. Right: U.S. Fish and Wildlife Service, Arctic National Wildlife Refuge. Left: hosted on website of Vermont Senator Patrick Leahy.

Source. NASA, http://www.nasa.gov/vision/earth/environment/frozen_north.html

Source. USGS http://geology.usgs.gov

Source. Left: eia, U.S. Energy Information Administration. Right: U.S. Immigration and Customs Enforcement, https://www.ice.gov/doclib/news/library/reports/cornerstone/cornerstone2...

The map shows that only certain areas produce coal, with no coal from most of the country. Lignite is especially common in the west and south, bituminous in the west and Appalachians, and a little anthracite in the parts of the Appalachians that were heated most strongly during mountain building, in Pennsylvania, West Virginia and Virginia, and also Arkansas and Oklahoma.
Source. USGS

Source. USGS Circular 1143, Coal – A Complex Natural Resource, above by J.C. Willett, right R.W. Stanton, Upper right P.D. Warwick

Source, USGS Circular 1143, Coal – A Complex Natural Resource, upper left by S. G. Neuzil, lower left by C.B. Cecil, right by P.D. Warwick

Source. Left. US Bureau of Reclamation, photograph from Colorado, 1914, Right four images. From Warwick, Peter D., in preparation, Geologic Assessment of Coal in the Gulf Coastal Plain: U.S. Geologic Survey Professional Paper 1625E, DC-ROM.
Image 1: The builders of the Alska pipeline (upper left) for carrying oil had to worry about impacts on critters including caribou, and about geological issues such as earthqakes (the bend in the pipeline shown is part of the engineering to allow the pipeline to shake but not break in a quake.
Image 2: Oil and gas aren’t quite as photogenic as mountains or canyons. Here are a few pictures from ANWR, and some shots showing oil wells, coal mines, and the occurrence of oil, gas, and coal in the U.S. You might want to know that, with heating, plants turn into peat and then into lignite and into bituminous or into anthracite, and that western PA has bituminous and eastern PA has anthracite, and that making oil too hot produces natural gas so western PA has oil, but eastern PA doesn’t.
Image 3: he Arctic National Wildlife Refuge (above) and its caribou (right). Source. Right: U.S. Fish and Wildlife Service, Arctic National Wildlife Refuge. Left: hosted on website of Vermont Senator Patrick Leahy.
Image 4: Satellite image showing ANWR. To the north (top of picture) sea ice floats in the Beaufort Sea. Below, rivers drain from snow-covered mountains. Source. NASA, http://www.nasa.gov/vision/earth/environment/frozen_north.html
Image 5: Slightly fuzzy USGS map of oil (green), gas (red), and a lot of dry holes (gray) for the U.S. Alaska is reduced to fit; ANWR is at the far north (top) of Alaska. The map shows that oil and gas are produced in only certain areas, with much of the country not having any resource, and that oil companies have drilled many, many holes that did not produce commercially useful quantities of oil or gas. Source. USGS http://geology.usgs.gov
Image 6: (left) Historical photo of the world’s first oil well, Drake Well Museum, Titusville, PA. (right) Modern Pennsylvania oil well. This happens to be a well that was seized by Immigration and Customs Enforcement (ICE) of the U.S. Government as part of investigation of drug crimes. Source. Left: eia, U.S. Energy Information Administration. Right: U.S. Immigration and Customs Enforcement, https://www.ice.gov/doclib/news/library/reports/cornerstone/cornerstone2...
Image 7: USGS map of coal resources in the contiguous U.S. The numbers and blue lines refer to different coal regions used in USGS studies. 1-3 on the far right are anthracite, 4-8 and 12-23 (shown in green and blue) are bituminous (of various grades; greener colors are closer to lignite, and the red bits in 4 and 7 are close to anthracite), and regions 9-11shown in yellow and orange are lignite. The map shows that only certain areas produce coal, with no coal from most of the country. Lignite is especially common in the west and south, bituminous in the west and Appalachians, and a little anthracite in the parts of the Appalachians that were heated most strongly during mountain building, in Pennsylvania, West Virginia and Virginia, and also Arkansas and Oklahoma. Source. USGS
Image 8: Left: coal-fired Navajo power plant near Page, AZ. Upper right: Mining lignite-to-bituminous coal, WY. Lower right: Scientific sampling of Lower Freeport Coal, Indiana County, PA. Source. USGS Circular 1143, Coal – A Complex Natural Resource, above by J.C. Willett, right R.W. Stanton, Upper right P.D. Warwick
Image 9: Slightly-low-resolution photos of peat from Indonesia (upper left), lignite from Texas (upper right; the darker beds are coal, and the lighter beds are volcanic ash) and bituminous from West Virginia (bottom left; bituminous usually is blacker, but it has been weathered here). Source, USGS Circular 1143, Coal – A Complex Natural Resource, upper left by S. G. Neuzil, lower left by C.B. Cecil, right by P.D. Warwick
Image 10: Draglines (left and top center) are huge motorized shovels that are often used to remove unwanted rock above coal in surface (“strip”) mines, such as the Gulf Coast lignite mine shown in the right-hand four pictures, where volcanic-ash interbeds separate the coal beds, with a fossil palm leaf (upper right). Source. Left. US Bureau of Reclamation, photograph from Colorado, 1914, Right four images. From Warwick, Peter D., in preparation, Geologic Assessment of Coal in the Gulf Coastal Plain: U.S. Geologic Survey Professional Paper 1625E, DC-ROM.
Virtual Field Trip #2: Charismatic Macro Fauna


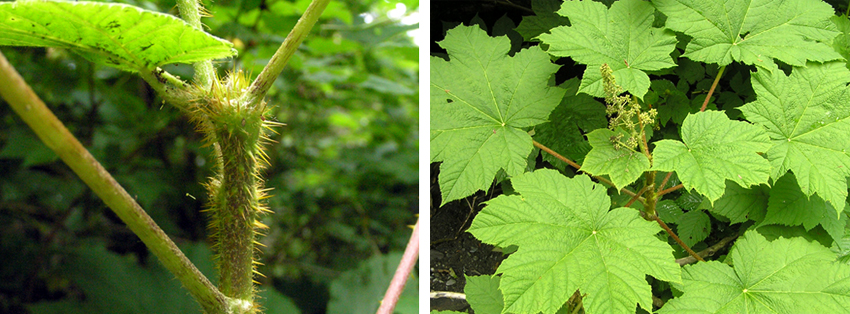


Image 1: Charismatic macrofauna--big attractive animals--are one of the major attractions at national parks. In much of the world, competition for resources between large animals and humans is greatly endangering the animals; however, big animals in the U.S. and Canada, such as this bighorn sheep in the Canadian Rockies, are actually doing quite well. This slide show is mostly for fun, but the point--that humans endanger the biodiversity from which we benefit--is important. All photos by R., C., J. or K. Alley.
Image 2: A century ago, deer were largely eliminated from Pennsylvania and most of the eastern U.S., while mountain lions and some other large animals were completely eliminated, so we might be careful before feeling smug about more-recent successes. This is a mule deer in Banff National Park, Alberta, Canada.
Image 3: The eastern subspecies of elk is extinct. Elk from Yellowstone and elsewhere were transplanted to Pennsylvania and other eastern localities in this century. This elk is in Banff National Park, Alberta, Canada.
Image 4: Another view of a big Banff bull elk.
Image 5: Moose, Captain Cook State Recreation Area, Alaska
Image 6: Moose in town, Anchorage, Alaska. Humans and wildlife are interacting more and more, because we keep moving into their habitat.
Image 7: Elk at Yellowstone National Park rest on the upper surface of Mammoth Hot Springs. The open setting discourages the bugs that torment the elk.
Image 8: Caribou, south Greenland, doing the same thing as the elk in the previous picture--dodging bugs.
Image 9: Pronghorn, Petrified Forest National Park.
Image 10: Not quite so large… a golden-mantled ground squirrel, Yoho National Park, Canada.
Image 11: Bald eagle, Sitka, Alaska
Image 12: Harlequin duck (left), tufted puffin (right), Seward, Alaska.
Image 13: Metalmark butterfly, Paintbrush Trail, Manning Provincial Park, British Columbia, Canada
Image 14: Blueberry (upper left), yellow salmonberry (lower left), red salmonberry (upper right), and bunchberry flower (lower right), Sitka, AK
Image 15: Devil’s club (Oplopanax horridus), Sitka, Alaska. Many plants have external defenses, but almost all have internal defenses, chemicals to help keep them from being eaten. The native peoples of the Alaskan coast have long used devil’s club as a medicine--what works for the plant also works for humans. Many of our medicines have come from plants, and many more will.
Image 16: Wax flower (left), skunk cabbage (middle), and club moss (right), Sitka, Alaska. Biodiversity really is beautiful.
Image 17: Steller sea lions (left) and See otter (right), Seldovia, Alaska
Virtual Field Trip #3: Global Warming


Image 1: This slide show summarizes the scientific consensus on human-caused climate change, as embodied in the United Nations-sponsored Intergovernmental Panel on Climate Change 2001 Report (www.ipc.ch), the source of the figures shown (annotations added for this class). The skinny version is, whith high confidence: 1.We are changing atmosphere, especially by burning fossil fuels; 2. That is changing the climate, primarily by warming; 3. The changes so far have been tiny compared to the changes that will come if we follow business as usual; 4. Changes will cuase winners and losers, with losers far outnumbering winners if warming is large; 5. Sea-label rise, summer grian-belt drying, and stronger storms are among the alrge impacts expected.
Image 2: The following are some additional points on Global Warming. In the past, environmental problems invariably generated much noise and denial and claims of huge costs to clean up, until people invented better ways, after which we solved the problems, people made money, and the cleanups became part of the economy. Plausible estimates say completely cleaning up CO2 today would be very expensive, but could be done ater a few decades of serious research and development for something like 1% of the economy. That is in line with costs of other cleanups (sewers, janitors, garbage trucks, atalytic converters...), and, it is a lot of money. Slowing down emissions a bit now might buy time to avoid problems until the new technolgies are in place. We will switch energy sources (fossil fuels are finite), will we switch before or after changing the world, and , who will get rich?
Image 3: http://www.ipcc.ch (link is external) UN IPCC The rise in the greenhouse gases carbon dioxide, methane, and nitrous oxide over last millennium, and rise and fall in acid-rain sulfate over last 600 years, from ice-core data (sulfate and dots on gas graphs) and instrumental records (lines for gases). Changes are clearly human-caused.
Image 4: Instrumental record (from thermometers) of global average temperature from 1860-2000. Corrections have been made for the heating effect of cities, so this shows real warming. Instrumental record (red) and proxy-data record (tree-rings, etc., blue with uncertainty in gray) of global average temperature over last 1000 years. Details of proxy interpretation are still debated, but other approaches give similar results.
Image 5: (www.ipcc.ch)UN IPCC Each panel shows measured global-average temperature 1860-2000 (red line) and a model reconstruction with uncertainty (gray band). Natural causes (more sun, fewer volcanoes) started warming (upper left) but switched to cooling; human causes (greenhouse gases, plus acid rain blocking sun) cooled in 1950s, now warming strongly (upper right and bottom).
Image 6: How much more fossil fuel is there? We’re sure of reserves; we think we have resources, and unconventional reserves. Resources include oil shale, tar sands and such. Most of the fossil fuels have not been burned yet, but we’re burning them much faster now than we have in the past.
Image 7: Past changes in CO2 levels are small compared to the change that is coming. CO2 is still likely to be going up in 2100, and the world doesn’t end then (you may live past 2100…).
Image 8: Past temperature change is small compared to the expected change for all scenarios and climate models tested. Change so far has been small enough that only those really paying attention have noticed; future change is expected to be much greater. All projections show temperatures rising beyond the year 2100, which is not the end of time.
Image 9: Projected warming in the greenhouse future, compared to changes over the last millennium. Again, all the projection curves are rising as they cross the year 2100, and the world does not end in 2100.
Image 10: Warming of mean-annual temperature by the year 2100, in degrees Celsius. (To get Fahrenheit, multiply by 1.8; the largest warmings in the Arctic are almost 10oC or 18oF.) Scenario A2 is one in which the economy does pretty well, and we don’t try very hard to clean up, giving warming toward the upper end of the scenarios tested by the UN IPCC.
Image 11: Experts were asked how much warming would worry them about various things. White means few were worried, and red means most were worried. Even a little warming endangers rare species (category I)--they need to move as climate changes, but humans in the way may block migration. Much warming is required before most experts are worried about ice-sheet or thermohaline-circulation collapse (category V), but beyond 2100, such warming becomes increasingly likely unless actions are taken. How the economy grows, and how we try to clean up, determine how hot it gets, as shown on the right for the year 2100--burn-it-all makes enough warming to be worried about most things by then; slow-down-some leaves a little safety zone. UN IPCC.
Image 12: (left) Projected sea-level rise for a range of human-behavior scenarios and from a range of models, to the year 2100. Rise over the last few years seems to have been faster than any of these projections. Projected change is from warming-caused ocean-water expansion and melting of mountain glaciers. (right) Number of people likely to be flooded by coastal storm surges (blue bars) after a 40-cm (16-inch) sea-level rise (the yellow dotted line on the left) (includes population growth to the year 2080), versus without sea-level rise (green), assuming either modern sea-walls, etc., or efforts to build more sea-walls, etc. Loss of the Greenland ice sheet would raise sea level over 7 m or 23 feet, and Antarctica almost ten times more than that. UN IPCC
Want to see more?
Join Dr. Alley in this optional video (no, it won’t be on the quiz) to learn about formation of Fossil Fuels, in Barataria Reserve, Jean Lafitte National Historical Park and Preserve, Louisiana, from the PBS television special Earth: The Operators’ Manual.