Earth’s climate systems are characterized by thresholds, levels that once crossed herald a new climate state. For example, we often talk about the 1.5 or 2oC thresholds across which the impacts of climate change become dangerous, for example including long heatwaves, devastating droughts and more common extreme weather events. Thresholds can become tipping points if, once crossed, there is no going back from the new climate state, at least temporarily. One of the best examples of a tipping point is the cessation in Atlantic meridional overturning circulation (AMOC) which we will learn about in Module 6 and which is a key driver of heat transport around the globe. This circulation drives the formation of ocean deep waters which in return feeds the Gulf Stream which warms northern latitudes including Western Europe making them more habitable. It also fuels monsoon rains in places like India. In the past, AMOC has turned off, driving Northern Europe into an ice age. The system is highly complex and difficult to predict, but there have been warning signs that it has been edging closer to that potentially devastating tipping point in recent decades. The system becomes more variable as a tipping point is reached, and that variability is currently showing signs of increasing. Tipping points may involve positive feedbacks. For example, melting and disintegration of the West Antarctic Ice sheet will lower planetary albedo resulting in further melting, and at some stage the feedback will make the system irreversible, at least temporarily. Another example is the melting of permafrost in the Arctic region. Tipping points can lead to cascading changes if they impact one another, for example, significant melting of Antarctic ice can cause enough warming to exacerbate permafrost melting. More examples of tipping points are showing in the figure below.
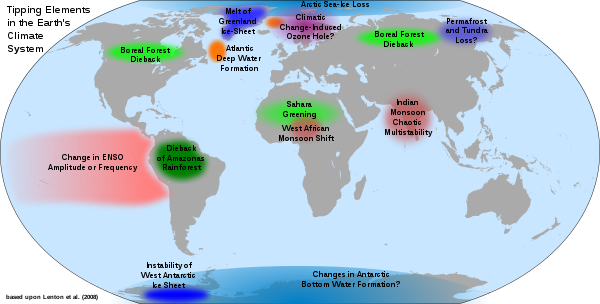
Possible tipping elements in the climate system
Click for a text description of the Tipping Elements map.
The image is a world map highlighting various regions with potential climate tipping points, where small changes in climate conditions could lead to significant, often irreversible shifts in the Earth system. The map uses color-coded regions and labels to indicate specific tipping elements and their potential impacts.
- Map Overview:
- The map is a global projection centered on the Atlantic Ocean, showing continents in gray with specific regions highlighted in colors (red, green, blue, orange) to indicate climate tipping points.
- Labels are placed over the highlighted regions to describe the tipping elements and their potential changes.
- Highlighted Regions and Tipping Points:
- Arctic and Northern Regions:
- Melt of Greenland Ice-Sheet: Highlighted in orange over Greenland, indicating potential ice loss due to warming.
- Climatic Change-Induced Ozone Hole?: Highlighted in orange over the Arctic, suggesting possible changes in atmospheric chemistry.
- Boreal Forest Dieback: Highlighted in green over northern North America (Canada and Alaska) and northern Eurasia (Siberia), indicating potential forest loss due to climate stress.
- Permafrost and Tundra Loss?: Highlighted in blue over northern Siberia, suggesting potential thawing of permafrost and loss of tundra ecosystems.
- Atlantic Ocean:
- Atlantic Deep Water Formation: Highlighted in orange in the North Atlantic, indicating potential disruption of ocean circulation patterns like the Atlantic Meridional Overturning Circulation (AMOC).
- South America:
- Dieback of Amazonas Rainforest: Highlighted in green over the Amazon Basin, indicating potential forest loss due to drying and deforestation.
- Africa:
- Sahel Greening: Highlighted in green over the Sahel region (south of the Sahara Desert), suggesting potential vegetation growth due to changing rainfall patterns.
- West African Monsoon Shift: Highlighted in green over West Africa, indicating potential changes in monsoon patterns.
- Indian Subcontinent:
- Indian Monsoon Chaotic Multistability: Highlighted in red over India, suggesting potential unpredictable shifts in monsoon behavior.
- Antarctica:
- Instability of West Antarctic Ice Sheet: Highlighted in blue over West Antarctica, indicating potential ice sheet collapse and sea level rise.
- Changes in Antarctic Bottom Water Formation?: Highlighted in blue around Antarctica, suggesting potential disruption of deep ocean water formation.
- Global Ocean:
- Change in ENSO Amplitude or Frequency: Highlighted in red over the equatorial Pacific Ocean, indicating potential changes in the El Niño-Southern Oscillation (ENSO) patterns.
- Color Coding:
- Red: Used for regions with potential changes in ENSO and the Indian Monsoon, indicating high-impact, dynamic shifts.
- Green: Used for regions like the Amazon, Sahel, West Africa, and boreal forests, indicating potential ecosystem changes (dieback or greening).
- Blue: Used for polar regions (Siberia, Antarctica), indicating ice and permafrost-related tipping points.
- Orange: Used for the Arctic, Greenland, and North Atlantic, indicating ice melt and ocean circulation changes.
- Visual Elements:
- The map uses a gray background for continents not highlighted, with colored overlays for the tipping point regions.
- Labels are written in black, with question marks in some cases (e.g., "Climatic Change-Induced Ozone Hole?" and "Permafrost and Tundra Loss?") indicating uncertainty or ongoing research.
The map effectively illustrates the global distribution of climate tipping points, highlighting regions where the climate system may undergo significant and potentially irreversible changes due to global warming and other climate stressors.
Tipping points represent one of the most dire threats of climate change due to their irreversible nature. Because of this, they are very much a key driver of the warming thresholds and emissions targets.
