Global Use of Hydroelectricity
Globally, hydroelectricity is a major electricity resource, accounting for more than 16% of all electricity produced on the planet. More electricity is produced globally using hydropower than from plants fueled by nuclear fission or petroleum (natural gas and coal do produce more electricity globally than hydropower does). More than 150 countries produce some hydroelectricity, although around 50% of all hydropower is produced by just four countries: China, Brazil, Canada, and the United States. China is by far the largest hydropower producer on the planet, as shown in the figure below. Hydroelectricity production in China has tripled over the past decade, with the completion of some of the world’s largest dam projects, in particular, the Three Gorges Dam (the world’s largest), which could produce nearly enough electricity to power all of New England during a typical summer and left an area roughly the size of San Francisco flooded underwater.
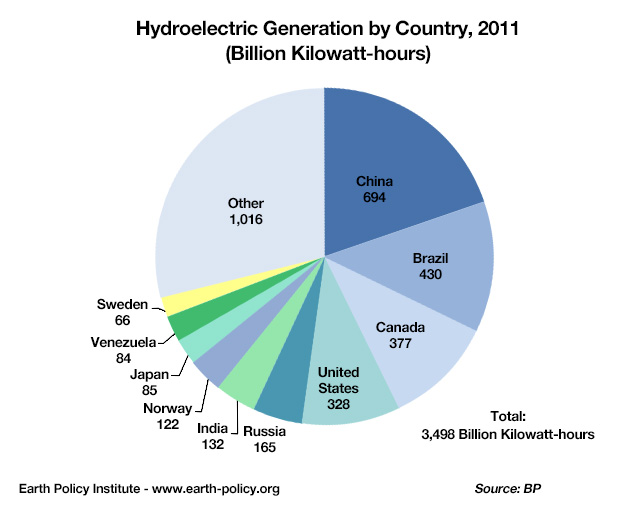
Global hydroelectric power generation in 2011
Click the link to expand for a text description of the Hydroelectric Generation by Country, 2011 Pie Chart
The image is a pie chart titled "Hydroelectric Generation by Country, 2011 (Billion Kilowatt-hours)," which shows the distribution of hydroelectric power generation across different countries for the year 2011. The total hydroelectric generation is 3,496 billion kilowatt-hours.
- China is the largest contributor, represented by the biggest slice of the pie chart, generating 694 billion kilowatt-hours.
- Brazil follows, with a slice showing 430 billion kilowatt-hours.
- Canada is next, depicted with a slice for 377 billion kilowatt-hours.
- United States has a slice for 328 billion kilowatt-hours.
- Russia is shown with 165 billion kilowatt-hours.
- India has a slice for 132 billion kilowatt-hours.
- Norway is represented with 122 billion kilowatt-hours.
- Japan has a smaller slice for 85 billion kilowatt-hours.
- Venezuela is shown with 64 billion kilowatt-hours.
- Sweden has the smallest individual country slice, with 66 billion kilowatt-hours.
There is also a large section labeled Other, which collectively represents 1,016 billion kilowatt-hours from countries not individually listed.
Each country's contribution is color-coded in the pie chart for visual distinction, with labels indicating the amount in billion kilowatt-hours. The source of the data is BP, and it is provided by the Earth Policy Institute. The total generation figure is prominently displayed at the bottom right of the chart.
Data source is BP Statistical Review of World Energy. Image is from Earth Policy Institute.
Once hydroelectric dams are built, they run very cheaply and generally provide reliable supplies of electricity except during times of extreme drought. Developed countries that have substantial hydro resources have, by and large, already utilized those resources to produce electricity. In these countries, hydropower dominates the electricity supply system as shown in the chart below. Norway leads the pack here – the amount of hydropower that it produces is not large in an absolute sense (it is the world’s seventh-largest producer) but nearly all electricity generated in Norway comes from hydro-power. Brazil and Canada are also highly dependent on hydropower. Other large hydro producers, such as China and the United States, produce much less hydroelectricity relative to the size of their overall power sectors.
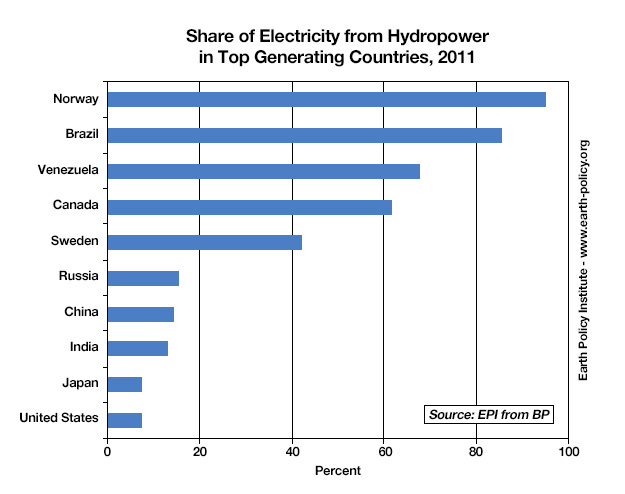
Share of hydro-power among the top ten hydro-producing countries
Click link to expand for a text description of Hydro-power graph
The image is a horizontal bar chart titled "Share of Electricity from Hydropower in Top Generating Countries, 2011." It displays the percentage of electricity generated from hydropower in various countries for the year 2011. The data source is the Earth Policy Institute (EPI) from BP.
- Norway has the highest share, with a bar extending to nearly 100%, indicating almost all of its electricity comes from hydropower.
- Brazil follows, with a bar reaching approximately 80%.
- Venezuela is next, with a share around 70%.
- Canada has a bar showing about 60%.
- Sweden shows a share of roughly 50%.
- Russia has a bar extending to about 20%.
- China is depicted with a bar at around 15%.
- India has a share of about 12%.
- Japan shows a bar at approximately 8%.
- United States has the lowest share among the listed countries, with a bar extending to about 7%.
Each country is listed on the y-axis, with corresponding bars extending horizontally to the right to represent the percentage on the x-axis, which ranges from 0 to 100%. The bars are colored in blue for visual distinction. The source of the data is noted at the bottom right of the chart.
Data source is BP Statistical Review of World Energy. Image is from Earth Policy Institute.
