Safety
Yet another dimension along which energy sources differ is safety, both to workers and to the general population. Data on safety in the energy industry, particularly outside of the U.S. and Europe, is very hard to come by but what data does exist globally is presented in the graph below.
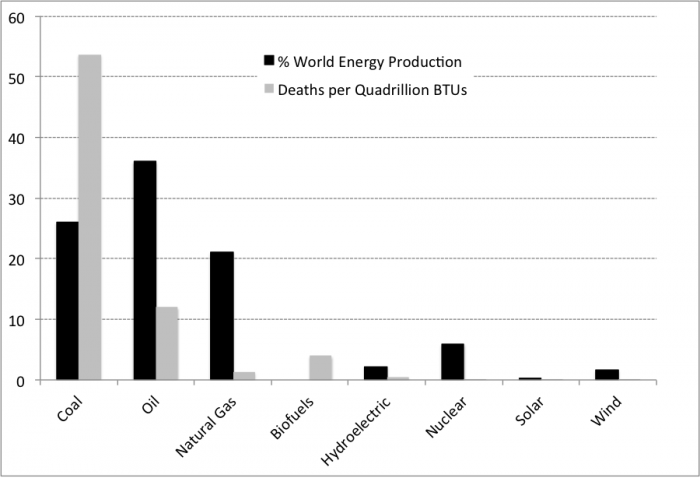
Figure 11.8: Comparative Global Production and Death Rate for Major Energy
Sources. Data from the OECD World Health Outlook and Paul Scherer Institute
Perhaps unsurprisingly, the graph shows that coal and oil that exhibit the highest death rates for all energy sources for which data was available (coal, oil, natural gas, biofuels, hydroelectric, nuclear, solar and wind). On a per-Btu basis, some of the safest energy sources have historically been wind and solar (in part because they represent a very small share of global energy production), natural gas and perhaps surprisingly nuclear.