
Reading Assignment
For this section, please read Chapter 11: "Price Searcher Markets with High Entry Barriers."
Our first assumption is that of market power, which states that everybody is a price taker, or that there are many buyers and sellers in a market. In this case, the equilibrium price in a market is defined by so many different transactions that anybody who wishes to buy or sell in this market has to do so at the market equilibrium price, and they are not able to move the equilibrium price with their own actions. Hence, you have to "take" whatever the price is. If you are able to move the equilibrium price with your own choices, then you can be referred to as a "price-setter." In reality, in many situations, somebody in the market has some power to change prices through their individual actions. These include:
- Monopoly: only 1 seller.
- Duopoly: 2 sellers.
- Oligopoly: a few sellers.
- Monopsony: only 1 buyer.
Monopoly
This is the most extreme, but not the most common, example of market power. A monopoly is a market with only one seller. A monopolist is free to set prices or production quantities, but not both because he faces a downward-sloping demand curve. He cannot have a high price and a high quantity of sales – if he has a high price, people will buy less.
There are three ways that a monopoly can exist and/or persist:
- All of some resource is owned by some firm (e.g., deBeers and diamonds).
- The government allows a monopoly to exist (not common in the US, but in many countries things like airlines or railways are government-designated monopolies).
- A Natural Monopoly exists (e.g., your local power company). We will talk more about natural monopolies a bit later in the course.
At this point, you might think about some markets that have a dominant market share held by a single firm, such as Microsoft in the market for spreadsheet software. These are not monopolies, in that firms in these markets do have competitors, and consumers do have choices. If a firm obtains an inordinate market share due to offering a product that many people want to buy, we do not have a monopoly. Firms in a case such as this may have a lot of market power, and may face a lot of scrutiny from the government, but they are not technically monopolies.
Why is a monopoly bad?
Monopolies are typically assumed to be undesirable market structures. They are undesirable, or "bad," because in this case "bad” means less than the most possible total wealth – the sum of the producer and consumer surpluses. A market in which there is a monopoly will generate less wealth for a society than a competitive market would.
A monopoly leads to the following:
- A lower quantity of goods produced and consumed than in a competitive market.
- A higher price than the equilibrium price in a competitive market.
- A higher profit for the firm. In a monopoly, a firm will typically make greater than zero economic profit (remember that term?).
In a competitive market, it is the act of competition that drives prices towards the equilibrium price and quantity at which the marginal firm makes zero economic profits - they are earning just enough money to cover their costs of production and to pay their owners a return that is sufficient to cover their risks. If firms in an industry are making positive economic profits, then other firms have an incentive to enter the market to try and deliver these positive profits to their owners. Generally, this extra market entry is enough to increase production and decrease equilibrium price to the point where zero economic profits are seen. In a monopoly, these competitive pressures are absent. A firm is able to earn positive economic profits, and because they are a monopoly, other firms are unable to enter their market and drive down price.
This leads to an increase in the size of the producer surplus and a decrease in the size of the consumer surplus. As a disinterested economist, we might say "who cares?" especially if we are generating wealth. That is, should we care who gets the wealth, as long as wealth is being generated? That would be a "normative" statement. However, since we are concerned with maximizing the aggregate wealth of a society, we can ask the positive question "does a monopoly decrease total wealth generated?" If it does, then we have the definition of a market failure.
It is quite easy to answer this question with a supply and demand diagram. But first, consider how a monopoly works. We may have a single seller, and this seller may be able to choose his price, but he cannot control the demand curve. Remember, the demand curve is defined by the marginal utility of consumption, a measure of how much happiness the consumers get from consuming. So, the monopolist faces a demand curve he or she cannot change. So what a monopolist can do is choose just where the supply curve intersects the demand curve. He can choose any combination of price or quantity that exists along the demand curve. If he picks a high quantity, then he chooses a low price, or vice-versa. He cannot have a high price and high quantity. When I say "high" here, I am speaking in relationship to the competitive market equilibrium.
So, a monopoly producer will typically restrict output to some quantity below the market equilibrium. This is illustrated on the following supply and demand diagram, where Q(m) refers to the quantity produced by the monopolist. To find out what price we see in this market, draw the line up from Q(m) until it intersects the demand curve. This gives us the monopoly price, P(m). These contrast to the "free-market" equilibrium, which I label as Q(f) and P(f) in this diagram.
As you can see, since Q(m) < Q(f), then P(m) has to be greater than P(f), because the demand curve is downward-sloping.

In a competitive market, wealth is the sum of the red, yellow, and blue areas. In the monopoly market, it is just the sum of the yellow and red areas. The blue area is wealth that is lost to society. This area is the Deadweight Loss. This labeled as "DWL" in Figure 5.1. This is the cost to a society of allowing a monopoly to operate. So, in a monopoly, the producer makes more, the consumer makes less, and the society, added together, is poorer as a result.
This is called a Social Cost: a cost to the total society.
Sample Question
Demand is given by P = 100 – Q, Supply is given by P = Q. If the monopolist sets Q = 30, what is the dead-weight loss?
Answer:
In a competitive market, the equilibrium is defined by the intersection of supply and demand, so if P = Q and P = 100 - Q, then Q = 100 - Q, so 2Q = 100. Thus, Q = 50. If we substitute Q with 50 in either the supply or demand curve, then we get P = 50. So, the equilibrium price and quantity = (P*, Q*) = (50, 50). The consumer surplus will be 50 x 50 x 0.5 = 1,250, and the producer surplus will also be 1,250. (Why?) The total wealth generated by this market will be 2,500.
Now, how much wealth is lost if the producer can restrict output to 30?
Well, firstly, the price will be set by the demand curve, which is given by P = 100 - Q, which gives us 100 - 30 = 70. So, the monopoly equilibrium will be (P(m), Q(m)) = (70, 30). The dead-weight loss is the triangle between the demand and supply curves and the vertical line Q = 30. The area of this triangle is 20 x 40 x 0.5 = 400. So, the dead-weight loss is 400, and the total wealth generated by this market is only 2,100. This is a 16% reduction in total aggregate wealth generated by the market. Note that consumer surplus has been reduced to 450 from 1,250, and producer surplus has been increased to 1,650 from 1,250. So, in this market, the producers earn 400 units more wealth, the consumers earn 800 units less, and the market generates 400 fewer units of wealth.
Where did this wealth go? It is the lost potential wealth from trades that would take place between Q = 30 and Q = 50. In this market, there are consumers whose willingness to pay is above the market equilibrium price, but they are unable to buy because the monopolist will not sell to them. Now, why on earth would a monopolist not want to sell something? Well, let's see why.
Profit Maximizing in a Monopoly
The goal of a firm is to maximize profits. So, if a firm is free to set whatever price (or quantity) they want, which level will maximize profits?
Profit (producer surplus) is the area below the equilibrium price and above the supply curve. The supply curve is the same thing as the Marginal Cost curve for the firm.
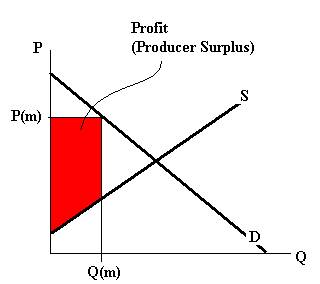
(Note: in Figure 5.2, I use Q(m) and P(m) to represent “monopoly equilibrium quantity” and “monopoly equilibrium price.")
At which value of Q(m) is the producer surplus (the profit, the red area) the largest?
Answer: it is maximized when supply = MC = MR (Marginal Revenue).
What is marginal revenue? Well, it is the amount of money a firm takes in from selling one more unit of the good. If the price is constant, then MR = price - selling one more unit means we collect one more times the price. But, in this case, since the monopolist faces a downward sloping demand curve, each additional unit he sells will have a lower price, and he will sell every unit at that lower price. As an example, using the demand curve in the numerical example above, if the monopolist sets Q(M) = 30, then he sells 30 units at a price of 70, and has total revenue of 70 x 30 = 2100. If he makes one more unit, he sells 31 units at a price of 69, for a revenue of 2139. His marginal revenue from making one more unit is 39, even though the price is 69.
So, we need to plot the marginal revenue curve.
It turns out that the marginal revenue curve is a line that has the same y-intercept as the demand curve, but has a slope that is twice as steep. So, if our demand curve is given as P = 100 - Q, then 100 is the intercept and -1 is the slope (remember the equation of a line; y = mx + b. In our case, y = -1 * x + 100, which is another way of writing P = 100 - Q.
So, the marginal revenue curve has the same intercept, 100, but is twice as steep, with a slope of -2.
This is written as: MR = 100 - 2Q
An Aside...
Here is a small aside, which is not obligatory and you will not be quizzed on. If you know calculus, you will be able to understand the following calculus-based explanation of why the monopolist sets his quantity to be that where MR = MC, and how we derive MR = a-2bQ.
A monopolist wants to maximize profit, and profit = total revenue - total costs.
We can write this as Profit = TR - TC. In calculus, to find a maximum, we take the first derivative and set it to zero:
Profit is maximized when d(TR)/dQ - d(TC)/dQ = 0
d(TR)/dQ = marginal revenue and d(TC)/dQ = marginal cost
So, d(TR)/dQ - d(TC)/dQ = 0 is the same as d(TR)/dQ = d(TC)/dQ, which is the same as MR = MC.
To find MR: MR = d(TR)/dQ = d(P*Q)/dQ.
If the demand curve is given by P = a – b*Q then TR = Q(a – b*Q) = aQ – bQ2
So, MR = d(aQ – bQ2)/dQ = a – 2bQ = MR
So, the MR curve has the same intercept as the demand curve, but its slope is exactly double that of the demand curve.
Generally, if a Demand curve is given as P = a - bQ, then MR = a - 2bQ.
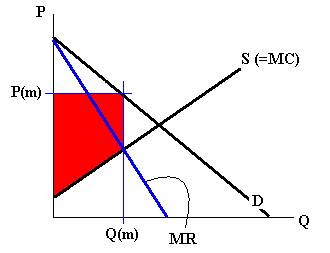
In Figure 5.3, the MR curve is shown in blue. To find the profit maximizing point, set Q to the amount where the MR and MC curves intersect. These will be sold at price P(m). Any other quantity will give a smaller profit (the red area on the graph.)
So, it is important to remember two things:
- The marginal revenue (MR) is a line with the same intercept as the demand curve, but with a slope twice as steep; and
- When MR = MC, profit is maximized.
We say that in a monopoly, profit is maximized when MR = MC, just like in a competitive market, when MR = Price = MC. You will remember that in a competitive market, the demand curve is flat. Its slope is zero. So, the derivative of this curve, which is the MR curve, also has a slope of zero (two times zero = zero.) So the result that P(max) occurs when MR = MC is true not just in a monopoly, but all markets.
Sample Questions
The demand curve is given as: P = 12 - Q.
The supply curve is given as: P = 2 + Q.
- What is the profit-maximizing equilibrium?
- What is the dead-weight loss?
Answers:
(Qm, Pm) = (3.33, 8.67)
Deadweight loss = 2.78
Try and work it through and see if you can get these answers.
Take Aways
After this lesson and the associated readings, you should be able to:
- define and understand the meaning of “market power;”
- know the names of markets with:
- one seller;
- two sellers;
- a few sellers;
- one buyer;
- understand why a monopolist can set price or quantity, but not both;
- describe the three ways a monopoly can come into existence;
- explain the effects of a monopoly on price and quantity compared to a free market;
- understand what happens to consumer and producer surplus in a monopoly;
- understand the concept of a “dead-weight loss” and a “social cost;”
- understand and apply the rule for profit maximization in a monopoly;
- find the marginal revenue curve:
- the intercept of the marginal revenue curve;
- the slope of the marginal revenue curve;
- find the monopoly equilibrium and compare it to the competitive equilibrium.