Prioritize...
Once you have finished this section, you should be able to state when in the forecast system development and testing we should measure forecast skill and discuss the general goal of the forecast skill metric for each phase of the development and maintenance cycle.
Read...
You might think that we measure forecast skill after the forecast has been made. Although that is correct, we actually measure forecast skill throughout the development and selection process. This ensures that not only do we begin running a suitable model, but we routinely verify that the forecast system is still performing as well as it did during testing. So instead of thinking of measuring forecast skill as a static one-time event, I encourage you to look at the task as being dynamic - a constantly ongoing process. Read on to learn more about the three key phases in which we measure forecast skill.
During Forecast System Development
Every statistical forecast system contains one or more tunable parameters that control the relationship between the predictors and the predictand. Developing a forecast system consists of using ‘training’ data (e.g., developmental data) to find the ‘best’ values for these parameters. For example, take a look at the figure below that shows two linear regression fits (green and red lines) to the data (black dots).
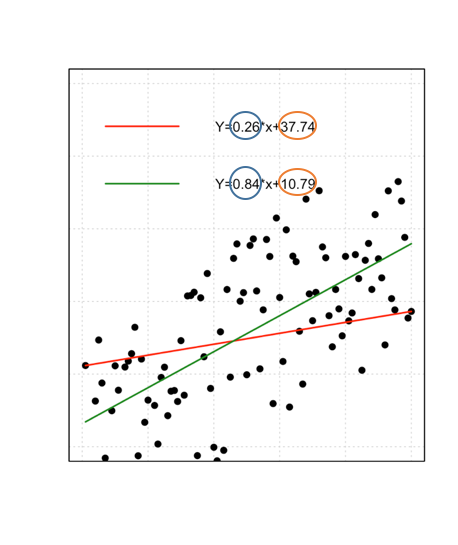
In linear regression, these parameters are the slope coefficients (circled in blue) and the intercept (circled in orange). But what is ‘best’? How were these coefficients selected? ‘Best’ is defined in terms of some measure of forecast skill (like the AIC score used in the example above) - or the reverse, forecast error.
In linear regression, we solve a set of equations once to find the best values of the parameters. Thus, the parameter tuning is done analytically. But we can also tune the parameters iteratively. We use a set of equations repeatedly to gradually improve initial guesses of the parameter’s value. This approach is used in logistic regression or other non-linear models.
Before we move on to the next phase of measuring forecast skill, let’s talk briefly about training vs. testing data. As a reminder, training data is the data used to tune the model parameter while the testing data is independent of the training data and is used to assess how well the model performs in operations. Generally, however, we will assess the skill on both the training and testing data. Why?
We can use the ratio of the error on the testing data to that on the training data to assess if the model is over fit. As a reminder, overfitting occurs when the model is too closely fit to a limited set of data points. (You can review the subject of overfitting in the Meteo 815 lessons on Linear Regression and Data Mining.) If the ratio is much larger than 1, then the model is over fit. Take a look at the figure below:

As the degree of the polynomial fit increases, the ratio becomes larger. An over fit polynomial might look great in MSE on the training data but do much more poorly on independent data, indicating that they’ll do poorly in operations (where the data is also independent of that used to train the model). This will be discussed in more detail in future lessons. The key here is that we can test if a model has been over fit, but the requirement is that we MUST have testing data that is independent of the training data.
During Forecast System Selection
Often, we have several competing sources of forecasts available. For example, take a look at the figure below:

The figure shows the mean RMSE for several three-hour forecasts of 500 mb heights in the Northern Hemisphere (20°N through 80°N). You can find information about the models here. In this example, the ECM (European Center for Medium-Range Weather Forecasts) has the lowest average RMSE for the verification period and would thus be a better choice than say the CFSR (Legacy GFS used for Climate Forecast System Reanalysis).
Now, take a look at this figure:

Again, this is the RMSE for several three-day forecasts of 500 mb heights, but in this case, we are looking at the mean over the tropics (20°S to 20° N). In this example, the JMA (Japan Meteorological Agency) has the lowest average RMSE over the whole verification period and thus would be the best model for predicting the tropics. Same models, same variable, same forecast hour, different purpose (tropics vs. Northern Hemisphere). As you can see, comparing models will be imperative because the same model may not be the best model across all user scenarios.
We need to decide which set of forecasts provides the most valuable guidance for the decision of interest. What we need is a quantitative measure of forecast skill so that we can make this comparison objectively. And this measure needs to be designed to fit the customer; that is, who needs the forecast, and what is their purpose (think back to our earlier example of the gardener and the emergency manager)?
In short, our forecast scoring metric needs to measure those aspects of skill that are important for our decision. For example, if we were forecasting frost for citrus growers, we don’t care about the forecast skill at warmer temperatures. We only care about the skill on days cool enough to have a chance of frost. Thus, one size most definitely does not fit all.
The forecast skill metric must be selected or designed to capture that which is of value to the customer! For example, this could include the quality of the decisions that need to be made based on the prediction (often as measured by the financial outcome of a set of such decisions). We will discuss this in more detail later on. The key here is to emphasize that skill metric is greatly dependent on the situation at hand. You need to master the skill of understanding the customer’s needs and turning that into a quantitative, easy-to-use metric capturing the forecast’s value for decision making.
During Forecast System Use
You might think that once the forecast system has been selected, you won’t need to assess the skill. But routine verification is used to make sure the forecast system is still performing as well as it did during testing. Remember, skill assessment is dynamic. For example, the available sources of input data can evolve with time, changing the forecast skill for better or worse. This is an important issue when using either observational data or numerical weather prediction model output as input to your forecast system. In addition, during forecast system use, we can determine if there is a seasonality or location dependence in the forecast system’s skill.
Now that we know when to measure forecast skill, we need to learn how to measure it. Read on to learn more about the different techniques for measuring forecast skill.