As I mentioned earlier, the original motivation for developing computer mapping systems was to automate the map making process. Computerization has not only made map making more efficient, it has also removed some of the technological barriers that used to prevent people from making maps themselves. What used to be an arcane craft practiced by a few specialists has become a "cloud" application available to any networked computer user. When I first started writing this text in 1997, my example was the mapping extension included in Microsoft Excel 97, which made creating a simple map as easy as creating a graph. Seventeen years later, who hasn't used Google Maps or MapQuest?
As much as computerization has changed the way maps are made, it has had an even greater impact on how maps can be used. Calculations of distance, direction, and area, for example, are tedious and error-prone operations with paper maps. Given a digital map, such calculations can easily be automated. Those who are familiar with CAD systems know this from first-hand experience. Highway engineers, for example, rely on aerial imagery and digital mapping systems to estimate project costs by calculating the volumes of rock that need to be excavated from hillsides and filled into valleys.
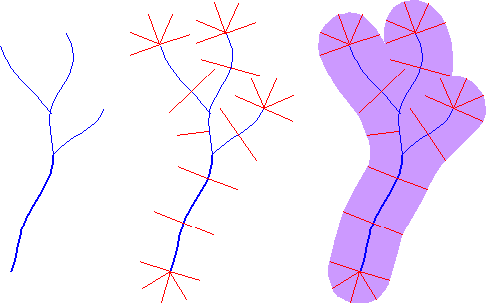
The ability to automate analytical tasks not only relieves tedium and reduces errors; it also allows us to perform tasks that would otherwise seem impractical. Consider, for example, if you were asked to plot on a map a 100-meter-wide buffer zone surrounding a protected stream. If all you had to work with was a paper map, a ruler, and a pencil, you might have a lengthy job on your hands. You might draw lines scaled to represent 100 meters, perpendicular to the river on both sides, at intervals that vary in frequency with the sinuosity of the stream. Then you might plot a perimeter that connects the end points of the perpendicular lines. If your task was to create hundreds of such buffer zones, you might conclude that automation is a necessity, not just a luxury.

Some tasks can be implemented equally well in either vector- or raster- oriented mapping systems. Other tasks are better suited to one representation strategy or another. The calculation of slope, for example, or of gradient--the direction of the maximum slope along a surface--is more efficiently accomplished with raster data. The slope of one raster grid cell may be calculated by comparing its elevation to the elevations of the eight cells that surround it. Raster data are also preferred for a procedure called viewshed analysis that predicts which portions of a landscape will be in view, or hidden from view, from a particular perspective.
Some mapping systems provide ways to analyze attribute data as well as locational data. For example, the Excel mapping extension I mentioned above links the geographic data display capabilities of a mapping system with the data analysis capabilities of a spreadsheet. As you probably know, spreadsheets like Excel let users perform calculations on individual fields, columns, or entire files. A value changed in one field automatically changes values throughout the spreadsheet. Arithmetic, financial, statistical, and even certain database functions are supported. But as useful as spreadsheets are, they were not engineered to provide secure means of managing and analyzing large databases that consist of many related files, each of which is the responsibility of a different part of an organization. A spreadsheet is not a DBMS. And, by the same token, a mapping system is not a GIS.