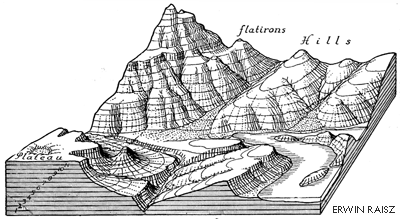
Drawing contour lines is a way to represent a terrain surface with a sample of elevations. Instead of measuring and depicting elevation at every point, you measure only along lines at which a series of imaginary horizontal planes slice through the terrain surface. The more imaginary planes, the more contours, and the more detail is captured.

Until photogrammetric methods came of age in the 1950s, topographers in the field sketched contours on the USGS 15-minute topographic quadrangle series. Since then, contours shown on most of the 7.5-minute quads were compiled from stereoscopic images of the terrain, as described in Chapter 6. Today, computer programs draw contours automatically from the spot elevations that photogrammetrists compile stereoscopically.
Although it is uncommon to draw terrain elevation contours by hand these days, it is still worthwhile to know how. In the next few pages, you'll have a chance to practice the technique, which is analogous to the way computers do it.