Summary
By now, you may have observed a theme in developing randomization distributions for hypothesis testing. Without giving specific code, our hypothesis testing procedure generally goes like this:
- Formulate null and alternative hypotheses
- Calculate the sample statistic from original data
- Compute the randomization distribution
- Simulate new sample under the condition of the null hypothesis being true
- Calculate the sample statistic from new, simulated sample
- Repeat many times and save the collection of simulated sample statistics (this collection is your randomization distribution)
- [Optional, but recommended] Visualize the randomization distribution and original sample statistic (histograms or dotplots are great for this)
- Find the p-value as the proportion of simulated sample statistics that are at least as extreme as the original sample statistic
- State the conclusion of your hypothesis test, in the context of the original hypotheses and larger problem
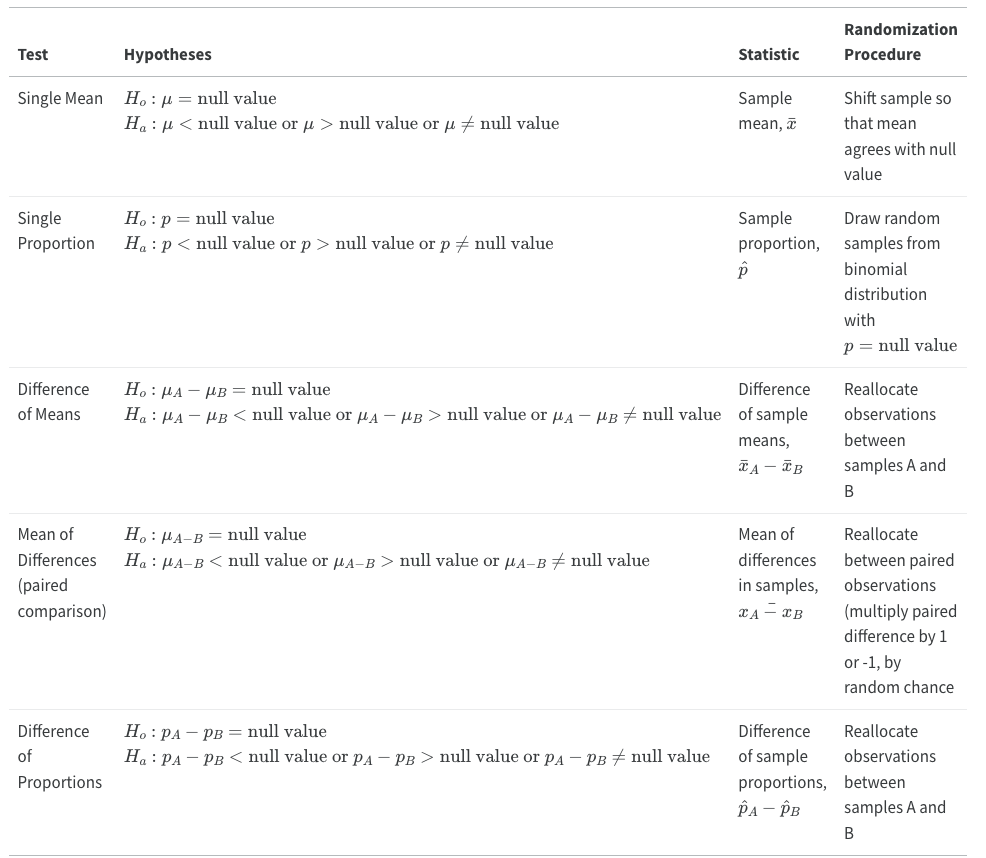
The table below summarizes the various tests that we've covered so far, but bear in mind that as long as you can calculate a statistic (a single-valued summary) from your data and formulate hypotheses, you can adopt the framework above to perform a hypothesis test. This is a valuable feature of the randomization approach!
| Test | Hypotheses | Statistic | Randomization Procedure |
|---|---|---|---|
| Single Mean | or or |
Sample mean, | Shift sample so that mean agrees with null value |
| Single Proportion | or or |
Sample proportion, | Draw random samples from binomial distribution with |
| Difference of Means | or or |
Difference of sample means, | Reallocate observations between samples A and B |
| Mean of Differences (paired comparison) |
or or |
Mean of differences in samples, | Reallocate between paired observations (multiply paired difference by 1 or -1, by random chance |
| Difference of Proportions | or or |
Difference of sample proportions, | Reallocate observations between samples A and B |
A major challenge is figuring out which form of hypothesis test is appropriate for your given problem. The flowchart below can help, and reviewing problems in this course and textbook will help you build a sense of what test to perform.
 Assess It: Check Your Knowledge Quiz
Reminder - Complete all of the Lesson 5 tasks!
You have reached the end of Lesson 5! Double-check the to-do list on the Lesson 5 Overview page to make sure you have completed all of the activities listed there before you begin Lesson 6.
