Hypothesis Test for Single Mean
If you have a single sample, and are concerned with showing that its mean is significantly larger or smaller than some value (which will be the null value), then you want to perform a "single mean test".
 Read It: Hypothesis Test for Single Mean
In a single mean test, your statistical hypotheses will take the following form, and your statistic, computed on both the original sample and the randomized samples, is :
| Test | Hypotheses | Statistic | Randomization Procedure |
|---|---|---|---|
| Single Mean | or |
Sample mean, | Shift sample so that mean agrees with null value |
The null value will typically be some threshold or standard that you are comparing your sample mean against. Going back to the PM2.5 example earlier in this lesson, the null value for that single mean test is 12.5 micrograms per cubic meter.
Randomization Procedure
The randomization procedure that we will use for a test of a single mean involves shifting all the values in the original sample by a uniform amount, such that the resulting sample mean equals the null value, . The amount to shift all values by is the difference between and the original sample mean, . The pseudo-code for this procedure is:
-
Obtain a sample of size n
-
Calculate:
-
For i in 1, 2, ..., N
-
Randomly draw a new sample, of size n, with replacement from the shifted sample, .
-
Calculate the sample mean for this new randomized sample
-
Store this value as the ith randomized statistic
-
-
Combine all N randomized statistics into the randomization distribution
Random drawing of values with replacement allows for the possibility of values being drawn more than once, and with equal probability each time.
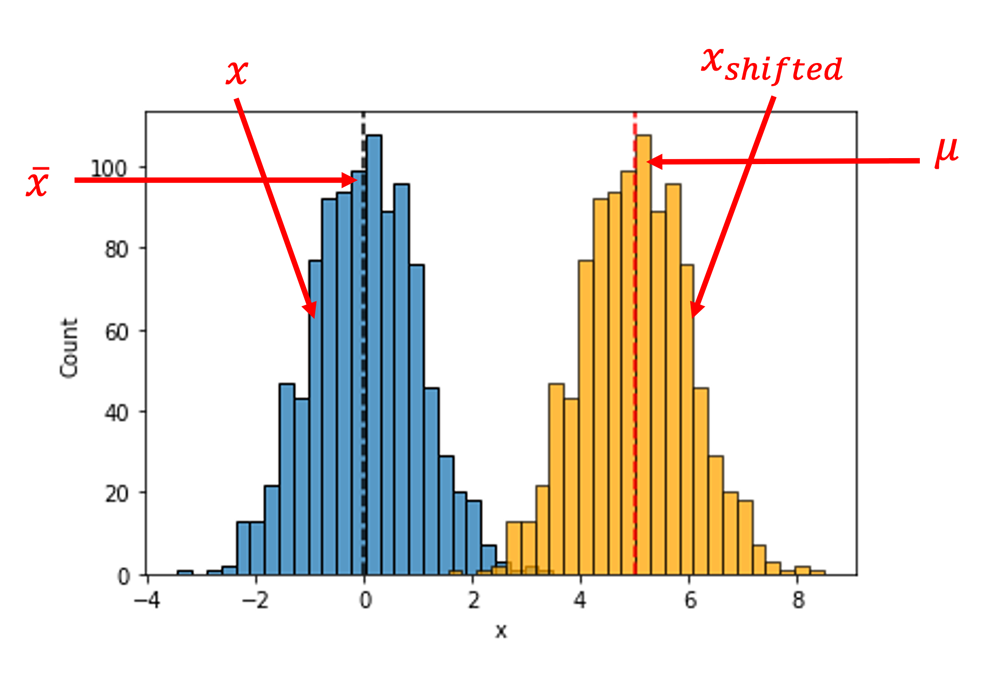
The figure below provides an example of this randomization procedure. The blue histogram represents the original sample data, centered at , and the yellow histogram depicts the shifted sample which is now centered at the null value, . Note that the two histograms share the exact same shape, and thus the same spread.
The following video demonstrates how to implement this procedure in Python, using the 2021 Texas Power Crisis as an example.
 Watch It: Video - Hypothesis Test for Single Mean (15:34 minutes)
The Google Colab Notebook use in the above video is available here(link is external), and the data are here(link is external). For the Colab file, remember to click "File" then "Save a copy in Drive". For the data, it is recommended to save to your Google Drive.
 Try It: Tesla Range Scandal
A class-action lawsuit(link is external), filed August 2nd, 2023, essentially alleges that Tesla, the electric vehicle company, grossly exaggerated the ranges on some of its vehicles. Plaintiffs claim that the rated ranges on their Tesla cars are much larger than actual ranges they get under normal driving conditions. The lawsuit includes several Tesla models, one of which being the Model S. Plug In America collects self-reported survey data on EV performance, including the Model S(link is external). In this example, we'll look at the 70 kWh, dual motor ("70D") version of the Model S, with a rated range of 240 miles. We will exclude any cars with more than 10,000 miles on the odometer. As of this writing, the dataset includes a sample of 5 of these cars.
Our question here is "Do the actual ranges of the Model S 70D fall significantly below the rated range of 240 miles?" Our hypothesis could be: "Yes, they do fall below." Thus, our statistical hypotheses are:
Develop Python code below to test these hypotheses, and calculate a p-value. The knowledge check will then ask about the conclusion of this test.
 Assess It: Check Your Knowledge