Data Structures
With this being a data analytics course, it is important to start with a focus on data. Data comes in a lot of different forms and can be organized into many different structures. The list below covers some main, basic data structures, in general terms:
Scalar
A scalar is just a single value. For example:
Vector
A vector contains multiple scalars organized into a single row:
or column:
The defining feature of a vector is that it is one-dimensional, regardless of which direction it goes.
Matrix
A matrix contains multiple values organized into a 2-dimensional array:
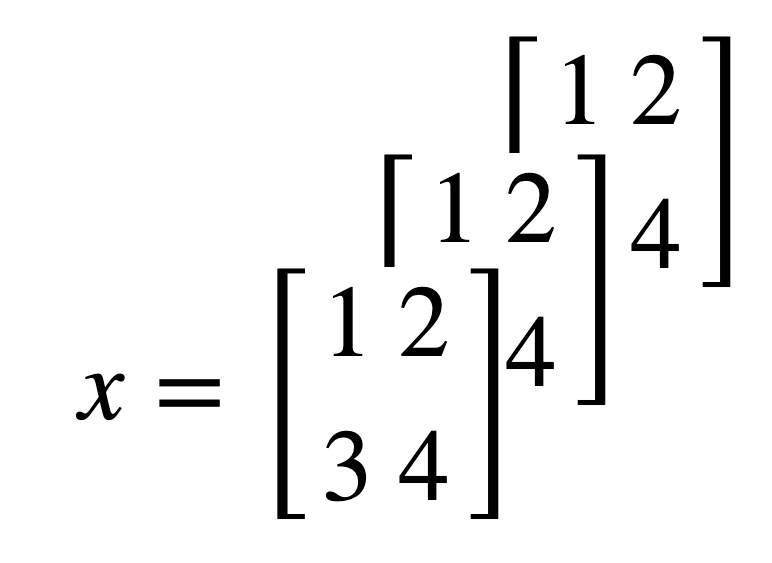
Tensor
A tensor is a multidimensional set of arrays. For example, a 3-dimensional tensor can be thought of as a stack of matrices:
Table
So far, all the data structures listed above are for a single data type (i.e., only numbers). A table contains multiple variables (or vectors) organized into columns, and the different variables can have different data types (e.g., numbers and text), although any single variable needs to contain only a single data type (we'll talk more about data types in Lesson 2). Furthermore, tables typically have labels for the variables, as column headings:
| HOME ID | DIVISION | KWH |
|---|---|---|
| 10460 | Pacific | 3491.900 |
| 10787 | East North Central | 6195.942 |
| 11055 | Mountain North | 6976.000 |
| 14870 | Pacific | 10979.658 |
| 12200 | Mountain South | 19472.628 |
| 12228 | South Atlantic | 23645.160 |
| 10934 | East South Central | 19123.754 |
| 10731 | Middle Atlantic | 3982.231 |
| 13623 | East North Central | 9457.710 |
| 12524 | Pacific | 15199.859 |
* Data Source: Residential Energy Consumption Survey (RECS)(link is external), U.S. Energy Information Administration (accessed Nov. 15th, 2021)
 Assess It: Check Your Knowledge