Central Limit Theorem
 Read It: The Central Limit Theorem
In the previous page, we discussed the normal distribution and z-scores. The reason we are able to use the normal distribution and z-scores to find confidence intervals and conduct hypothesis tests is called the Central Limit Theorem. This statistical theory provides evidence for normally distributed sampling distributions, even if the original data are not normally distributed.
Provided a sufficiently large sample size and identically distributed independent samples, the central limit theorem finds that the standardized sample means tend towards the standard normal distribution.
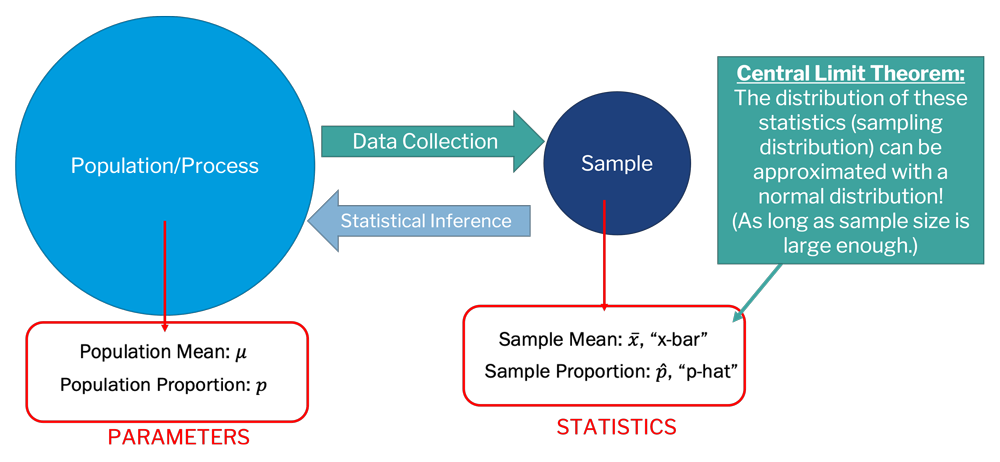
In other words, if our sample size is large enough, the sampling distribution should tend toward normal. This is why our randomization procedures often lead to bell-shaped histograms when showing the sampling distribution. The central limit theorem is also why we can make statistical inferences about a population even though we only collect a sample of the data, as shown in the image below. In other words, say you collect some data, this is your sample, which has some statistics (e.g., , , etc.). The central limit theorem tells us that the distribution of these sample statistics can be approximated with a normal distribution, assuming that the sample size is sufficiently large enough.
An important question, however, is what is "sufficiently large"? It is a little subjective, and it often depends on your data. In chapter 3 of the textbook, the authors provide an example of how to calculate the optimal sample size to meet the criteria for the central limit theorem. However, for most of this class, we will aim for at least 1,000 values in our sampling distributions. Note, this is the "N" in our randomization procedures! We also want to maintain a large enough sample from which we are randomly drawing values (the "n" in the randomization procedures). Generally, you will want at least 30 or 50 data points to ensure that you have a large enough of pool of data to draw from.
 Assess It: Check Your Knowledge