Click here for a transcript.
Hi. In this video we're going to cover merging data frames. So, we're going to continue with our state energy ranking data from the Energy Information Administration. In this video, we're going to merge the natural gas data frame ngdf, with the total energy data frame tedf. Let's exemplify this first with the inner merge. This is the default method. And we'll do this by creating a new data frame, which is called DF, generically PD. To reference pandas, merge these two objects: ngdf, tedf. We want to merge the natural gas with the total energy. We also need to specify on which variable to merge. So, let's do this by state, that is, it's going to match Texas and natural gas with Texas, and total energy Pennsylvania in the first, Pennsylvania the second, and so on, and so forth. So it's going to pair them off on a basis of state. Let's see what this looks like. Here we go. So we've got first the rankings. We've got rank underscore X. That's interesting. What does that mean? Well, these are the rankings from the natural gas data frame. That's our first data frame. So it gives it the subscript X as opposed to rank Y. So this is the rank from the second one. Note that these two variables were called the same thing. So it automatically appended these X and the Y to distinguish the two. Then we have state. This was our variable, our key variable, that we're performing the merge on. So we have all the states here, and then we've got our natural gas and our total energy. And now this miraculous function has automatically paired the values according to what state they belong to.
However, there's a problem with this. We scroll down, we don't have all the states. This stops at 33. Note that the indexes for this start at zero. So we've got 33 states here. There really ought to be 51, 50 states, plus DC. So what happened? Why'd you get rid of those? Well it only kept the states that were equal in natural gas and total energy. Recall that in the natural gas data frame we had some states that had their full names in there. Let's try this a different way. Let's try it with the outer join. So say it's DF again PDF for pandas dot merge. And again, we'll have our ngdf, or tedf, on equals state. And now we'll say, how is outer. So we're going to do an outer merge. Let's see what result we get here. So we still have our rank X, our rank y, that all looks the same. But now we've got down to 69 states. Well, that's strange. That's too many. I'll click on this thing to just get a better inspection of the output here. What's going on, if we scroll down, we need to display some more values here. We see that we've got these states by name here, that don't have any data, no natural gas production, no total energy production. And then we've got their corresponding acronyms. So how did this happen? Well, the natural gas production data set had these states listed out in their full name because they didn't produce any natural gas, so it listed them differently for whatever reason. Whereas the total energy data set does have data for these states and uses their two-letter abbreviation. And the merge function can't associate these two things because it's just not that intelligent. It doesn't recognize that Hawaii is abbreviated HI. We would need to tell it that. So, what do we do? Well, this will be for the next video, logic and subsetting. We'll solve that problem there. For now, that's it for merging.
 Read It: Hypothesis Tests and the Central Limit Theorem
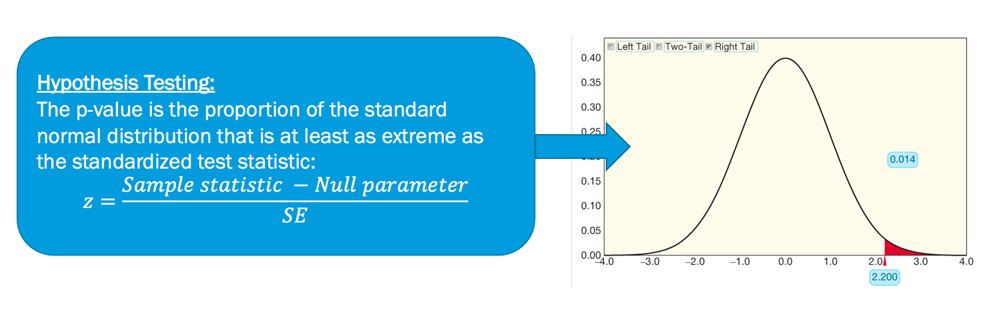
 Watch It: Video - Calculating P-Values Using the Normal Distribution (5:06 minutes)
 Try It: DataCamp - Apply Your Coding Skills
 Assess It: Check Your Knowledge