 Read It: Merging DataFrames
Often, one can perform more interesting and meaningful analyses by using larger datasets, with more variables and/or cases. One way of creating new, sizeable DataFrames is by merging multiple smaller DataFrames. The merge function in Pandas makes the task or merging two DataFrames (let's call them LeftDataFrame and RightDataFrame) relatively easy:
1 | LeftDataFrame.merge(RightDataFrame, how='inner', on=key) |
Here, we are just focusing on just the main inputs to the merge function, and one can view the documentation(link is external) to see the other optional inputs. To start, "key" is a variable (or set of variables) common to both DataFrames, and that we want to use as the basis for merging the two DataFrames. Usually, "key" identifies the unique cases in each DataFrame. The argument "how" indicates which rows to keep from the DataFrames. To explain this further, let's examine each of the four possible methods for "how"
1.) how = 'inner'
To begin, consider both DataFrames as a Venn diagram, where each circle represents the values of the "key" variable contained within that DataFrame:
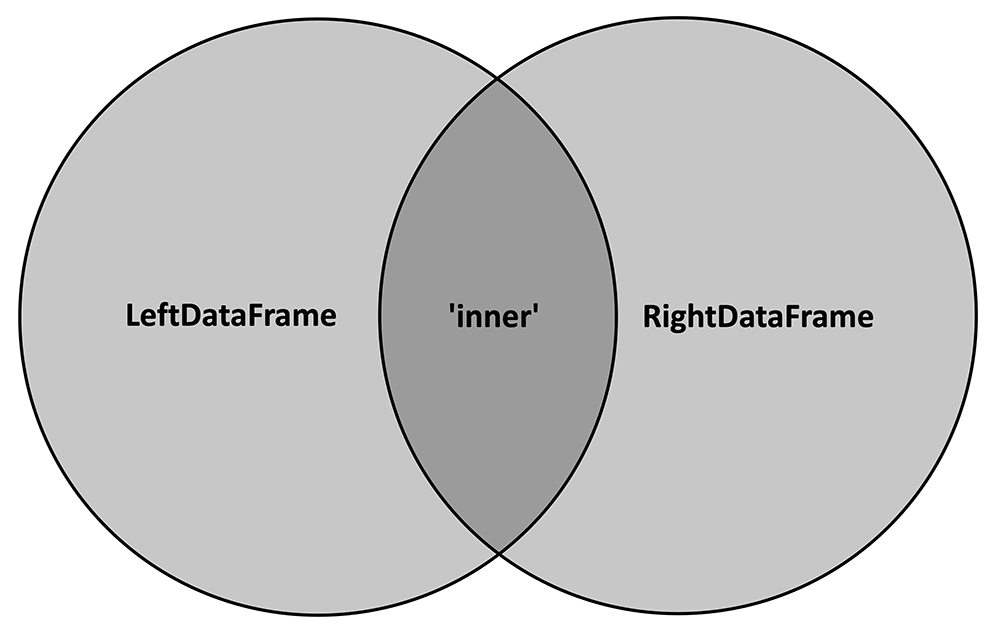
The 'inner' merge method will only keep the key values that are common to both DataFrames, or, in other words, the intersection of the two circles. The following cartoon depicts how this method would work on two example DataFrames:
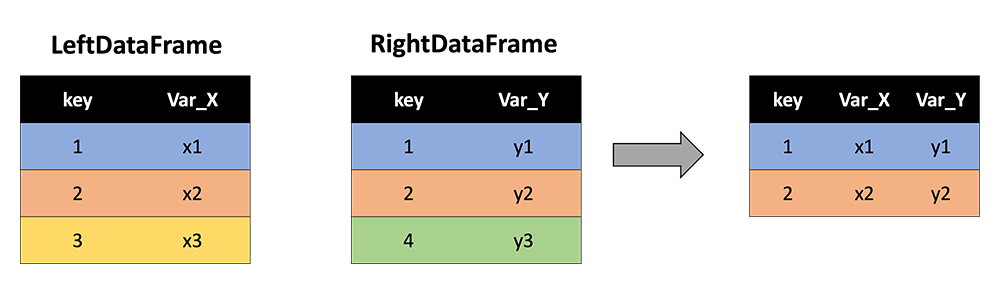
Note that key values of 3 and 4 are dropped because 3 is not contained in RightDataFrame and 4 is not contained in LeftDataFrame. Only 1 and 2 are retained since they are common to both DataFrames. Further, note that the resultant DataFrame contains all variables (columns) from each of the two input DataFrames (and "key" is not repeated).
2.) how = 'outer'
In contrast to the 'inner' method, 'outer' keeps all the key values from both DataFrames, or, in other words, the union of the two circles in the Venn diagram:
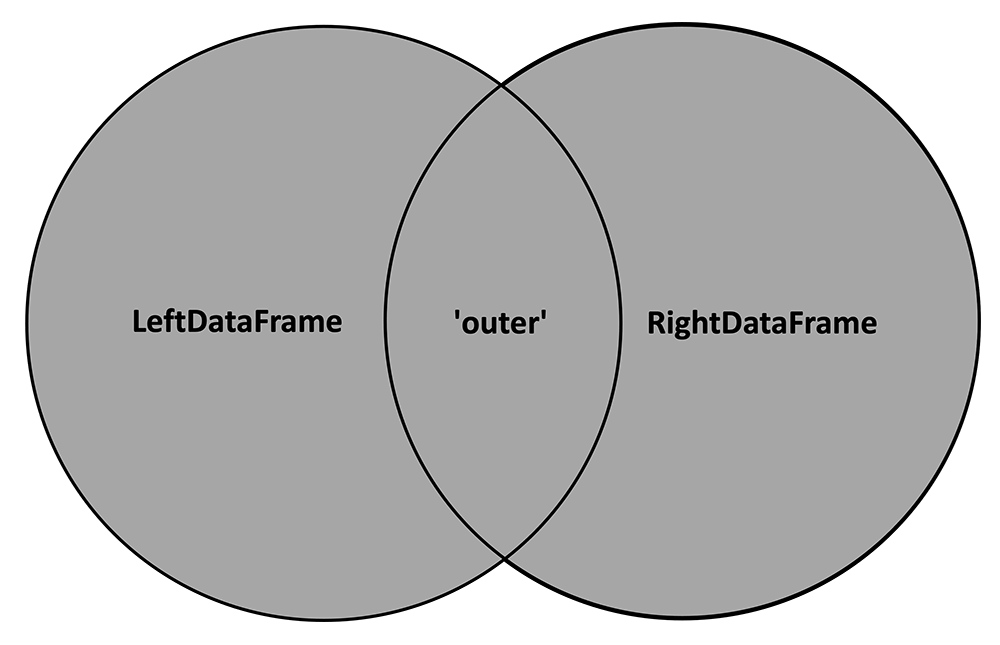
With 'outer' applied, our cartoon with the two example DataFrames now looks like this:
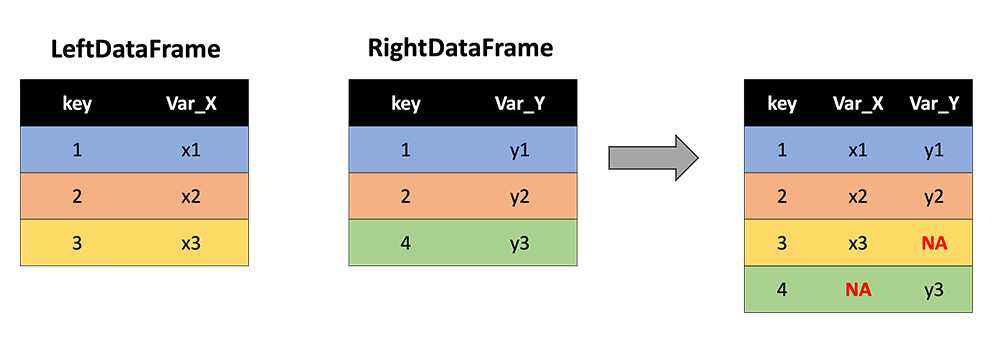
Now key values of 3 and 4 are retained, and NA values are inserted where either Var_X or Var_Y are not observed.
As a special use case, if one wishes to simply "stack" two DataFrames (say, with identical variable names but different rows/keys), they can use 'outer' and leave the on argument blank (defaults to all columns).
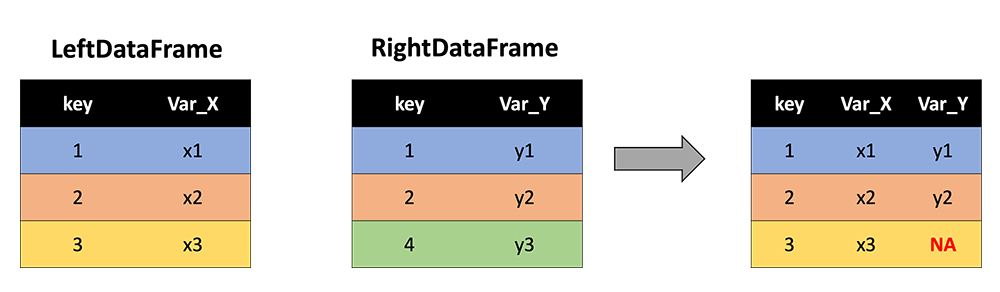
3.) how = 'left'
The 'left' method keeps all the rows with keys from the LeftDataFrame:
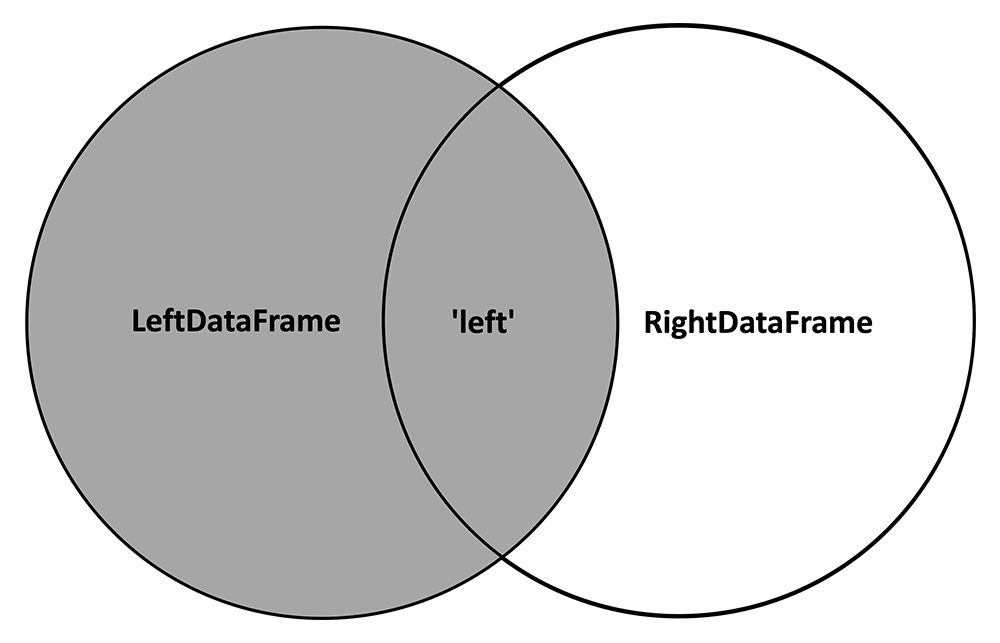
And inserts NA values where variables from the RightDataFrame are not observed:
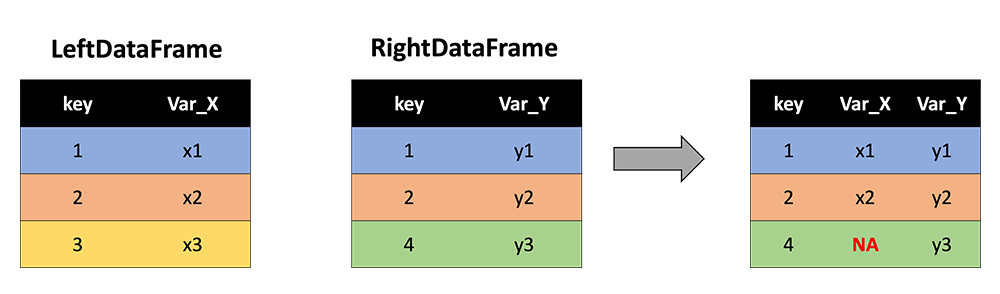
4.) how = 'right'
In contrast, the 'right' method keeps all the rows with keys from the RightDataFrame:
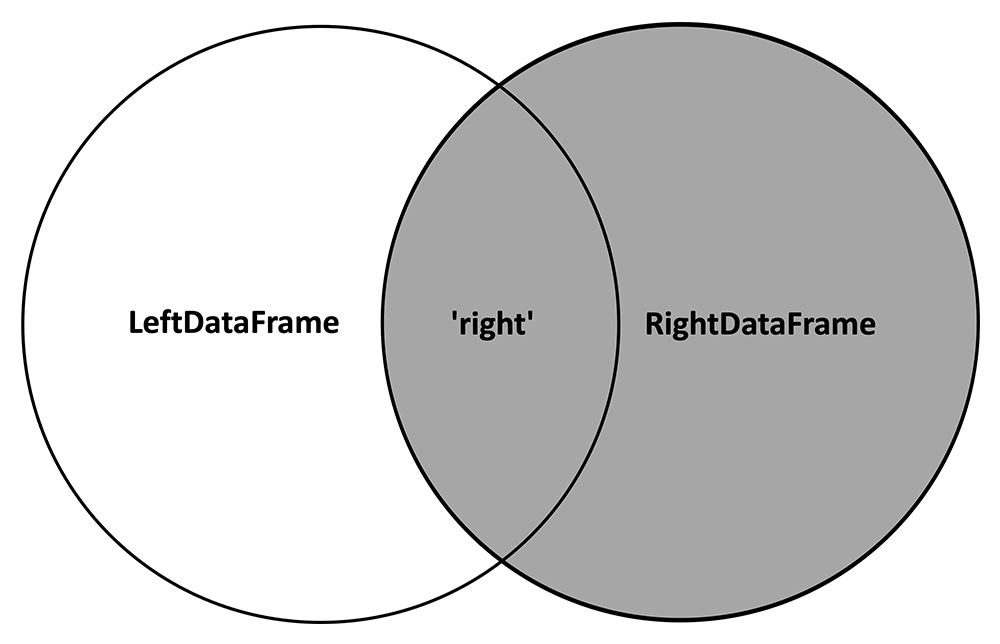
And inserts NA values where variables from the LeftDataFrame are not observed:
 Watch It: Video - Datatypes in Python (13:43 minutes)
 Try It: DataCamp - Merge Two DataFrames
In the exercise below, you are given two DataFrames:
| HOME ID | DIVISION | KWH |
|---|---|---|
| 10460 | Pacific | 3491.900 |
| 10787 | East North Central | 6195.942 |
| 11055 | Mountain North | 6976.000 |
| 14870 | Pacific | 10979.658 |
| 12200 | Mountain South | 19472.628 |
| 12228 | South Atlantic | 23645.160 |
| 10934 | East South Central | 19123.754 |
| 10731 | Middle Atlantic | 3982.231 |
| 13623 | East North Central | 9457.710 |
| 12524 | Pacific | 15199.859 |
| HOME ID | CLIMATE | TOTAL SQUARE FEET |
|---|---|---|
| 13623 | Cold/Very Cold | 1881 |
| 11055 | Cold/Very Cold | 2455 |
| 10460 | Marine | 800 |
| 12200 | Hot-Dry/Mixed-Dry | 3800 |
| 12524 | Marine | 1110 |
| 10332 | Hot-Dry/Mixed-Dry | 1630 |
| 12106 | Cold/Very Cold | 5184 |
| 11718 | Mixed-Humid | 1812 |
| 14500 | Marine | 2195 |
| 13193 | Marine | 847 |
* Data Source: Residential Energy Consumption Survey (RECS)(link is external), U.S. Energy Information Administration (accessed Nov. 15th, 2021)
Note that these two DataFrames share some of the same cases, identified by "HOME ID" (a numeric idenifier unique to each home). In the exercise below, start by seeing what happens when you perform an 'inner' merge:
How does the resulting DataFrame change when you peform an 'outer' merge? A 'left' merge? A 'right' merge? Pay attention to which rows are kept and where NA values are inserted.
 Assess It: Check Your Knowledge
 FAQ
FAQ