Dating with Ice Sheets
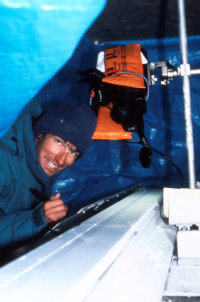
This image is of Kurt Cuffey, a Penn State student at the time, studying an ice core from GISP2, central Greenland, in the undersnow laboratory constructed for the project. Image taken by R. B. Alley © Penn State is licensed under CC BY-NC-SA 4.0(link is external)
A difficulty in lakes—and other archives such as annually layered stalagmites in caves—is that an annual layer must be thick enough to be recognized, but a lake or a cave will fill up quickly if layers are thick, so the records cannot be extremely long.
Longer records are possible from the two-mile-thick ice sheets. Dr. Alley has been very active in this work, and Dr. Anandakrishnan has contributed in important ways. In central parts of the ice sheets, the temperature almost never rises high enough to melt any snow and ice. However, summer snow and winter snow look different because the sun shines on the snow in the summer, “cooking” the snow and changing its structure, but the sun does not shine on the winter snow, which is buried by new storms before the summer comes. You can count many, many layers by looking at an ice core, and Dr. Alley has done so, working especially on one core called GISP2, which was drilled just west of the summit of the Greenland ice sheet during the years 1989-1993.
Video: Ice Layers (5:04 minutes)
Here is a video showing how the GISP2 ice core was collected and analyzed, and then a written description with more information.
To verify that the layers are annual, several things were done. First, one person (Dr. Alley) looked at the core, waited a while, and then looked at it again to see that the counting is reproducible (without cheating by looking at the first count while making the second one). Then, several other people counted the layers visible in the core (without cheating by finding out what Dr. Alley had gotten), just to make sure they agreed.
There are many annual indicators in ice cores, probably more than a dozen. For example, the isotopic composition of the ice is a thermometer that records summer and winter. And sunshine makes hydrogen peroxide in the air in the summer when the sun shines, and the peroxide falls on the ice quickly, but there is almost no peroxide made and deposited in the dark winter. So annual layers have been counted using several different indicators, and they agree closely.
This is still not good enough. When a large volcano erupts, it throws ash and sulfuric acid into the stratosphere. These spread around the Earth. The bigger pieces of ash fall out quickly, often in days or less, while the sulfuric acid may take one to a few years to fall (and, until it falls, affects the climate by blocking a little of the sunlight). You can use electrical or chemical techniques to find the layers of volcanic fallout in ice cores. The key sections can then be cut out, melted, and filtered, and any volcanic ash that is found can be analyzed chemically and compared to that from known volcanic eruptions. So, if you count back to the year 1783 in a Greenland ice core, you are in the year of the great Icelandic fissure eruption of Laki, which spread dry fogs across Europe and is well recorded in histories—Ben Franklin commented on the fogs in Paris while he was ambassador there for the fledgling United States. In fact, ash of the composition of Laki occurs in Greenland ice cores at the level dated 1783 by layer counting—the layer counting is right (or very close—some counts missed by a year or two initially). Similarly, ash from many other historical volcanoes has been found, back as far as historically dated volcanoes are known.
Comparison of counts of strata by one person at different times, by different people, and by different methods, and comparison to volcanic fallout, yielded almost the same answers, within about one year in one hundred (so one person may count 100 years, and another will count 99, or 100, or 101, but not 107 or 93 or some similarly large error).
There are a few more tests yet. There were very large and very rapid climatic changes at certain times in the past. Ice cores record the climatic conditions locally (how much snow accumulated and how cold it was), regionally (how much dust and sea salt and other things were blowing through the air to the ice from sources beyond the ice sheet), and globally (by trapping bubbles of air, which contain trace gases such as methane that are produced across much of the Earth’s surface and that changed in the atmosphere when the abrupt climate changes affected the sources of the greenhouse gases). Changes in all of these indicators occur at the same level in the ice cores, showing that the climate changes affected much of the Earth.
These changes left their “footprint” in the ice of Greenland, and the lakes of Switzerland and Poland, and the trees of Germany, etc. So, different groups can date such changes in the annually layered deposits of all of these different places. And, the dates agree closely. These events also have been dated radiometrically (we’ll cover this soon), and the dates also agree closely. One event, for example, was a short-lived return to cold conditions in the far north during the warming that ended the ice age, and is called the Younger Dryas. Close agreement as to its age is obtained from all of these different layered deposits and from radiometric ages—the Younger Dryas ended and warmer conditions returned to the far north about 11,500 years ago.
Thus far, the layers in the ice cores provide the longest reliable records. Over 100,000 layers have been counted. High accuracy was achieved younger than about 50,000 years, with somewhat lower reproducibility (maybe 10% or so, and with well-understood reasons for the lower accuracy) older than about 50,000 years. Still older ice exists, but those still-older layers in Greenland have been mixed up by ice flow and no longer give a reliable chronology. Thus, we have high confidence of more than about 100,000 years from the ice cores. (Really old ice in Antarctica, to 800,000 years or so, got less snowfall in a year than the height of a snowdrift, so annual layers are not preserved reliably, and other dating techniques must be used.)