Syntax introduced:
plot line axis randn
plot(x,y) creates a figure window and plots the values of vector x on the x axis versus the values of vector y on the y axis. MATLAB defaults to a blue solid line connecting all the data points, but you can specify a range of linestyles, colors, and symbols. The vectors x and y need to be the same length.
If you want more than one dataset on the same axes, there are a few ways to do it. You can specify several pairs of vectors in the same plot command, you can type hold on in between plot commands, or you can use the line command for all subsequent plots after the first plot command. Note that line only takes two arguments (x and y values), so you can't use it if you want to plot discrete data points.
MATLAB defaults to adapting the axes ranges to the range of values in the vectors being plotted. To set specific axes ranges instead, use axis([xMin,xMax,yMin,yMax])
>> x=linspace(1,10);
>> y=randn(size(x));
>> z=y*.5;
>> plot(x,y,'r-','linewidth',2);
>> hold on;
>> plot(x,y,'ko','markerfacecolor','c');
>> line(x,z);
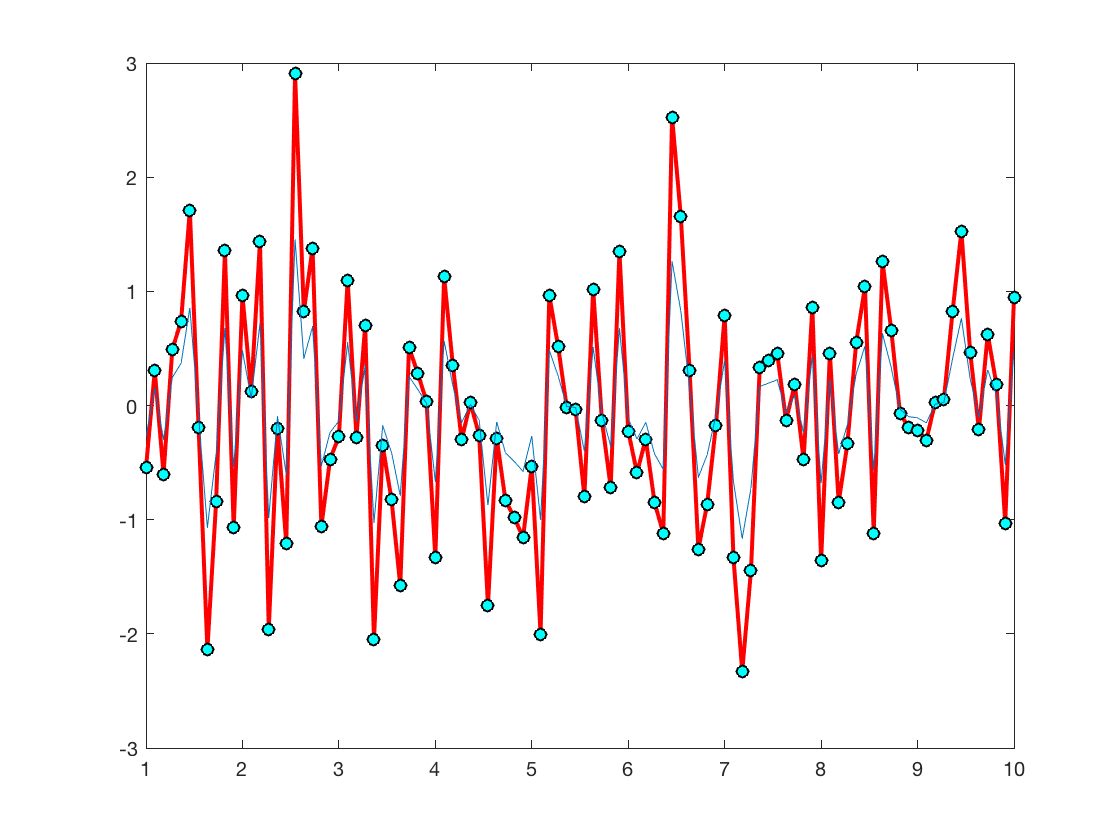
In the code snippet that produces the plot above, here is an explanation in English. First I created a 100-point equally-spaced vector that went from 1 to 10. Then I used randn to make another vector with random entries that is the same length as the first vector. Then I made another vector the same length as the first two whose entries are all half the value of what they were in the second vector. The rest of the snippet is plotting. The line plot(x,y,'r-','linewidth',2); plots x vs. y with a red line two points wide. I use hold on so that the next plot command plots over the first one without clearing the plotting axes. The next plot command plots the same data as before, using a black circle that is filled with cyan. Then the line command plots x vs. z using a blue solid line that is the default. To look up the various colors, symbols, and linestyles do help plot inside the MATLAB command window.