Debugging is a very important part of writing code. The simplest method of debugging is to embed print statements in your code to either determine how far your code is running through a loop or to print out the contents of a variable. This works to some degree, but it does not tell you why your code failed where it did. A more detailed method involves using the tools or features of your IDE to create watches for checking the contents of variables and breakpoints for stepping through your code.
We will provide a generic overview of the techniques here of setting breakpoints, watches, and stepping through code. Don’t focus on the specifics of the interface as we do this. Instead, it is more important to understand the purpose of each of the different methods of debugging. The debugger will be your greatest tool for writing code and working through complex processes since it will allow to inspect your variables, data, and step through your application's or script's execution flow.
We will start off by looking at PyScripter debugging functions. There's more details of the different debugging Engines in the PyScripter Debugger wiki. For this class, the standard debugger will work.
The best way to explain the aspects of debugging is to work through an example. This time, we'll look at some code that tries to calculate the factorial of an integer (the integer is hard-coded to 5 in this case). In mathematics, a factorial is the product of an integer and all positive integers below it. Thus, 5! (or "5 factorial") should be
5 * 4 * 3 * 2 * 1 = 120
The code below attempts to calculate a factorial through a loop that increments the multiplier by 1 until it reaches the original integer. This is a valid approach since 1 * 2 * 3 * 4 * 5 would also yield 120.
# This script calculates the factorial of a given
#  integer, which is the product of the integer and
#  all positive integers below it.

number = 5
multiplier = 1

while multiplier < number:
    number *= multiplier
    multiplier += 1

print (number)
Even if you can spot the error, follow along with the steps below to get a feel for the debugging process and the PyScripter Debug toolbar.
Open PyScripter and copy the above code into a new script.
- Save your script as debugger_walkthrough.py. You can optionally run the script, but you won't get a result.
- Click View > Toolbars and ensure Debug is checked. You should see a toolbar like this:
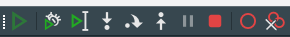 Many IDEs have debugging toolbars like this, and the tools they contain are pretty standard: a way to run the code, a way to set breakpoints, a way to step through the code line by line, and a way to watch the value of variables while stepping through the code. We'll cover each of these in the steps below.
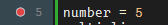
 - Move your cursor to the left of line 5 (number = 5) and click. If you are in the right area, you will see a red dot next to the line number, indicating the addition of a breakpoint. A breakpoint is a place where you want your code to stop running, so you can examine it line by line using the debugger. Often you'll set a breakpoint deep in the middle of your script, so you don't have to examine every single line of code. In this example, the script is very short, so we're putting the breakpoint right at the beginning. The breakpoint is represented by a circle next to the line of code, and this is common in other debuggers too.
 Note that F5 is the shortcut key for this command.
 - Press the Debug file
 button . This runs your script up to the breakpoint. In the Python Interpreter console, note that the debugfile() function is run on your script rather than the normal runfile() function. Also, instead of the normal >>> prompt, you should now see a [Dbg]>>> prompt. The cursor will be on that same line in PyScripter's Editor pane, which causes that line to be highlighted.
 - Click the Step over next function call button
 or the Step into subroutine
  button. This executes the line of your code, in this case the number = 5 line. Both buttons execute the highlighted statement, but it is important to note here that they will behave differently when the statement includes a call to a function. The Step over next function call button will execute all the code within the function, return to your script, and then pause at the script's next line. You'd use this button when you're not interested in debugging the function code, just the code of your main script. The Step into subroutine button, on the other hand, is used when you do want to step through the function code one line at a time. The two buttons will produce the same behavior for this simple script. You'll want to experiment with them later in the course when we discuss writing our own functions and modules.
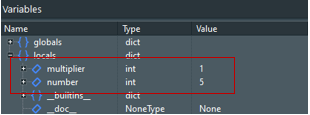
 - Before going further, click the Variable window tab in PyScripter's lower pane. Here, you can track what happens to your variables as you execute the code line by line. The variables will be added automatically as they are encountered. At this point, you should see a globals {}, which contain variables from the python packages and locals {} that will contain variables created by your script. We will be looking at the locals dictionary so you can disregard the globals. Expanding the locals dictionary, you should see some are built in variables (__<name>__) and we can ignore those for now. The "number" variable should be listed, with a type of int. Expanding on the +, will expose more of the variables properties.
- Click the Step button again. You should now see the "multiplier" variable has been added in the Variable window, since you just executed the line that initializes that variable, as called out in the image.
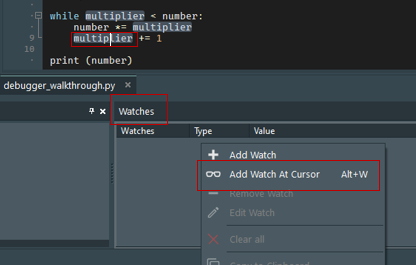
- Click the Step button a few more times to cycle through the loop. Go slowly, and use the Variable window to understand the effect that each line has on the two variables. (Note that the keyboard shortcut for the Step button is F8, which you may find easier to use than clicking on the GUI.) Setting a watch on a variable is done by placing the cursor on the variable and then pressing Alt+W or right clicking in the Watches pane and selecting Add Watch At Cursor. This isolates the variable to the Watch window and you can watch the value change as it changes in the code execution.
-
Step through the loop until "multiplier" reaches a value of 10. It should be obvious at this point that the loop has not exited at the desired point. Our intent was for it to quit when "number" reached 120.
Can you spot the error now? The fact that the loop has failed to exit should draw your attention to the loop condition. The loop will only exit when "multiplier" is greater than or equal to "number." That is obviously never going to happen as "number" keeps getting bigger and bigger as it is multiplied each time through the loop.
In this example, the code contained a logical error. It re-used the variable for which we wanted to find the factorial (5) as a variable in the loop condition, without considering that the number would be repeatedly increased within the loop. Changing the loop condition to the following would cause the script to work:
while multiplier < 5:
Even better than hard-coding the value 5 in this line would be to initialize a variable early and set it equal to the number whose factorial we want to find. The number could then get multiplied independent of the loop condition variable.
-
Click the Stop button in the Debug toolbar to end the debugging session. We're now going to step through a corrected version of the factorial script, but you may notice that the Variable window still displays a list of the variables and their values from the point at which you stopped executing. That's not necessarily a problem, but it is good to keep in mind.
-
Open a new script, paste in the code below, and save the script as debugger_walkthrough2.py
# This script calculates the factorial of a given # integer, which is the product of the integer and # all positive integers below it. number = 5 loopStop = number multiplier = 1 while multiplier < loopStop: number *= multiplier multiplier += 1 print (number) - Step through the loop a few times as you did above. Watch the values of the "number" and "multiplier" variables, but also the new "loopStop" variable. This variable allows the loop condition to remain constant while "number" is multiplied. Indeed, you should see "loopStop" remain fixed at 5 while "number" increases to 120.
- Keep stepping until you've finished the entire script. Note that the usual >>> prompt returns to indicate you've left debugging mode.
In the above example, you used the Debug toolbar to find a logical error that had caused an endless loop in your code. Debugging tools are often your best resource for hunting down subtle errors in your code.
You can and should practice using the Debug toolbar in the script-writing assignments that you receive in this course. Spending a little time to master the few simple steps of the debugger will save you tremendous amounts of time troubleshooting.