Global Energy Sources
The energy we use to support the whole range of human activities comes from a variety of sources, but as you all know, fossil fuels (coal, oil, and natural gas) currently provide the majority of our energy on a global basis, supplying about 81% of the energy we use:
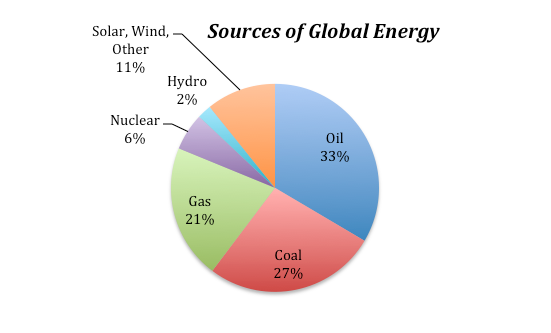
Figure 1. The current contributions to our global energy from different sources shows that fossil fuels account for 81% of our energy. Data from International Energy Agency (iea.org)
Click for a text description of the Sources of Global Energy chart.
The image is a pie chart titled "Sources of Global Energy," showing the distribution of different energy sources globally. The chart is divided into segments, each representing a different energy source with corresponding percentages:
- Oil: The largest segment, colored in blue, represents 33% of global energy sources.
- Coal: The second largest segment, colored in red, accounts for 27% of global energy.
- Gas: Represented by a green segment, gas makes up 21% of the energy mix.
- Solar, Wind, Other: This segment is yellow and constitutes 11% of the energy sources.
- Hydro: A light blue segment representing 2% of global energy.
- Nuclear: The smallest segment, colored in purple, accounts for 6% of the energy sources.
Each segment is labeled with the energy source and its percentage, providing a clear breakdown of the global energy composition.
Credit: David Bice @ Penn State is licensed under CC-BY-NC-4.0
The non-fossil fuel sources include nuclear, hydro (dams with electrical turbines attached to the outflow), solar (both photovoltaic and solar thermal), and a variety of other sources. These non-fossil fuel sources currently supply about 19% of the total energy.
The percentages of our energy provided by these different sources have clearly changed over time and will certainly change in the future as well. The graph below gives us some sense of how dramatically things have changed over the past 210 years:
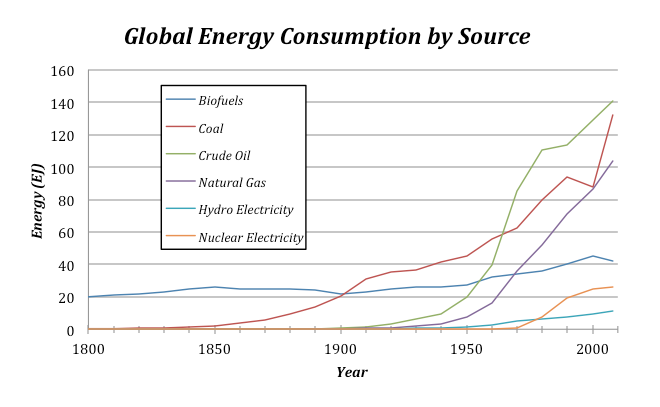
Figure 2. This plot shows the history of global energy production from different sources. Note that as time goes on, we are getting our energy from more sources. Data from Smil (2010).
Click for a text description of the Global Energy Consumption by Source graph.
The image is a line graph titled "Global Energy Consumption by Source," showing the consumption of various energy sources from the year 1800 to 2000. The y-axis represents energy consumption in exajoules (EJ), ranging from 0 to 160 EJ. The x-axis represents the years, marked at intervals from 1800 to 2000.
The graph includes data for five different energy sources, each represented by a different colored line:
- Biofuels: Represented by a light blue line, biofuel consumption starts at around 10 EJ in 1800 and shows a slight increase over time, peaking around 20 EJ by 2000.
- Coal: Represented by a red line, coal consumption starts near 0 EJ in 1800, begins to rise significantly around 1850, and continues to increase sharply, reaching approximately 120 EJ by 2000.
- Crude Oil: Represented by a green line, crude oil consumption starts near 0 EJ in 1850, increases steadily from around 1900, and rises sharply post-1950, reaching about 140 EJ by 2000.
- Natural Gas: Represented by a purple line, natural gas consumption starts near 0 EJ in 1900, with a notable increase starting around 1950, reaching around 100 EJ by 2000.
- Hydro Electricity: Represented by a dark blue line, hydroelectricity consumption starts near 0 EJ around 1900, with a gradual increase over time, reaching about 30 EJ by 2000.
- Nuclear Electricity: Represented by an orange line, nuclear electricity consumption starts near 0 EJ around 1950, with a sharp increase from that point, reaching around 30 EJ by 2000.
Key observations:
- Coal and crude oil show the most significant increases in consumption over the period.
- Natural gas consumption also rises sharply, particularly after 1950.
- Biofuels show a relatively flat trend, with a minor increase.
- Hydro and nuclear electricity consumption start later, but show steady growth over time.
- By 2000, crude oil has the highest consumption, followed by coal, natural gas, hydroelectricity, nuclear electricity, and biofuels in that order.
A legend in the top-left corner of the graph identifies the colors associated with each energy source.
Credit: David Bice @ Penn State is licensed under CC-BY-NC-4.0
There are a couple of interesting features to point out about this graph. For one, note that the total amount of energy consumed has risen dramatically over time — this is undoubtedly related to both population growth and the industrial revolution. The second point is that shifting from one energy source to another takes a long time. Oil was being pumped out of the ground in 1860, and even though it has a greater energy density and is more versatile than coal, it did not really make its mark as an energy source until about 1920, and it did not surpass coal as an energy source until about 1940. Of course, you might argue that the world changed more slowly back then, but it is probably hard to avoid the conclusion that our energy supply system has a lot of inertia, resulting in sluggish change.
