Introduction to Chi-Square Tests
 Read It: Chi-Square Tests
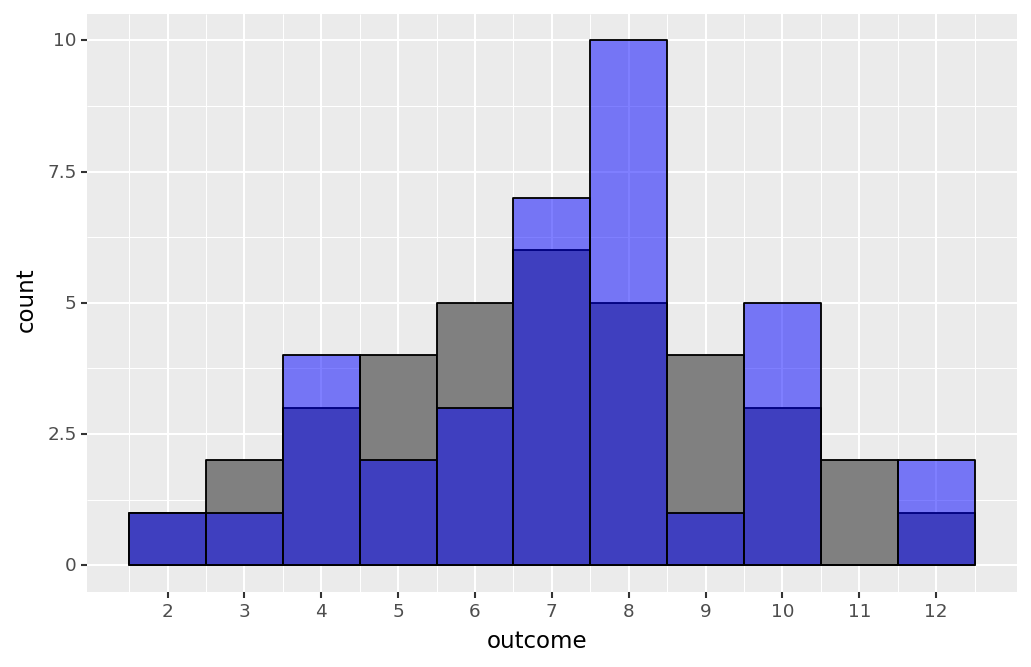
Imagine you have some data that is separated into categories. You are interested in determining if the frequencies (counts) in each category in your sample match those of the population. To answer this question, you can conduct a chi-square test! Here, "chi" is the Greek letter χ, which is pronounced "kai". For example, in the figure below, we show two histograms--the gray histogram is the theoretical rolls of two dice, while the blue is a sample of rolls. We could make some qualitative statements that compare the two plots. For instance, our sample includes more rolls of eight than the population, but the same amount of rolls of two. Often, however, we want to develop a more robust comparison than visual estimations. For this, we can conduct a chi-square test to confirm if the counts of each possible outcome are statistically significantly similar between the true population and the sample dataset.
To conduct a chi-square test, we first need to determine the hypotheses we will be testing. These hypotheses will look slightly different than those you learned in Lesson 5. As discussed in Lesson 5, the null hypothesis always uses equals signs. However, unlike the hypotheses in Lesson 5, for chi-square tests, the null hypothesis contains multiple proportions that are equal to the population proportions. Further, the alternative hypothesis is often written completely in words (i.e., no mathematical symbols). Generally, you can write something along the lines of "at least one proportion above is not as specified". An example of applying these hypotheses to the dice roll example is shown below.
Example of Hypotheses for Chi-Square Tests
To conduct a chi-square test, you need to implement the following steps:
- Define the hypotheses
- Compute the expected count for each category: where is the number of observations and is the population proportion
- Compute the sample chi-square statistic:
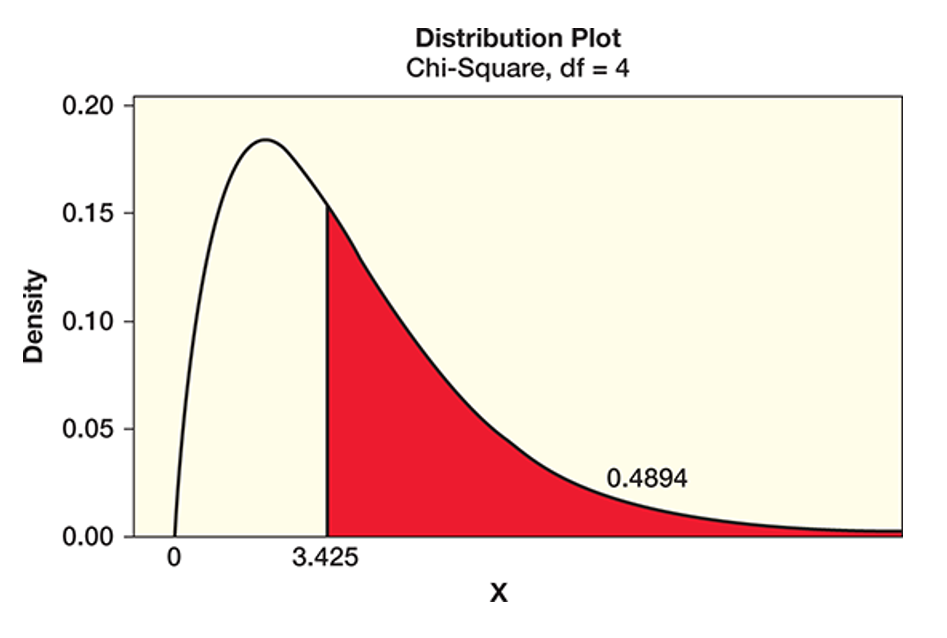
- Find the p-value based on the idealized chi-square distribution, shown in the figure below
- Make a conclusion based on the p-value
Generally, the chi-square distribution is find the p-value and make a subsequent conclusion. The chi-square distribution is interesting because it is always positive and is controlled by a single parameter, the "degrees of freedom", which we discussed in Lesson 6. Below, we show the distribution with 4 degrees of freedom. To calculate the p-value, we find the location of the test statistic and calculate the area under the curve and to the right of the sample statistic (this area is filled with red in the plot below). Generally, we will calculate the degrees of freedom as where is the number of categories in our dataset.
 Assess It: Check Your Knowledge