ANOVA breaks up the total variability of the sample values into two kinds of variability: 1.) the variability within the groups and 2.) the variability between the groups. If the variability between the groups is large compared to the variability within the groups, we can say that the groups have different means. In equation form, this idea is noted:
The terms are defined as:
-
: the total sum of squared deviations. This takes the distance of each data point from the mean of all data, squares that distance (so they’re all positive), and adds them all up. Thus, it measures the TOTAL VARIABILITY of the data.
-
: the sum of squared deviations for groups. This takes the distance of each group’s mean from the mean of all data (ungrouped), squares that distance, and adds the values up. Thus, it measures the VARIABILITY BETWEEN GROUPS.
-
: the sum of squares for error. For each group, this takes the distance of each data point in the group from the mean of that group, squares that distance, and adds them all up. Thus, it measures the VARIABILITY WITHIN THE GROUPS.
Our goal with the ANOVA test is to compare the variability BETWEEN groups to the variability WITHIN groups, however we can’t properly compare to directly since these use different amounts of data. So we need to look at the “mean square” for each:
Here, is the total sample size (number of data values in all groups together) and is the number of groups. The denominators, and represent the “degrees of freedom” (“df” or “dof” for short) for each term. We can then find the F-statistic as:
which effectively compares the variability BETWEEN groups (numerator) to the variability WITHIN groups (denominator). Thus, if the null hypothesis is true and the group means are actually equal, we expect the F-statistic to be about 1. Larger values of the F-statistics indicate a larger relative to , and thus a difference in means (or at least one mean).
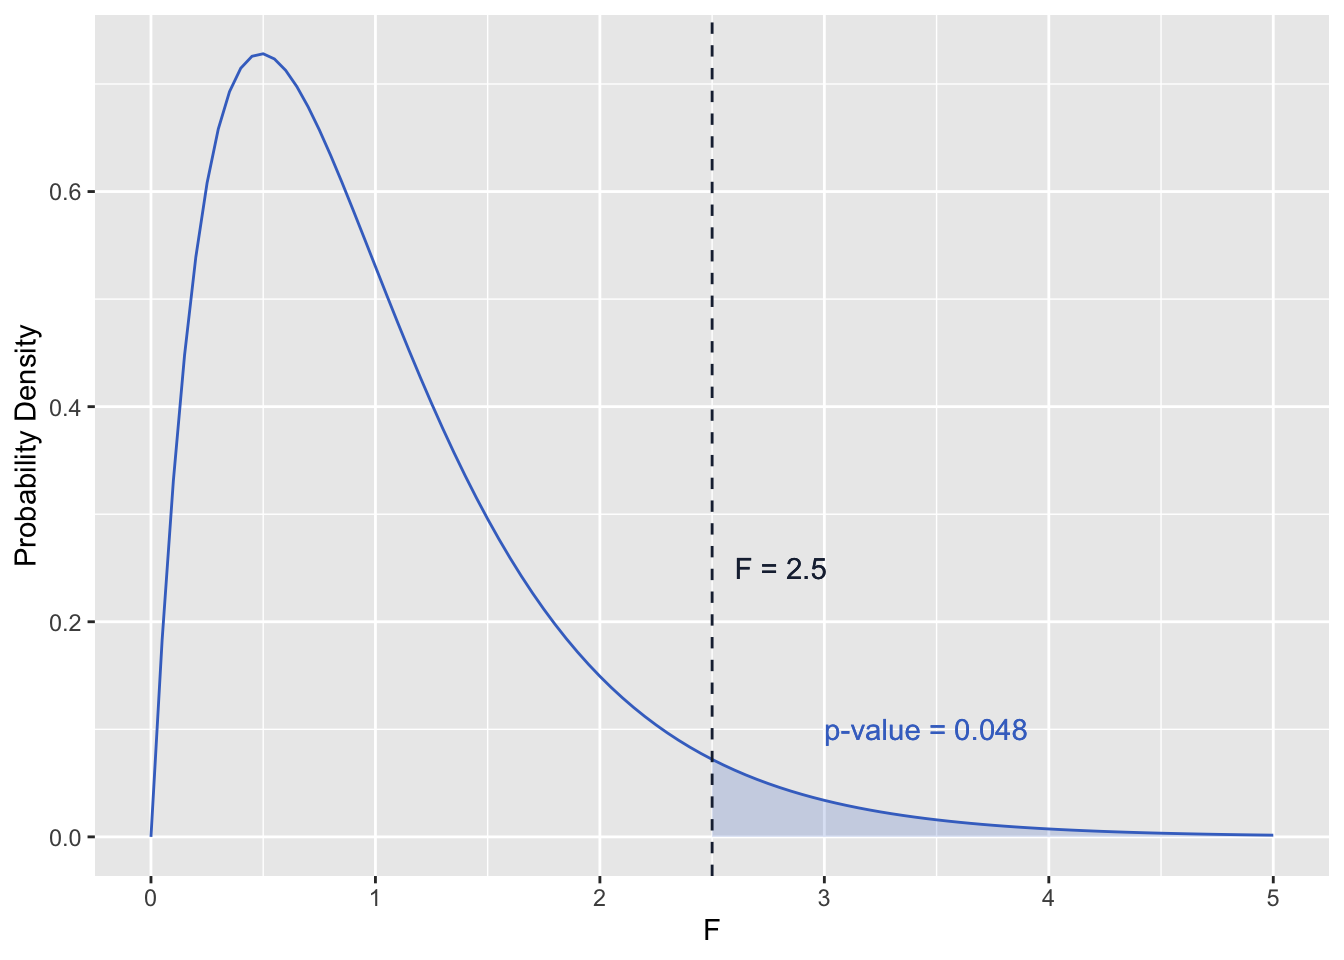
The F-distribution and p-value
The p-value for our ANOVA test depends on the F-statistic above and the degrees of freedom. The degrees of freedom determines the shape of the probability density function for F (an example is pictured below). The p-value is then the area under the probability density function and GREATER THAN the F-statistic calculated from the sample data (shaded area in the figure below).
One-way ANOVA Table
To facilitate an understanding of where the variability in the data is coming from, sometimes the results from an ANOVA test are presented in a table, typically taking the following format:
| Source of Variation | Degrees of Freedom | Sum of Squares | Mean Squares | F | p-value |
|---|---|---|---|---|---|
| BETWEEN | Area under F-distribution and greater than F-statistic | ||||
| WITHIN | |||||
| TOTAL |
 FAQ
FAQ