EME 210
Data Analytics for Energy Systems

Two-Way Chi-Square Tests

PrintPrint

Two-Way Chi-Square Tests

Read It: Two Chi-Square Test

So far in this lesson we have focused on one-way chi-square tests. These tests focus on comparing one categorical variable to known proportions. There is, however, another version of the chi-square test known as the two-way test. Two-way chi-square tests compare two categorical variables, rather than one. Additionally, the degrees of freedom are calculated differently:  df  = ( r 1 )  times  ( c 1 ) where r is the number of rows and c is the number of columns. Below, we demonstrate two tables that might be used in chi-square tests. The table on the left shows a single categorical variable, for which we would conduct a one-way chi-square test. Conversely, the table on the right shows a two-way table (e.g., there are categorical variables along the rows and columns), for which we would need to conduct a two-way chi-square test.
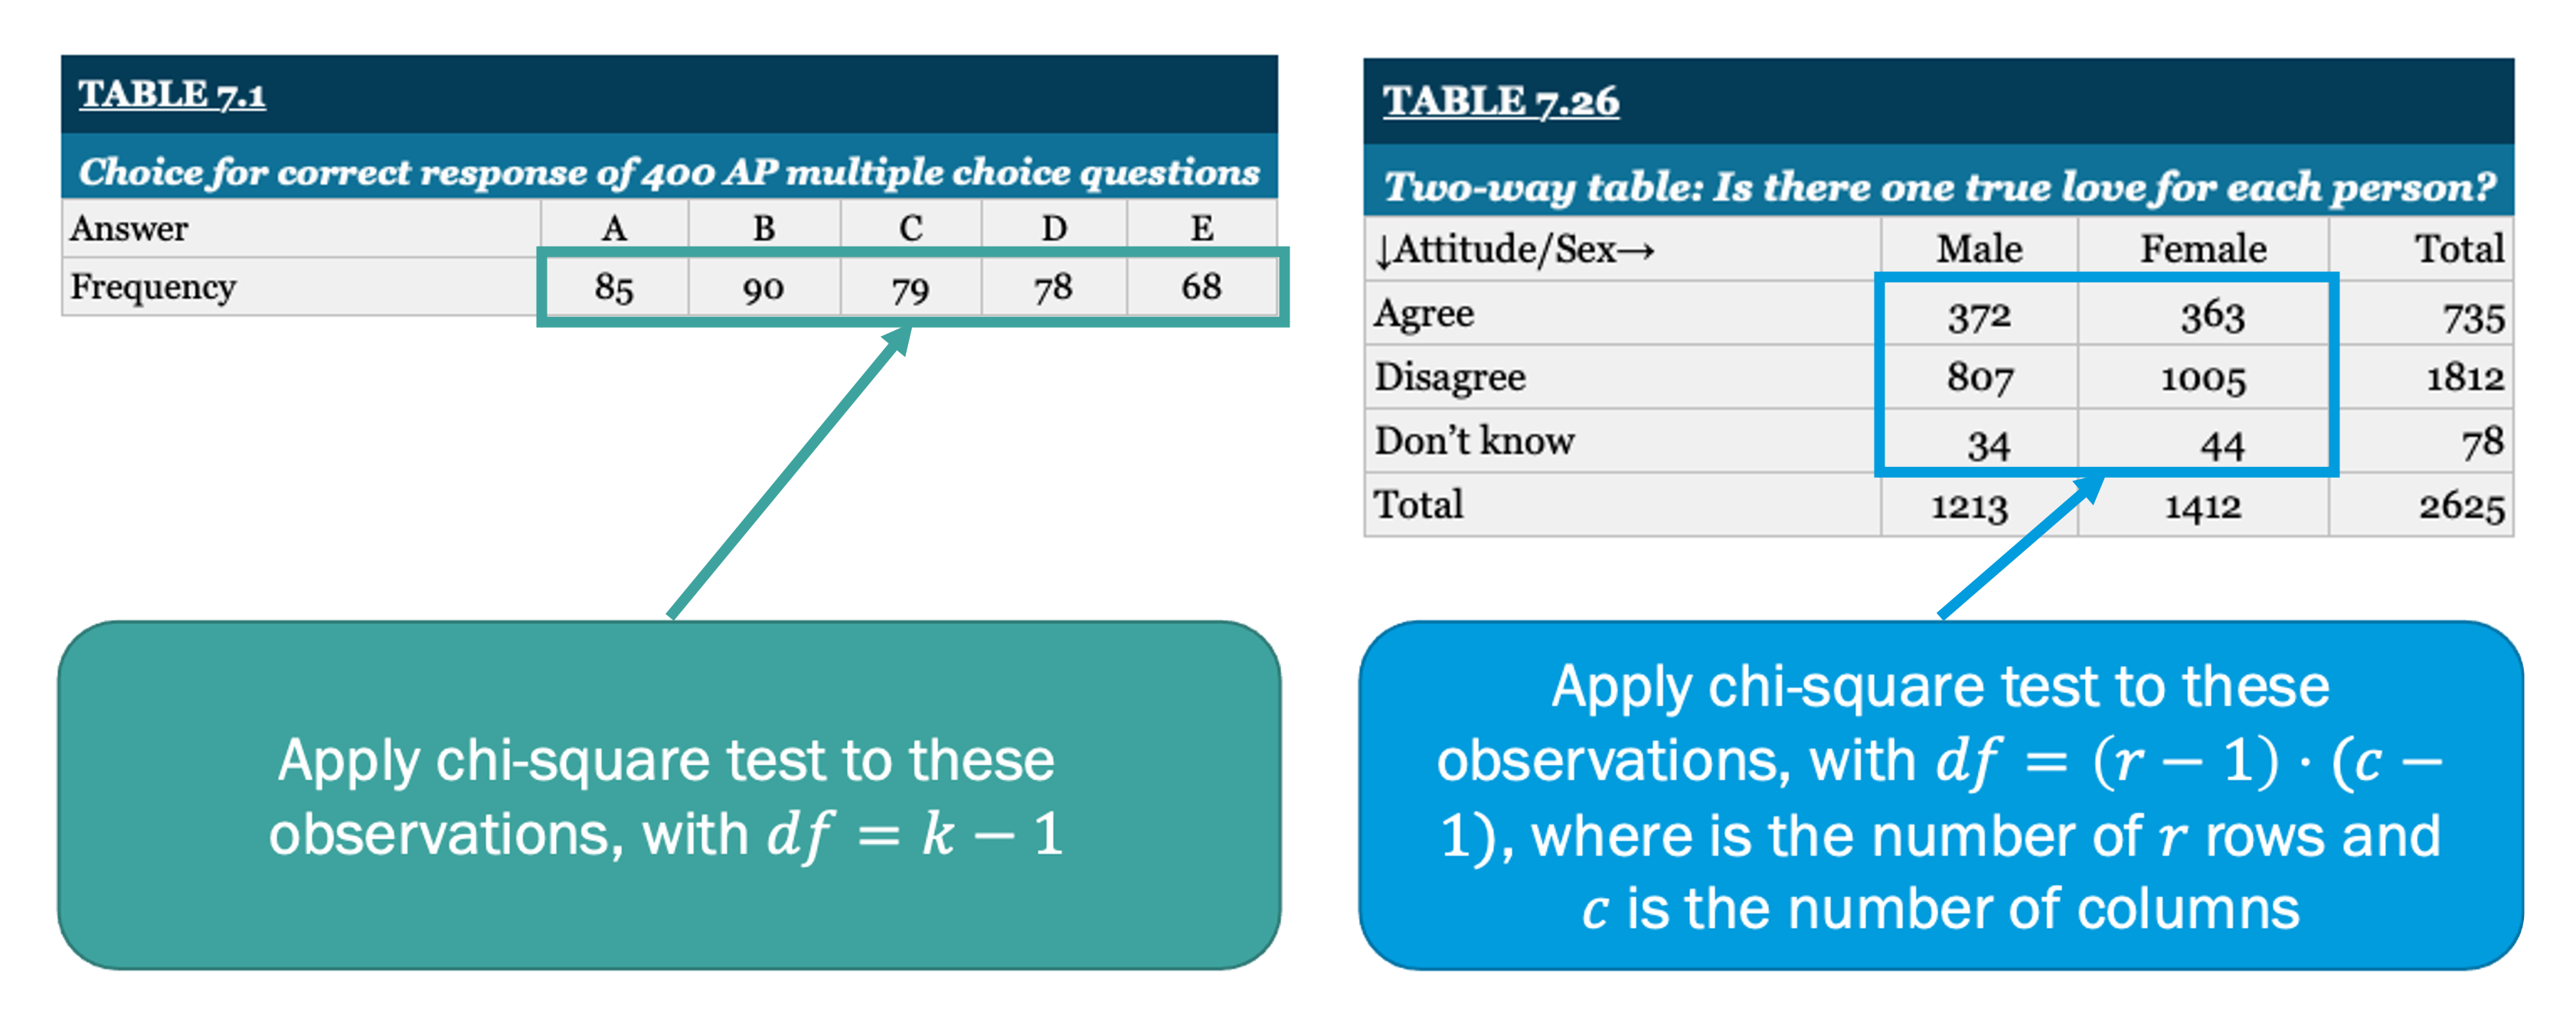
Two-way chi square table vs One-way. See image description below
One-Way vs. Two-Way Tables
Credit: © Penn State is licensed under CC BY-NC-SA 4.0

One-Way Table: One categorical variable
Table 7.1
Choice for correct response of 400 AP multiple choice questions
Answer A B C D E
Frequency 85 90 79 78 68
Two-Way Table: Two categorical variables
Table 7.26
Two-way table: Is there one true love for each person?
Attitude/Sex Male Female Total
Agree 372 363 735
Disagree 807 1005 1812
Don't know 34 44 78
Total 1213 1412 2625

Below, we provide a demonstration of a two-way chi-square test using the card drawing activity from earlier. In particular, we will use the stats.chi2_contingency command from the scipy.stats library. You can read more about this command here

 Watch It: Video - Two-Way Test (9:00 minutes)

Click here for a transcript.

Welcome back to the final video on chi-squared testing. So, in this video, I'm going to show you how we can conduct a two-way chi-square test. And so, our two-way chi-square test ends up looking a little different in terms of the null hypothesis. Essentially, we're looking at association in instead of equal proportions.

So, what we're going to do is we're going to do another card based draw, and we're essentially going to compare the suit to the chance of winning the game. And so, our null hypothesis is that there's no association between the suit that you draw and the chance of winning the game of war, meaning the highest card wins. An alternative is that there is an association. So, I've already done some setup here to get our data in a way that we can use this two-way table. And so, I'm using a new command called product, and then I'm using that to essentially build up this list of parentheses and then creating this data frame.

And essentially, what we're going to do when I draw cards, is that we're going to draw two cards at once, and we're going to count which one wins and record the suit. So, we're going to add a third column to this table and do some counting there. So, here I've got it set up. Table two count is going to be what we call it. And so, I've got six of hearts and four of hearts here. So, that means that hearts actually gets one loss and one win, and we're going to ignore any ties that we get. So, then the next two cards I have the nine of hearts and the queen of clubs. So, that means hearts get a loss and clubs gets a win.

Then I have a tie between two nines, so I'm just going to ignore those. Then I have the nine of diamonds and the six of clubs. So, that means clubs gets its first loss and diamonds gets its first win. Then I have king of clubs and five of spades. So, clubs gets a second win and spades gets a loss.

So, that means spades gets a win and a loss. Four of diamonds and three of spades. So, spades gets another loss and diamonds gets a win. Another tie. Queen of spades and ten of spades. So again, win and a loss, a tie, two tens. We've got an ace of clubs and an eight of hearts. So, that means clubs gets a win and hearts gets a loss. An ace of hearts and a three of clubs. So, hearts gets a win and clubs gets a loss.

So, spades gets a win, diamonds gets a loss, and we will do one more draw. So, a ten of diamonds and a three of hearts. So, diamonds gets a win and hearts gets a loss. And so, what we're going to do in the rest of this video is conduct a two-way chi-square test to see if there's any association between the suit and the chance of winning. And so, here we have our table just to show you what it looks like. We can run this. So, now we have the suit, whether or not they won and the count of that situation happening. And so, the first thing we need to do to conduct the two-way chi-square test is we need to reorganize this using cross tab. So, I'm going to call this table three, and I'm going to say PD cross tab.

We want to do table two of suit and table two of win with question mark. And then we want the values to be table two count. And then I'm going to specify that the app function is np dot sum and that the margins are set to false.

So, we can print this. And we can see that we've got essentially the wins no and yes, and we've got the suit. And that's the format that we need our data to be in. Because then when we conduct the test, we can say results equals stats dot chi-square, this time, underscore contingency. And then we just give it what we called our two-way table, table three. And we can print those results to show you what it looks like. So, they give us the chi square statistic, they give us the p value, the degrees of freedom, and they give us what the expected frequency is. So, a little bit more information than we see from the one-way chi-square test. But if we just wanted to print the p value, we can just say results one, which is this is the 0th point, so this is the first point. So, we can print that, and we can see that it's the same value .57. And so, we can draw a conclusion from that. We can say that the p value is greater than our 0.05.

So, there is not sufficient evidence to say there is an association between suit and winning. In other words, our null hypothesis that we are accepting says there is no association. And so, that is the conclusion that we make from this two-way chi-square test.

Credit: © Penn State is licensed under CC BY-NC-SA 4.0

Try It: GOOGLE COLAB

  1. Click the Google Colab file used in the video here.
  2. Go to the Colab file and click "File" then "Save a copy in Drive", this will create a new Colab file that you can edit in your own Google Drive account.
  3. Once you have it saved in your Drive, use the card drawing simulator linked here to create some data and implement a two-way chi-square test: 

Note: You must be logged into your PSU Google Workspace in order to access the file.

# draw cards and populated the table with the number of wins and losses by suit
table2['Count'] = [0, 0, # diamonds
                   0, 0, # hearts
                   0, 0, # clubs
                   0, 0] # spades

# reorganize the table using pd.crosstab
table3 = pd.crosstab(table2['Suit'], table2['Win?'], 
                     values = table2['Count'], 
                     aggfunc = np.sum, margins = False)

# conduct test
results = ...
results

# print p-value
print('p-value: ', ...)

Once you have implemented this code on your own, come back to this page to test your knowledge.


OPTION 2 : DATACAMP

 Try It: OPTION 2 DataCamp - Apply Your Coding Skills

Dictionaries are a quick way to create a variable from scratch. However, their functionality is limited, so we will often want to convert those dictionaries into DataFrames. Try to code this conversion in the cell below. Hint: Make sure to import the Pandas library.

# This will get executed each time the exercise gets initialized. # Create a Simple Dictionary mydict = {'Name':['Amy', 'Bob', 'Clair', 'Daisy'], 'Birthday':['9/3/1991', '4/21/1988', '4/21/1990', '11/11/1989'], 'Age':[31, 34, 32, 33]} # convert the dictionary to a DataFrame # print the values in the 'Birthday' column # Create a Simple Dictionary mydict = {'Name':['Amy', 'Bob', 'Clair', 'Daisy'], 'Birthday':['9/3/1991', '4/21/1988', '4/21/1990', '11/11/1989'], 'Age':[31, 34, 32, 33]} # convert the dictionary to a DataFrame import pandas as pd mydataframe = pd.DataFrame(mydict) # print the values in the 'Birthday' column mydataframe['Birthday']


 Assess It: Check Your Knowledge

Knowledge Check