Prioritize...
By the end of this section you should be able to describe how data mining works, know when to use it, and why it may be beneficial.
Read...
Big data, data mining, data analytics. These are all popular terms you probably have seen in the news recently. But what exactly is data mining, and how can it be used on weather data? Data mining might sound complicated, but in reality you already know all about it.
What is Data Mining?
What exactly is data mining? Well, let’s start by stating the goal. The general goal of data mining is to transform data into useful, sometimes actionable, information. It is the general process of looking through the data and finding key patterns that could be used to predict something. Data mining will examine massive amounts of information to determine which variables are pertinent and which are nonessential with respect to predicting the variable of interest.
When to use it?
This might sound amazing - we have an easy and quick way to obtain useful information in a predictive format. But I stress that you should not tread lightly. Data mining can be used for many reasons, but when abused, data mining can produce misleading results and erroneous interpretation. An understanding of what’s behind this data mining ‘machine’ is important. You should be able to answer questions such as: How did we find the patterns? Can we repeat them? What do the results actually mean?
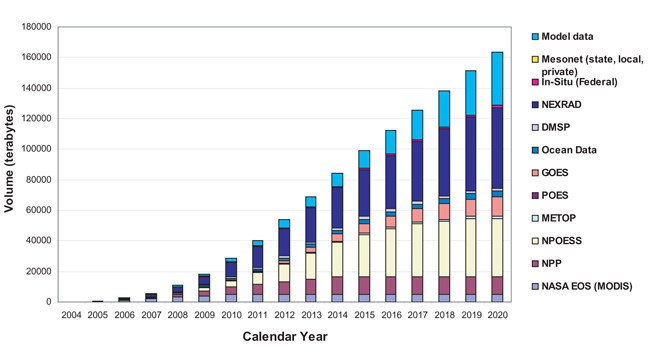
My suggestion is to use data mining for two purposes. The first purpose is to eliminate irrelevant data. Big data is called big data for a reason. There is an enormous amount of data out there, especially for weather and climate. Here is a graph illustrating the amount of data available from NOAA.
The second reason to use data mining is to provide an initial pass at predictive analytics. Use it to determine whether the data you collected can actually be used to predict the variable of interest. Then you can take the variables deemed essential and examine the model in more detail, evaluating and changing when necessary.
I want to stress that data mining should not be used as a one and done tool. Although the process can be helpful, letting a computer decide things can be risky. You need to know what’s going on inside the black box. Simply running a data mining scheme is not okay. A thoughtful reasoning behind the results is mandatory (at least for this class).
Process Overview
The process is pretty simple. Supply the data and let R do everything else. But like I stressed above, we will focus on what is actually being performed during the data mining process. Here is an overview of what we will do to set up the analysis. Each step will be discussed in more detail later on. As a reminder, there are many ways to go about data mining. This is just one example that utilizes the tools you have already learned.
- Prepare the Data -> This is incredibly important for data mining. You want a clean dataset (no missing values or invalid numbers).
- Visualize and Summarize the Data -> Don’t go into this process blindly. Look at the data, inspect it, make sure you caught all ‘odd’ values.
- Perform Regression Analysis -> The regression analysis is the pattern detection tool. This is where we look for the patterns. In this lesson, we will be focusing on two types of regression analyses:
- Multiple Linear Regressions -> Perform several linear regressions.
- Regression Trees -> Create a "20-questions" style tree to find nonlinear patterns.
- Evaluate the Models and Select -> You will create multiple models; you must select which one is best. But how do you decide?
- Predict -> Put the model to the test. Predict some independent cases and double check how well it does, further evaluating your model selection.
Pick a Question
Formulating the scope of the question can be difficult. A question that is too wide and expansive can make it difficult to interpret the results, but a question that is too specific doesn’t use data mining to its full advantage. You want the question to optimize the ability of data mining and your ability to interpret the results.
For this lesson, we are going to look at one case study, related to corn, with one question. The goal is to determine if weather data can play a role in the futures market of corn. Specifically, can weather data aid in the decision on whether to buy contracts for corn? To do this, we want to be able to predict the corn harvest. Here is my initial question:
Can the weather during the growing season be used to predict the corn harvest in the United States?
We can’t narrow our question down more until we get an idea of what data is available. It is narrow enough to give us a starting point to look for data, but broad enough that we can select a variety of variables.